Received 30 sep 2010 | Accepted 18 may 2011 | Published 14 Jun 2011 DOI: 10.1038/ncomms1354
In strongly correlated systems the electronic properties at the Fermi energy (EF) are intertwined
with those at high-energy scales. one of the pivotal challenges in the field of high-temperature superconductivity (HTsC) is to understand whether and how the high-energy scale physics
associated with mott-like excitations (|E − EF| > 1 eV) is involved in the condensate formation. Here,
we report the interplay between the many-body high-energy Cuo2 excitations at 1.5 and 2 eV, and
the onset of HTsC. This is revealed by a novel optical pump-supercontinuum-probe technique
that provides access to the dynamics of the dielectric function in Bi2sr2Ca0.92Y0.08Cu2o8 + δ over
an extended energy range, after the photoinduced suppression of the superconducting pairing. These results unveil an unconventional mechanism at the base of HTsC both below and above the
optimal hole concentration required to attain the maximum critical temperature (Tc).
1 Department of Physics, Università Cattolica del Sacro Cuore, Brescia I-25121, Italy. 2 Department of Physics, Università degli Studi di Trieste, Trieste
I-34127, Italy. 3 Laboratorio Nazionale TASC, AREA Science Park, Basovizza Trieste I-34012, Italy. 4 Department of Physics A. Volta, Università degli Studi
di Pavia, Pavia I-27100, Italy. 5 Faculty of Science & Technology, University of Twente, 7500 AE Enschede, The Netherlands. 6 Department of Physics &
Astronomy, University of British Columbia, Vancouver, British Columbia, V6T 1Z1 Canada. 7 Quantum Matter Institute, University of British Columbia,
Vancouver, British Columbia, V6T 1Z4 Canada. 8 Nanoelectronics Research Institute, National Institute of Advanced Industrial Science and Technology,
Tsukuba, Ibaraki 305-8568, Japan. 9 School of Physics and Astronomy, University of Minnesota, Minneapolis, Minnesota 55455, USA. 10 Département
de Physique de la Matière Condensée, Université de Genève, CH1211 Genève, Switzerland. 11 Sincrotrone Trieste S.C.p.A., Basovizza I-34127, Italy.
Correspondence and requests for materials should be addressed to C.G. (email: [email protected]).
Revealing the high-energy electronic excitations
underlying the onset of high-temperature
superconductivity in cuprates
Claudio Giannetti
1, Federico Cilento
2,3, stefano Dal Conte
4, Giacomo Coslovich
2,3, Gabriele Ferrini
1,
Hajo molegraaf
5, markus Raichle
6, Ruixing Liang
6,7, Hiroshi Eisaki
8, martin Greven
9, Andrea Damascelli
6,7,
Dirk van der marel
10& Fulvio Parmigiani
2,11T
he high-Tc copper-oxide (cuprate) superconductors are a particular class of strongly correlated systems in which the interplay1 between the Cu-3d and the O-2p states determines both the electronic structure close to the Fermi level as well as the high-energy properties related to the formation of Zhang–Rice singlets2 (hole shared among the four oxygen sites surrounding a Cu, and antiferromagnetically coupled to the Cu spin; energy EZR ~ 0.5 eV) and to the charge-transfer processes3 (∆CT ~ 2 eV). One of the unsolved issues of high-Tc superconductivity is whether and how the electronic many-body excitations at high-energy scales are involved in the condensate formation in the under- and over-doped regions of the superconducting dome. Solving this problem would provide a benchmark for unconventional models of high-Tc superconductivity, at variance with the BCS theory of conventional superconductivity, where the opening of the superconducting gap induces a significant rearrangement of the quasiparticle excitation spectrum over an energy range of only a few times 2∆SC (ref. 4).As the knowledge of the dielectric function ε(ω) provides direct information about the underlying electronic structure, opti-cal spectroscopic techniques have been widely used to investigate high-Tc superconductors5–17. Recently, equilibrium techniques revealed a superconductivity-induced modification of the CuO2 -planes’ optical properties involving energy scales in excess of 1 eV (refs 7, 11, 12, 14–17). These results suggested a possible supercon-ductivity-induced gain in the in-plane kinetic-energy on the under-doped side of the phase diagram18–20. However, the identification of the high-energy electronic excitations involved in the onset of high-temperature superconductivity (HTSC) has remained elusive because they overlap in energy with the temperature-dependent narrowing of the Drude-like peak.
Here we solve this question adopting a non-equilibrium approach to disentangle the ultrafast modifications of the high-energy spectral weight (SW=∫0 1∞s w w( )d , σ1(ω) = ε2(ω)·ω/4πi being the real part of the optical conductivity) from the slower broadening of the Drude-like peak induced by the complete electron-boson thermalization. As the superconducting gap (2∆SC) value is related to the total number of excitations21, an impulsive suppression22 of
2∆SC is achieved by photoinjecting excess quasiparticles in the super-conducting Bi2Sr2Ca0.92Y0.08Cu2O8 + δ crystals (Y-Bi2212), through an ultrashort light pulse (pump). Exploiting the supercontinuum spec-trum produced by a nonlinear photonic crystal fibre23 we are able to probe the high-energy (1.2–2.2 eV) modifications of the ab-plane optical properties at low pump fluences ( < 10 µJ cm−2), avoiding the complete vaporization of the superconducting phase22,24. This novel time-resolved optical spectroscopy (Methods) allows us to demonstrate the interplay between many-body electronic excita-tions at 1.5 and 2 eV and the onset of superconductivity both below and above the optimal hole concentration required to attain the maximum Tc.
Results
Equilibrium optical properties of Bi2Sr2Ca0.92Y0.08Cu2O8 + . The
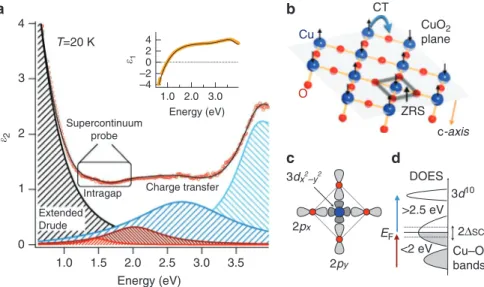
interpretation of time-resolved optical spectroscopy relies on the detailed knowledge of the equilibrium (intragap transitions) ε(ω) of the system. In Figure 1a, we report the real (ε1) and imaginary (ε2) parts of the dielectric function, measured on an optimally doped sample (Tc = 96 K, labelled OP96) by spectroscopic ellipsometry at 20 K (Methods). Below 1.25 eV, ε(ω) is dominated by the Drude response of free carriers coupled to a broad spectrum of bosons I2χ(Ω) (refs 25,26). In the high-energy region (ω > 1.25 eV), the interband transitions dominate. The best fit to the data (solid black lines) is obtained by modelling the equilibrium dielectric function as a sum of an extended Drude term (εD) and Lorentz oscillators at 0.5 eV and higher energies (εL, indexed by i): εeq(T,ω) = εD(T,ω) + ΣiεLi(T,ω) (Supplementary Note 1). The high-energy region of ε(ω) is characterized by interband transitions at w0i ~1.46, 2, 2.72 and 3.85 eV. The attribution of the interband transitions in cuprates is a subject of intense debate. As a general phenomenological trend, the charge-transfer (CT) gap edge (hole from the upper Hubbard band with dx y2− 2 symmetry to the O-2px,y orbitals, Fig. 1b,c) in
the undoped compounds is about 2 eV (ref. 5). Upon doping, a structure reminiscent of the CT gap moves to higher energies, while the gap is filled with states (intragap transitions) at the expense of spectral weight at ω > 2 eV (ref. 5, Fig. 1d). Dynamical mean field
3d10 Cu–O bands EF
a
Cu O CuO2 plane c-axis ZRSb
c
d
CT DOESIntragap Charge transfer Supercontinuum probe >2.5 eV <2 eV T=20 K 2∆SC 2py 4 2 0 –2 –4 �1 3.0 2.0 1.0 Energy (eV) 4 3 2 1 0 �2 3.5 3.0 2.5 2.0 1.5 1.0 Energy (eV) Extended Drude 2px 3dx2–y2
Figure 1 | Dielectric function of optimally doped Bi2Sr2Ca0.92Y0.08Cu2O8 + . (a) The high-energy region of the imaginary part of the ab-plane dielectric function, measured at T = 20 K for the optimally doped sample (estimated hole concentration p = 0.16, ref. 46), is shown. The thin black line is the fit to the data described in the text. The values of the parameters resulting from the fit are reported in the supplementary Table s1. The contributions of the individual interband oscillators at ω0i ~ 1.46, 2, 2.72 and 3.85 eV are indicated as colour-patterned areas. The real part of the dielectric function, with
the respective fit, is shown in the inset. supplementary Figure s1 shows the fits to the reflectivity for T = 300 and 100 K and the extracted I2χ(Ω).
(b) schematics of the ZRs and of the in-plane CT process between Cu and o atoms. (c) The atomic orbitals involved in the charge transfer and Zhang-Rice singlet (ZRs) are schematically indicated. (d) Cartoon of the electron density of states (DoEs) (ref. 27). The red and blue arrows represent transitions between mixed Cu–o states and involving a 3d10 configuration in the final state, respectively.
calculations of the electron spectral function and of the ab-plane optical conductivity for the hole-doped three-band Hubbard model recently found that the Fermi level moves into a broad (~2 eV) and structured band of mixed Cu–O character, corresponding to the Zhang–Rice singlet states27. The empty upper Hubbard band, which involves Cu–3d10 states, is shifted to higher energies with respect to the undoped compound, accounting for the blue shift of the optical CT edge to 2.5–3 eV. The structures appearing in the optical conductivity at 1–2 eV, that is, below the remnant of the CT gap, are mostly related to transitions between many-body Cu–O states at binding energies as high as 2 eV (for example singlet states) and states at the Fermi energy.
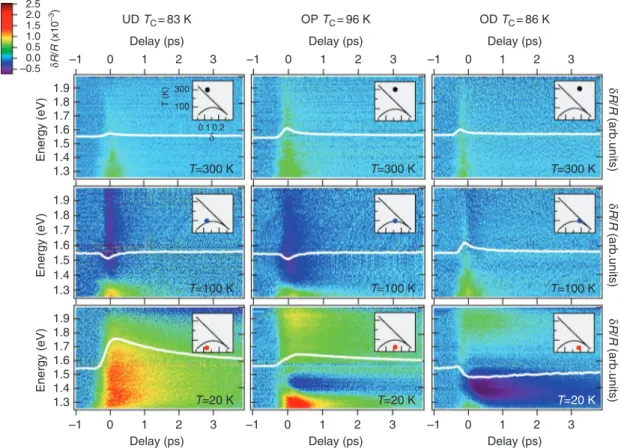
Time-resolved optical spectroscopy. In Figure 2, we report the time- and frequency-resolved reflectivity variation in the 1.2–2 eV spectral range (δR/R(ω,t) = Rneq(ω,t)/Req(ω,t)-1, where Rneq(ω,t) and Req(ω,t) are the non-equilibrium (pumped) and equilibrium (unpumped) reflectivities), for the normal (top row), pseudogap (middle row), and superconducting (bottom row) phases at three different dopings. In the normal state, δR/R(ω,t) is positive, with a fast decay over the whole spectrum, and independent of dop-ing. At T = 100 K, our frequency-resolved measurement reveals a more structured ω-dependence of δR/R(ω,t). In under- and optimally doped samples a positive variation is measured below ~1.35 eV, whereas a negative signal, with a fast decay time (~0.5 ps), extends up to 2 eV. The temperatures, at which the high-energy negative signal appears (T*~220 K for UD83, T*~140 K for OP96), linearly decrease as the doping increases and correspond to the onset of the universal pseudogap phase with broken time-reversal
symmetry28. In the overdoped sample, the negative response is nearly absent, whereas the positive structure at 1.3 eV persists. Below Tc, a slow δR/R(ω,t) dynamics appears. This response is strongly dop-ing-dependent, reversing sign when moving from the under- to the over-doped samples. The time-traces of the δR/R(ω,t) scans at 1.5 eV probe energy (Fig. 2) exactly reproduce the time-resolved reflectivi-ties obtained in the standard single-colour configuration29,30, that is, with fixed probe wavelength. The sudden increase of the decay time in the superconducting phase is generally attributed to a bot-tleneck effect in which the dynamics of quasiparticles is dominated by gap-energy bosons (Ω~2∆SC) emitted during the recombina-tion of Cooper pairs31–33. The experimental evidence of this bottle-neck in a d-wave superconductor, where the nodal quasiparticles do not emit finite-energy bosons, strongly suggests that the dynam-ics is dominated by antinodal excitations31 and is characterized by a transient non-thermal population in the k-space, as recently shown by time-resolved photoemission experiments34. These results are a benchmark for the development of realistic non-equi-librium models6,35,36 of strongly correlated superconductors, aimed at clarifying the nature of the bosonic glue responsible for high-Tc superconductivity.
Normal and pseudogap phases. Good spectral resolution is man-datory to obtain a reliable fit of a differential dielectric function δε(ω,t) = εneq(ω,t) − εeq(ω,t), where εneq(ω,t) and εeq(ω,t) are the non-equilibrium and equilibrium dielectric functions, to the mea-sured δR/R(ω,t) (Supplementary Note 2). In Figure 3a,b,c we report the maximum δR/R(ω,t), measured in the normal and pseudogap phases at t = 200 fs. At T = 300 K the fit to the data (black lines) is 1.9 1.8 1.7 1.6 1.5 1.4 1.3 Energy (eV) 3 2 1 0 –1 Delay (ps) 2.5 2.0 1.5 1.0 0.5 0.0 –0.5 3 2 1 0 –1 Delay (ps) δR /R (arb. units ) 3 2 1 0 –1 Delay (ps) δR /R (arb. units) 3 2 1 0 –1 Delay (ps) δR /R (a rb.units) 3 2 1 0 –1 Delay (ps) 1.9 1.8 1.7 1.6 1.5 1.4 1.3 Energy (eV) 1.9 1.8 1.7 1.6 1.5 1.4 1.3 Energy (eV) 3 2 1 0 –1 Delay (ps) 300 100 T (K) 0.2 0.1 UD TC= 83 K OP TC= 96 K OD TC= 86 K T=300 K T=300 K T=300 K T=100 K T=100 K T=100 K T=20 K T=20 K T=20 K δR /R (x10 –3) δ
Figure 2 | Energy- and time-resolved reflectivity on Bi2Sr2Ca0.92Y0.08Cu2O8 + . The dynamics of the reflectivity is measured over a broad spectral range. The two-dimensional scans of δR/R(ω,t) are reported for three different doping regimes (first column: underdoped (uD), Tc = 83 K; second column:
optimally doped (oP), Tc = 96 K; third column: overdoped (oD), Tc = 86 K), in the normal (first row), pseudogap (second row) and superconducting phases
(third row). see methods for estimation of hole content p. The insets display schematically the position of each scan in the T-p phase diagram of Bi2sr2Ca0.92Y0.08Cu2o8 + δ. The white lines (right axes) are the time traces at 1.5 eV photon energy.
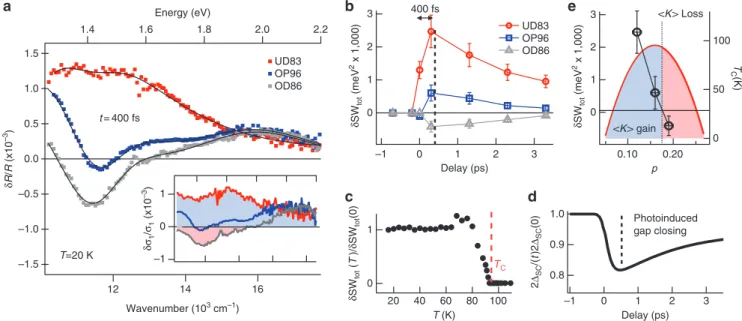
obtained by assuming an increase of the effective temperature, for all the doping levels. As the pseudogap phase is entered, the meas-ured δR/R(ω,t) becomes incompatible with a simple heating of the system. The nearly flat negative signal above ~ 1.5 eV is well repro-duced assuming an impulsive modification of the extended Drude model parameters, such as a weakening of the electron–boson cou-pling, without invoking any variation of the interband oscillators. Superconducting phase. In Figure 4a, we report the maximum δR/ R(ω,t), measured in the superconducting phase in the 1.2–2.2 eV energy range. At all doping levels, the data cannot be reproduced by modifying the extended Drude model parameters. The structured
variation of the reflectivity at high energies can be only accounted for by assuming a modification of both the 1.5 and 2 eV oscillators (Supplementary Note 2). The fits to the data automatically satisfy the Kramers–Kronig relations, because they are obtained as a differ-ence between Kramers–Kronig-constrained Lorentz oscillators, and are used to calculate the relative variation of the optical conductivity (δσ1/σ1(ω,t) shown in the inset of Figure 4a). The trend from posi-tive δσ1/σ1(ω,t) in the underdoped to a slightly negative δσ1/σ1(ω,t) in the overdoped samples reveals that the interband spectral weight variation (δSWtot = δω2p(1.5)/8 + δω2p(2)/8, ωp(1.5) and ωp(2) being the plasma frequencies of the 1.5 and 2 eV oscillators) strongly depends on the doping. We remark that, at higher probe energies
a
b
c
UD83 OP96 OD86
T=300 K T=300 K T=300 K T=100 K T=100 K 200 fs 200 fs 200 fs T=100 K 1 0 δR /R (× 10 –3) δR /R (× 10 –3) δR /R (× 10 –3) 2.0 1.8 1.6 1.4 Energy (eV) 1 0 2.0 1.8 1.6 1.4 Energy (eV) 1 0 2.0 1.8 1.6 1.4 Energy (eV)
Figure 3 | Energy-resolved spectra and differential fit in the normal and pseudogap phases. (a–c) The maximum δR/R(ω,t) = Rneq(ω,t)/Req(ω,t) − 1
(Rneq(ω,t) and Req(ω,t) being the non-equilibrium (pumped) and equilibrium (unpumped) reflectivities), measured in the normal (T = 300 K, yellow dots)
and pseudogap (T = 100 K, green dots) phases, is reported for different doping regimes (underdoped (uD83), Tc = 83 K; optimally doped (oP96),
Tc = 96 K; overdoped (oD86), Tc = 86 K). The solid lines are the differential fit to the data. The δR/R(ω,t) related to the effective temperature increase
is shown in the supplementary Figure s2. In both the normal and the pseudogap phases, the maximum of the fast reflectivity variation is measured at t = 200 fs, that is, directly after all the energy of the 140 fs pump pulses has been delivered to the system.
100 50 0 T C(K) 0.20 0.10 3 2 1 0 δSW to t (meV 2 x 1,000 ) 3 2 1 0 δSW to t (meV 2 x 1,000) δSW to t ( T )/δ SW to t (0) 3 2 1 0 –1 Delay (ps) 1.0 0.9 0.8 2∆ SC /( t)2 ∆SC (0) 3 2 1 0 –1 Delay (ps) 1 0 100 80 60 40 20 T (K) –1.5 –1.0 –0.5 0.0 0.5 1.0 1.5
a
b
c
d
e
δR /R (x10 –3) δσ1 /σ1 (x10 –3) 16 14 12 Wavenumber (103 cm–1) 2.2 2.0 1.8 1.6 1.4 Energy (eV) 1 0 –1 UD83 OP96 OD86 T=20 K t = 400 fs Photoinduced gap closing TC UD83 OP96 OD86 <K> gain <K> Loss 400 fs pFigure 4 | Energy-resolved spectra and differential fit in the superconducting phase. (a) The δR/R(ω,t) at t = 400 fs, that is, the delay at which the maximum signal is measured, is shown for three different dopings in the superconducting phase (T = 20 K). The black solid lines are differential fits to the data obtained assuming a modification of the 1.5 and 2 eV interband transitions. The values of the fitting parameters for the optimally doped sample (oP96) are reported in the supplementary Table s2. The inset displays the relative variation of the optical conductivity for the three dopings, obtained from the data. The scale of the horizontal axis is the same as in the main panel. (b) The spectral weight variation, δsWtot = δsW1.5 eV + δsW2 eV = δω2p
(1.5)/8 + δω2
p(2)/8 (ωp(1.5) and ωp(2) being the plasma frequencies of the interband Lorentz oscillators at 1.5 and 2 eV), is reported at different delays for
the three dopings. The maximum value of δsWtot corresponds to the minimum ∆sC value at ~ 400 fs, that is, after a partial electron-boson thermalization.
The error bars represent the standard deviation obtained from the fit. (c) The δsWtot value, relative to the extrapolated zero-temperature value, is
estimated from single-colour measurements and reported as a function of the temperature for oP96. similar results are obtained for uD83 and oD86. (d) The dynamics of the superconducting gap, assuming the proportionality between δR/R(ω,t) and the photoexcited quasiparticle density21,22, is reported
(supplementary note 4). At a pump fluence of 10 µJ cm − 2, the maximum gap decrease is ~ 20% at 400 fs delay time. (e), The black circles represent the
maximum δsWtot = δsW1.5 eV + δsW2 eV, observed at 400 fs, as a function of the doping level. The error bars take into account the stability of the differential
fit on the equilibrium dielectric function (supplementary notes 1,2). The left axis has the same units as panel b. The Tc–p phase diagram is reported on the
(3.14 eV), a negligible δR/R(t) value for OP96 is observed, confirm-ing that the transitions at energies larger than 2 eV are not signifi-cantly affected by the 2∆SC suppression.
Discussion
In the simple energy-gap model for conventional superconduc-tors37,38, small changes of the interband transitions, over a narrow frequency range of the order of ω0i ± ∆SC/, can arise from the open-ing of the superconductopen-ing gap at the Fermi level. In contrast to this model, the partial suppression of 2∆SC photoinduced by the pump pulse, induces a change of R(ω,t) over a spectral range (~1 eV) sig-nificantly broader than 2∆SC ~ 80 meV (ref. 39). This result reveals a dramatic superconductivity-induced modification of the Cu–O electronic excitations at 1.5 and 2 eV.
In the time-domain, we obtain that the dynamics of δSWtot (reported in Fig. 4b) is nearly exponential with a time constant τ = 2.5 ± 0.5 ps. The δSWtot variation is completely washed out at longer times ( > 5 ps), when the complete electron–boson thermali-zation broadens the Drude peak, overwhelming the contribution of δSWtot. It is worth noting that the photoinduced modifications of δSWtot vanish as Tc is approached from below (Fig. 4c), demon-strating that this effect is exclusively related to the impulsive par-tial suppression of 2∆SC. Further evidence of the direct relation between 2∆SC and δSWtot is obtained from a comparison with time-resolved experiments with probe energy in the mid-infrared40 and THz regions41,42, directly showing a recovery time of the supercon-ducting gap and condensate ranging from 2 to 8 ps, for different families of cuprates and different experimental conditions (that is, temperature and pump fluence). The correspondence between these timescales and the recovery time of δSWtot finally demonstrates the interplay between the excitations at 1.5 and 2 eV and the super-conducting gap 2∆SC. In addition, our results clarify the origin of the doping- and temperature-dependent δR/R(t) signal meas-ured in single-colour experiments24,29–33 at high-energy scales and demonstrate that the dynamics of 2∆SC(t) can be reconstructed exploiting the δR/R(t) signal measured at high-energies (Fig. 4d and Supplementary Note 4).
Assuming that the total spectral weight change of the interband transitions is compensated by an opposite change of the Drude-like optical conductivity, we can estimate a superconductivity-induced kinetic energy decrease of ~1–2 meV per Cu atom for the underdoped sample (Methods). This value is very close to the superconductivity-induced kinetic energy gain predicted by several unconventional models43,44. As we move from the under- to the over-doped side of the superconducting dome (Fig. 4e), we obtain that the modifica-tion of the SW of optical transimodifica-tions, involving excitamodifica-tions at 1.5 and 2 eV, completely accounts for the transition from a superconductiv-ity-induced gain to a loss of kinetic energy12,17–20, estimated by equi-librium optical spectroscopies, directly measuring the low-energy optical properties, and single-colour time-resolved reflectivity measurements29. This result indicates that most of the superconduc-tivity-induced modifications of the excitation spectrum and optical properties at the low-energy scale are compensated by a variation of the in-plane electronic excitations at 1.5 and 2 eV, demonstrating that these excitations are at the base of an unconventional supercon-ductive mechanism both in the under- and over-doped sides of the superconducting dome.
In conclusion, we have exploited the time-resolution of a novel pump-supercontinuum-probe optical spectroscopy to unambigu-ously demonstrate that, in Bi2Sr2Ca0.92Y0.08Cu2O8 + δ, the supercon-ductive transition is strongly unconventional both in the under- and over-doped sides of the superconducting dome, involving in-plane Cu–O excitations at 1.5 and 2 eV. When moving from below to above the optimal hole doping, the spectral weight vari-ation of these features entirely accounts for a crossover from a
superconductivity-induced gain to a BCS-like loss of the carrier kinetic energy 4,19,20.
Superconductivity-induced changes of the optical properties at high-energy scales (ω > 100∆SC) seem to be a universal feature of high-temperature superconductors5,7,11, indicating that the com-prehension of the interplay between low-energy excitations and the high-energy scale physics, associated with Mott-like excita-tions, will be decisive in understanding high-temperature super-conductivity.
Methods
Pump-supercontinuum-probe technique. The optical pump-probe setup is based on a cavity-dumped Ti:sapphire oscillator. The output is a train of 800 nm–140 fs pulses with an energy of 40 nJ per pulse. A 12-cm-long photonic crystal fibre, with a 1.6-µm core, is seeded with 5 nJ per pulse focused onto the core by an aspherical lens. The supercontinuum probe output is collimated and refocused on the sample through achromatic doublets in the near-IR/visible range. The 800 nm oscillator output (pump) and the supercontinuum beam (probe), orthogonally polarized, are non-collinearly focused onto the sample. The superposition on the sample and the spot dimensions (40 µm for the IR-pump and 20 µm for the supercontinuum probe) are monitored through a charge-coupled device camera. The pump fluence is ~10 µJ cm − 2. The probe beam impinges on the sample surface nearly perpendicu-larly, ensuring that the ab-plane reflectivity is measured. The reflected probe beam is spectrally dispersed through an SF11 equilateral prism and imaged on a 128-pixel-linear photodiode array (PDA), capturing the 620–1,000 nm spectral region. A spectral slice, whose width ranges from 2 at 620 nm to 6 at 1,000 nm, is acquired by each pixel of the array. The probe beam is sampled before the interaction with the pump and used as a reference for the supercontinuum intensity. The outputs of the two PDAs are acquired through a 22 bit/2 MHz fast digitizer, and are divided pixel by pixel to compensate the supercontinuum intensity fluctuations, obtaining a signal to noise ratio of the order of 10 − 4 acquiring 2,000 spectra in about 1 s. The differential reflectivity signal is obtained modulating the pump beam with a mechanical chopper and performing the difference between unpumped and pumped spectra. The spectral and temporal structure of the supercontinuum pulse has been determined either by exploiting the switching character of the photo-induced insulator-to-metal phase transition in a VO2 multifilm23 or by standard XFROG techniques. The data reported in Figure 2 have been corrected taking into account the spectral and temporal structure of the supercontinuum pulse.
Spectroscopic ellipsometry. The ab-plane dielectric function of the Bi2Sr2Ca0.92 Y0.08Cu2O8 + δ samples has been obtained by applying the Kramers–Kronig relations to the reflectivity for 50 cm − 1 < ω/2πc < 6,000 cm − 1 and directly from ellipsometry for 1,500 cm − 1 < ω/2πc < 36,000 cm − 1
. This combination allows a very accurate de-termination of ε(ω) in the entire combined frequency range. Due to the off-normal angle of incidence used with ellipsometry, the ab-plane pseudo-dielectric function had to be corrected for the c-axis admixture.
Samples. The Y-substituted Bi2212 single crystals were grown in an image furnace by the travelling-solvent floating-zone technique with a non-zero Y content in order to maximize Tc (ref. 45). The underdoped samples were annealed at 550 °C for 12 days in a vacuum-sealed glass ampoule with copper metal inside. The overdoped samples were annealed in a quartz test tube under pure oxygen flow at 500 °C for 7 days. To avoid damage of the surfaces, the crystals were embedded in Bi2Sr2CaCu2O8 + δ powder during the annealing procedure. In both cases, the quartz tube was quenched to ice-water bath after annealing to preserve the oxygen content at annealing temperature. For the optimally doped sample (OP96), the critical tem-perature reported (Tc = 96 K) is the onset temperature of the superconducting phase transition, the transition being very narrow (∆Tc < 2 K). As a meaningful parameter for the under- (Tc = 83 K, UD83) and over-doped (Tc = 86 K, OD86) samples, which have respective transition widths of ∆Tc~8 K and ∆Tc ~ 5 K, we report the transi-tion midpoint temperatures. The hole concentratransi-tion p is estimated through the phenomenological formula46 T
c/Tc,max = 1–82.6·(p−0.16)2, where Tc,max is the critical temperature of the optimally doped sample.
Kinetic energy. Below the critical temperature Tc, possible modifications of the high-energy spectral weight SW =h Σ ∫i 0∞s w wLi( )d , including the contribu-tion to the optical conductivity from all the possible interband transicontribu-tions i, must compensate the spectral weight of the condensate zero-frequency δ-function, SWδ, and the variation of the spectral weight of the Drude-like optical conductivity,
SW =(1/4 i)D p ∫0∞w e w wD( )d , related to the free carriers in the conduction band. This is expressed by the Ferrell–Glover–Tinkham sum rule4:
SWhN−SWhSC=SWd−SWDN+SWDSC
where the superscripts refer to the normal (N) and superconducting (SC) phases. (1) (1)
In the special case of a single conduction band within the nearest-neighbour tight-binding model43,44, the total intraband spectral weight SW
D can be related to the kinetic energy Tδ of the charge carriers (holes) associated to hopping process in the δ direction, via the relation43:
1 4 0 2 2 2 2 2 pi w e w w pD( )d dCu d ∞
∫
= a e − V T where aδ is the lattice spacing in the Cu–O plane, projected along the direction determined by the in-plane polarization δ of the incident light and VCu is the vol-ume per Cu atom. We obtain 〈 K 〉 = 2 〈 Tδ 〉 from the spectral weight variation of the interband oscillators, through the relation:
K T V a e =2 d =42 2 22 − d p Cu hN hSC SW SW
Considering VCu = Vunit cell/8~1.1·10 − 22 cm3 and aδ = aunit cell/√2~3.9 Å, we obtain that the kinetic energy can be calculated as 〈K〉 = 82[SW
hN–SWhSC]·(83 meV/eV2), where 82[SW
h N–SW
h
SC] is the interband spectral weight variation expressed in eV2. A finite value of SWhN–SWhSC thus implies a superconductivity-induced variation of the kinetic energy. To obtain the total kinetic energy variation related to the condensate formation, we estimate a photo-induced breaking of ~ 3–7% of the Cooper pairs (Supplementary Note 3), and we extrapolate the measured SWhN–SWhSC values, reported in Figure 4c–e, to the values corresponding to the breaking of 100% of the Cooper pairs.
References
1. Meinders, M. B. J., Eskes, H. & Sawatzky, G. A. Spectral-weight transfer: breakdown of low-energy-scale sum rules in correlated systems. Phys. Rev. B
48, 3916–3926 (1993).
2. Zhang, F. C. & Rice, T. M. Effective Hamiltonian for the superconducting Cu oxides. Phys. Rev. B 37, 3759–3761 (1988).
3. Zaanen, J., Sawatzky, G. A. & Allen, J. W. Band gaps and electronic structure of transition-metal compounds. Phys. Rev. Lett. 55, 418–421 (1985).
4. Tinkham, M. Introduction to Superconductivity, McGraw-Hill, (1996). 5. Basov, D. N. & Timusk, T. Electrodynamics of high-Tc superconductors.
Rev. Mod. Phys. 77, 721–779 (2005).
6. Basov, D. N., Averitt, R. D., van der Marel, D., Dressel, M. & Haule, K. Electrodynamics of Correlated Electron Materials. Rev. Mod. Phys (in the press).
7. Holcomb, M. J., Collman, J. P. & Little, W. A. Optical evidence of an electronic contribution to the pairing interaction in superconducting Tl2Ba2Ca2Cu3O10. Phys. Rev. Lett. 73, 2360–2363 (1994).
8. Tsvetkov, A. A. et al. Global and local measures of the intrinsic Josephson coupling in Tl2Ba2CuO6 as a test of the interlayer tunnelling mode. Nature 395, 360–362 (1998).
9. Basov, D. N. et al. Sum rules and interlayer conductivity of high-Tc cuprates. Science 283, 49–52 (1999).
10. Munzar, D., Bernhard, C., Holden, T., Golnik, A., Humlíček, J. & Cardona, M. Correlation between the Josephson coupling energy and the condensation energy in bilayer cuprate superconductors. Phys. Rev. B 64, 024523 (2001). 11. Rübhausen, M., Gozar, A., Klein, M. V., Guptasarma, P. & Hinks, D. G.
Superconductivity-induced optical changes for energies of 100∆ in the cuprates. Phys. Rev. B 63, 224514 (2001).
12. Molegraaf, H. J. A., Presura, C., van der Marel, D., Kes, P. H. & Li, M. Superconductivity-induced transfer of in-plane spectral weight in Bi2Sr2CaCu2O8+δ. Science 295, 2239–2241 (2002).
13. Kuzmenko, A. B., Tombros, N., Molegraaf, H. J. A., Grueninger, M., van der Marel, D. & Uchida, S. c-Axis optical sum rule and a possible new collective mode in La2 − xSrxCuO4. Phys. Rev. Lett. 91, 037004 (2003).
14. Boris, A. V. et al. In-plane spectral weight shift of charge carriers in YBa2Cu3O6.9. Science 304, 708–710 (2004).
15. Santander-Syro, A. F. & Bontemps, N. Comment to the paper ‘In-plane spectral weight shift of charge-carriers in YBa2Cu3O6.9’ by A. V. Boris et al.. Science 304, 708 (2004). arXiv:cond-mat/0503767v1 (2005).
16. Kuzmenko, A. B., Molegraaf, H. J. A., Carbone, F. & van der Marel, D. Temperature-modulation analysis of superconductivity-induced transfer of in plane spectral weight in Bi2Sr2CaCu2O8. Phys. Rev. B 72, 144503 (2005). 17. Santander-Syro, A. F. et al. In-plane electrodynamics of the superconductivity
in Bi2Sr2CaCu2O8+δ: energy scales and spectral weight distribution. Phys. Rev. B
70, 134504 (2004).
18. Marsiglio, F. Optical sum rule anomalies in the high-Tc Cuprates. J. Supercond.
Nov. Magn. 22, 269–273 (2009).
19. Deutscher, G. et al. Kinetic energy change with doping upon superfluid condensation in high-temperature superconductors. Phys. Rev. B 72, 092504 (2005).
20. Carbone, F. et al. Doping dependence of the redistribution of optical spectral weight in Bi2Sr2CaCu2O8+δ. Phys. Rev. B 74, 064510 (2006).
21. Nicol, E. J. & Carbotte, J. P. Comparison of s- and d-wave gap symmetry in nonequilibrium superconductivity. Phys. Rev. B 67, 214506 (2003).
(2) (2)
(3) (3)
22. Coslovich, G. et al. Inducing a superconducting-to-normal-state first-order phase transition in overdoped Bi2Sr2Ca0.92Y0.08Cu2O8+δ by ultrashort laser pulses. Phys. Rev. B 83, 064519 (2011).
23. Cilento, F. et al. Ultrafast insulator-to-metal phase transition as a switch to measure the spectrogram of a supercontinuum light pulse. Appl. Phys. Lett. 96, 021102 (2010).
24. Giannetti, C. et al. Discontinuity of the ultrafast electronic response of underdoped superconducting Bi2Sr2CaCu2O8+δ. Phys. Rev. B 79, 224502 (2009). 25. Hwang, J., Timusk, T., Schachinger, E. & Carbotte, J. P. Evolution of the bosonic
spectral density of the high-temperature superconductor Bi2Sr2CaCu2O8+δ. Phys. Rev. B 75, 144508 (2007).
26. van Heumen, E. et al. Optical determination of the relation between the electron-boson coupling function and the critical temperature in high-Tc cuprates. Phys. Rev. B 79, 184512 (2009).
27. de’ Medici, L., Wang, X., Capone, M. & Millis, A. J. Correlation strength, gaps, and particle-hole asymmetry in high-Tc cuprates: a dynamical mean field study of the three-band copper-oxide model. Phys. Rev. B 80, 054501 (2009). 28. Li, Y. et al. Unusual magnetic order in the pseudogap region of the
superconductor HgBa2CuO4+δ. Nature 455, 372–375 (2008).
29. Gedik, N. et al. Abrupt transition in quasiparticle dynamics at optimal doping in a cuprate superconductor system. Phys. Rev. Lett. 95, 117005 (2005). 30. Liu, Y. H. et al. Direct observation of the coexistence of the pseudogap and
superconducting quasiparticles in Bi2Sr2CaCu2O8+δ by time-resolved optical spectroscopy. Phys. Rev. Lett. 101, 137003 (2008).
31. Gedik, N. et al. Single-quasiparticle stability and quasiparticle-pair decay in YBa2Cu3O6.5. Phys. Rev. B 70, 014504 (2004).
32. Kabanov, V. V., Demsar, J., Podobnik, B. & Mihailovic, D. Quasiparticle relaxation dynamics in superconductors with different gap structures: theory and experiments on YBa2Cu3O7. Phys. Rev. B 59, 1497–1506 (1999). 33. Kabanov, V. V., Demsar, J. & Mihailovic, D. Kinetics of a superconductor
excited with a femtosecond optical pulse. Phys. Rev. Lett. 95, 147002 (2005). 34. Cortès, R., Rettig, L., Yoshida, Y., Eisaki, H., Wolf, M. & Bovensiepen,
U. Momentum-resolved ultrafast electron dynamics in superconducting Bi2Sr2CaCu2O8+δ. arXiv:1011.1171v1 (2010).
35. Eckstein, M. & Kollar, M. Theory of time-resolved optical spectroscopy on correlated electron systems. Phys. Rev. B 78, 205119 (2008).
36. Schirò, M. & Fabrizio, M. Time-Dependent mean field theory for quench dynamics in correlated electron systems. Phys. Rev. Lett. 105, 076401 (2010). 37. Dresselhaus, G. & Dresselhaus, M. S. Interband transitions in superconductors.
Phys. Rev. 125, 1212–1214 (1962).
38. Dobryakov, A. L., Farztdinov, V. M., Lozovik, Y. E. & Letokhov, V. S. Energy gap in the superconductor optical spectrum. Opt. Comm. 105, 309–314 (1994). 39. Yu, G., Motoyama, E. M. & Greven, M. A universal relationship between
magnetic resonance and superconducting gap in unconventional superconductors. Nature Phys. 5, 873–875 (2009).
40. Kaindl, R. A. et al. Ultrafast mid-infrared response of YBa2Cu3O7 − δ. Science
287, 470–473 (2000).
41. Kaindl, R. A., Carnahan, M. A., Chemla, D. S., Oh, S. & Eckstein, J. N. Dynamics of Cooper pair formation in Bi2Sr2CaCu2O8+δ. Phys. Rev. B 72, 060510(R) (2005).
42. Averitt, R. D., Rodriguez, G., Lobad, A. I., Siders, J. W. L., Trugman, S. L. & Taylor, A. J. Nonequilibrium superconductivity and quasiparticle dynamics in YBa2Cu3O7 − δ. Phys. Rev. B 63, 140502(R) (2001).
43. Hirsch, J. E. & Marsiglio, F. Optical sum rule violation, superfluid weight, and condensation energy in the cuprates. Phys. Rev. B 62, 15131–15150 (2000). 44. Norman, M. R. & Pépin, C. Quasiparticle formation and optical sum rule
violation in cuprate superconductors. Phys. Rev. B 66, 100506(R) (2002). 45. Eisaki, H. et al. Effect of chemical inhomogeneity in bismuth-based copper
oxide superconductors. Phys. Rev. B 69, 064512 (2004).
46. Presland, M., Tallon, J., Buckley, R., Liu, R. & Flower, N. General trends in oxygen stoichiometry effects on Tc in Bi and Tl superconductors. Physica C
176, 95–105 (1991).
Acknowledgments
We acknowledge valuable discussion from M. Capone, E. van Heumen, P. Marchetti, F. Carbone and P. Galinetto. F.C., G.C., and F.P. acknowledge the support of the Italian Ministry of University and Research under Grant Nos. FIRBRBAP045JF2 and FIRB-RBAP06AWK3. The crystal growth work was supported by DOE under Contracts No. DE-FG03-99ER45773 and No. DE-AC03-76SF00515 and by NSF under Grant No. DMR9985067. The work at UBC was supported by the Killam Program (A.D.), the Alfred P. Sloan Foundation (A.D.), the CRC Program (A.D.), NSERC, CFI, CIFAR Quantum Materials, and BCSI.
Author contributions
C.G. and F.P. conceived the project and the time-resolved experiments. C.G. coordinated the research activities with input from all the coauthors, particularly F.P., A.D., D.vdM. and M.G. C.G., F.C. and G.F. designed and developed the pump-supercontinuum-probe technique. C.G., F.C., S.D.C. and G.C. performed the time-resolved measurements and analysed the data. M.R., R.L., H.E., M.G. and A.D. produced and characterized the crystals. H.M. and D.vdM
performed the equilibrium spectroscopic ellipsometry measurements. The text was drafted by C.G. with inputs from F.P., A.D. and D.vdM. All authors extensively discussed the results and the interpretation, and revised the manuscript.
Additional information
Supplementary Information accompanies this paper at http://www.nature.com/ naturecommunications
Competing financial interests: The authors declare no competing financial interests.
Reprints and permission information is available online at http://npg.nature.com/ reprintsandpermissions/
How to cite this article: Giannetti, C. et al. Revealing the high-energy electronic excitations underlying the onset of high-temperature superconductivity in cuprates.
Nat. Commun. 2:353 doi: 10.1038/ncomms1354 (2011).
License: This work is licensed under a Creative Commons Attribution-NonCommercial-Share Alike 3.0 Unported License. To view a copy of this license, visit http://