UNIVERSITY OF MESSINA
Department of Economics
PhD in Economics, Management and Statistics
XXXIII CYCLE
Assessing performance evaluation and credit
risk of energy companies with Multicriteria
decision models
Maria Rosaria Pappalardo
Supervisor
PhD Coordinator
Prof. Silvia Angilella
Prof. Edoardo Otranto
i
Publications
1. Silvia Angilella, Maria Rosaria Pappalardo (2020). Performance assessment of energy companies
employing Hierarchy Stochastic Multi-Attribute Acceptability Analysis. Operational Research,
Springer Journal. DOI: 10.1007/s12351-020-00567-5. The journal is indexed in Scopus within Area 13 for ANVUR purposes.
Working papers in conference proceedings
1. Silvia Angilella, Maria Rosaria Pappalardo. Hierarchy Stochastic Multi-Attribute Acceptability
Analysis: Performance evaluations of energy companies, published in EasyChair Amases 2019.
https://easychair.org/conferences/submission?submission=4406941;a=21870110
Conferences
1. Talk in the 43th Annual Meeting of the Italian Association for Mathematics Applied to Economic and
Social Sciences (AMASES, Department of Mathematics and Computer Science and Department of Economics, University of Perugia, (Italy), 9-11 September 2019. Two-Levels Hierarchy Stochastic
Multi-Attribute Acceptability Analysis: performance evaluations of energy companies. Session’s title: Multiple Criteria Decision Making (MCDM).
2. Auditor in the 89th meeting of the EURO working group on Multi-Criteria Decision Aiding
(EWG-MCDA), Department of Industrial Engineering, University of Trento (Italy), 11-14 April 2019 3. Auditor in the 90th meeting of the EURO working group Multi-Criteria Decision Aiding
(EWG-MCDA), Brest Campus of the Technological University IMT Atlantique, University of Brest (France), 26-28 September 2019
4. Auditor in the 44th Annual Meeting of the Italian Association for Mathematics Applied to Economic
and Social Sciences (AMASES, Department of Mathematics, University of Padova (Italy), 18 September 2020, remote mode)
ii
I wish to express my sincere gratitude to my supervisor, Prof. Silvia Angilella, for her precise and constant guidance throughout my doctoral studies. Her knowledge and wide expertise in the field of multi-criteria models, allow me to face with a completely new area of research than when I started this academic path. Indeed, thanks to her patience and full support, I began to handle with the basic notions of Multi Criteria Decision Aid first and to go deeper through even complex mathematical structures and applications then.
I would also like to thank the two anonymous reviewers of the study presented in the second Chapter of this thesis, the participants of the XLIII Annual Meeting of the Italian Association for Mathematics Applied to Economic and Social Sciences (AMASES), whose comments have helped to improve this paper and allowed its publication in the journal of Operational Research.
I am also grateful to Prof. Michalis Doumpos to provide me the MATLAB code for the development of the M.H.DIS model, outlined in Chapter 3.
Moreover, I am also thankful to the two reviewers of this thesis, Dr. Marco Cinelli and Prof. Constantin Zopounidis, for having contributed to refine this work through their interesting observations and suggestions.
On a more personal level, my overwhelming thankfulness goes to my entire family for putting up with and supporting me during these years of considerable commitment.
At last, but not for least, a special thanks to my boyfriend Mario for his constant presence, measureless help and moral support during the various moments of discouragement, without whom the drafting of this thesis would have been only a dream.
iii
Performance evaluation is a structured process that allows to assess the management efficiency of investment projects, workforce or business progress. Organizations that focus on managerial evaluation are more competitive and sustainable than those who do not, thereby creating greatest opportunities for growth and development (Cheymetova and Scherbakov, 2017).
Performance evaluation, however, is not an easy task to perform. Firstly, because it involves several parties (the appraisal, the organization to be evaluated, and a third party in the case in which the company is engaged in commitments to be fulfilled within a certain time frame, APEC Energy Working Group, 2013). Secondly, because it implies a continuous monitoring process for providing transparent feedback in an ever-changing environment. Thirdly, because it requires to identify the most relevant indicators and to manage them simultaneously.
The need to have relevant performance measures, which reflect the whole organization value, along with reliable methods able to make, as much as possible, a proper performance evaluation, is even more important for those companies operating in the key economic sectors.
In this regard, the energy industry is one of the leading sectors of the modern society that enhances the social and economic development of a country. As stated by the document of the European bank for reconstruction and development (EBRD, 2013): “Economies run on energy; it fuels all commercial and public life”.
During the last decades, the energy sector has gone through several deregulation phases, allowing for the new entrance of competitors to buy and sell electricity. This renewed competitive structure has led different categories of stakeholders (utilities, governments, investors) to face with unprecedented complex problems, such as more alternatives to evaluate (energy companies), multiple and conflictual criteria to manage (technical, environmental, socio-economic) and a higher level of uncertainty to deal with (Diakoulaki et al., 2005), that were no longer solvable with traditional models.
Multi criteria decision aid (MCDA) models, thanks to their multi-dimensional nature, easiness of application and ability to include different Decision Maker’s preferences, appear as the most suitable models to help multiple decision makers in solving two of the most crucial issues of the energy sector: the performance evaluation and the credit risk assessment of energy companies.
The first problem arises from the more extensive role of investment plans in stimulating energy companies’ business growth, through innovations of services, delivery manner and used technologies. Thus, a closer inspection of the firm’s state of health is required in decision-making process to optimize capital allocation and therefore to identify the best alternative within the multidimensional context of the energy system performance.
iv
The second one derives from the fact that serious episodes of energy companies’ failures have occurred after liberalization policies, leading countries where they took place, to considerable economic losses. In order to prevent these potential financial crashes, it is needed the use of proper risk assessment models, which are able to predict failures with a high accuracy rate.
Despite the great relevance of the energy sector in the modern economy, the existing MCDA literature on firms’ performance evaluation and credit risk assessment is not so wide and limited to the analysis of financial dimension.
In order to deal with the aforementioned issues and to fill the present research gap, this thesis is organized as follows.
Chapter 1 provides a general overview of the energy sector, in view of the recent energy transition policies towards renewable power sources. The focus is on the relationship between energy consumption and economic growth of past few years (Section 1.1) and the structure of the Electric Power System with regard to the role of government in avoiding energy companies’ failures (Section 1.2). Moreover, we highlight the role of multi-criteria methods in the performance evaluation and credit risk assessment (Section 1.3) and the key notions on which the MCDA models applied in this study are based, i.e. HSMAA, M.H.DIS and PROMETHEE (Section 1.4).
Chapter 2 analyses the development of a performance assessment model, the Hierarchy Stochastic Multi-Attribute Analysis (HSMAA), for the most important listed companies operating in the energy sector, using a dataset obtained merging different sources.HSMAA is employed to handle with a hierarchical criteria structure and imprecision on criteria weights, enabling to evaluate the performances of companies under different uncertainty scenarios.
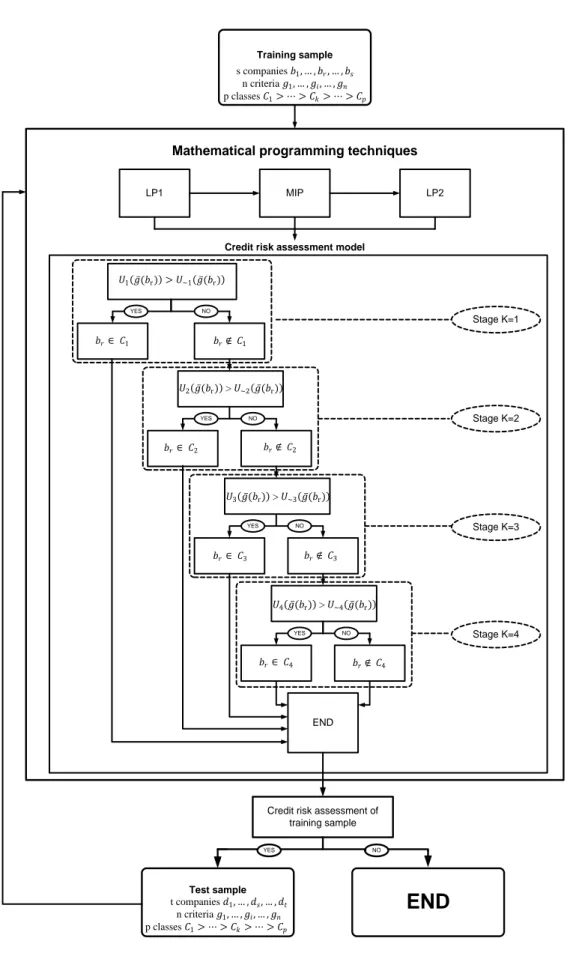
Chapter 3 presents the implementation of a non-parametric multiple criteria decision aiding (MCDA) model, the Multi-group Hierarchy Discrimination (M.H.DIS) model, with the Preference Ranking Organization Method for Enrichment Evaluations (PROMETHEE), to evaluate the average accuracy rate in correctly predicting the failure risk of a dataset of European unlisted companies operating in the energy sector.
v
Contents
List of publications ... i Acknowledgments ... ii Introduction ... iii Contents ... vList of tables ... vii
List of figures ... ix
Chapter 1
The energy sector and the role of MCDA models ... 1
1.1 The impact of energy sector on global economy ... 1
1.1.1 The renewable energy and the sustainable development ... 5
1.2 The structure of the Electric Power System and the role of government. ... 7
1.2.1 The Liberalization of electricity supply in Europe ... 8
1.3 The role of MCDA methods in the performance evaluation and credit risk assessment of energy companies ... 12
1.3.1 Basic notions of MCDA models ... 12
1.3.2 Multi-criteria Decision Analysis in the energy sector ... 17
1.3.3 Literature review on MCDA models employed in firms’ performance evaluation and credit risk assessment: filling the gaps and outlining the motivations ... 24
1.4 The MCDA models applied in this study ... 29
1.4.1 Hierarchy Stochastic Multi-Attribute Acceptability analysis (HSMAA) ... 29
1.4.2 Multi-group Hierarchy Discrimination model (M.H.DIS) ... 32
1.4.3 Preference Ranking Organization Method for Enrichment Evaluations (PROMETHEE II) ... 39
Chapter 2
Performance assessment of energy companies employing Hierarchy
Stochastic Multi-Attribute Acceptability Analysis ... 42
2.1 Background ... 42
2.2 Literature review ... 44
2.3 Data ... 47
2.3.1 Data collection and alternatives ... 47
2.3.2 Family of criteria ... 48
vi
2.5 Results and discussions ... 57
2.5.1 Ranking of energy companies’ performances ... 57
2.5.2 Further comments on the results ... 65
2.6 Conclusions and policy implications ... 67
Chapter 3
Assessment of a failure prediction model in the energy sector: a
multicriteria discrimination approach with PROMETHEE based
classification ... 71
3.1 Background ... 71
3.2 Data collection ... 73
3.3 M.H.DIS model building ... 75
3.3.1 Independent variables selection: literature review in failure prediction models ... 76
3.3.2 Independent variables selection: Information value, t-test and correlation analysis ... 78
3.4 M.H.DIS model development and main results ... 80
3.5 PROMETHEE based classification ... 83
3.6 Results and discussions of M.H.DIS model developed on the PROMETHEE based classification ... 86 3.7 Conclusions ... 93
Chapter 4
Concluding remarks ... 96
Appendix A ... 103 Appendix B ... 112References ... 116
vii
List of tables
Table 1.1 Most used criteria and sub-criteria in energy planning studies employing multi-criteria methods (Wang et al., 2009; Antunes and Martins, 2014; Ibáñez-Forés et al., 2014;
Luthra et al., 2015; Strantzali and Aravossis, 2016) ... 19
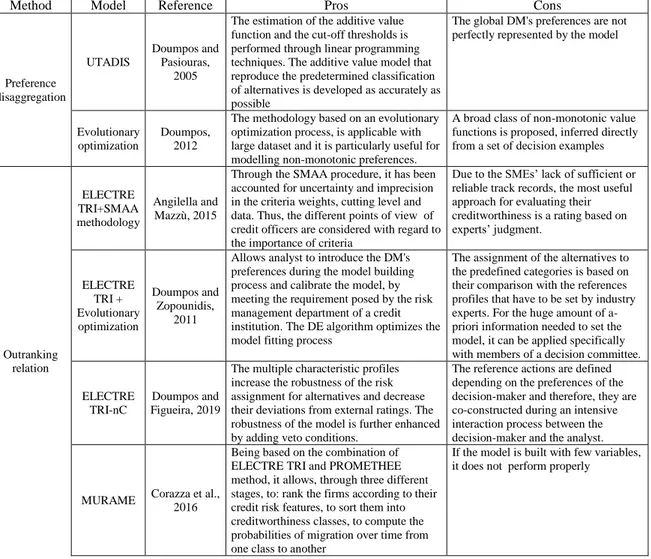
Table 1.2 Classification of MCDA methods by application area (Abu-Taha, 2011; Strantzali and Aravossis 2016; Pohekar and Ramachandran, 2004; Mardani et al., 2015) . 22 Table 1.3 Pros and Cons of the main MCDA sorting models employed for credit scoring and failure prediction problems (Mousavi and Lin, 2020). ... 27
Table 1.4 Mathematical programming problems solved by M.H.DIS model. Authors’ elaboration ... 35
Table 2.1 Studies using SMAA methodologies for the energy management (Pelissari et al., 2019). ... 44
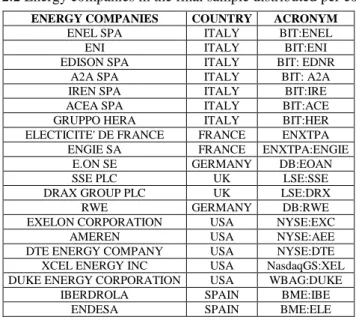
Table 2.2 Energy companies in the final sample distributed per country. ... 48
Table 2.3 Pearson correlation coefficients among financial criteria. Sources: Statistical Software Stata ... 49
Table 2.4 Description of the variables ... 55
Table 2.5 The considered scenarios ... 56
Table 2.6 Performance matrix. Authors’ elaboration. ... 57
Table 2.7 Performance matrix with the outliers trimmed to the maximum and minimum values. Authors’ elaboration. ... 59
Table 2.8 Summary Statistics in case (1) ... 60
Table 2.9 Case (1) “First Scenario”: Rank acceptability indices ... 62
Table 2.10 Shannon entropy computed on data trimmed for case (1), case (2) and at each dimension. Authors’ elaboration. ... 67
Table 3.1 Balanced sample after the stratified resampling method. Authors’ elaboration .. 74
Table 3.2 Financial ratios derived from literature review of failure prediction models. ... 77
Table 3.3 The predictive value of 𝐼𝑉 according to Siddipi (2012) interpretation. ... 78
Table 3.4 Pearson correlation coefficients among financial variables selected in stage 2 for all periods considered. Source: Statistical Software Stata ... 79
viii
Table 3.5 List of the six financial variables selected through the three steps procedure.
Authors’ elaboration ... 80
Table 3.6 Financial ratios weights in the utility function developed through M.H.DIS model. ... 81
Table 3.7 Classification results of M.H.DIS model in terms of companies belonging to each class for year-1, year-2, year-3, year-4 (average over 5-fold cross-validation for training and test set). Source: Matlab Software ... 83
Table 3.8 Classification results of M.H.DIS model in terms of Average and Overall accuracy rate for year-1, year-2, year-3, year-4 (average over 5-fold cross-validation for training and test set). Source: Matlab Software ... 83
Table 3.9 Pairs (𝒫) considered in our analysis. Authors’ elaboration. ... 85
Table 3.10 Companies’ classification according to the most preference functions employed in PROMETHEE II. Authors’ elaboration. ... 86
Table 3.11 Performance indicators used to evaluate the efficiency of M.H.DIS model. Authors’ elaboration. ... 89
Table 3.12 Results of M.H.DIS model for year-1 developed for AMADEUS and PROMETHEE classification (average over 5-fold cross-validation for training and test set). ... 89
Table 3.13 Results of M.H.DIS model for year-1, year-2, year-3, year-4, developed for AMADEUS and PROMETHEE-based classification (average over 5-fold cross-validation for training and test set). ... 92
Table A-1 Cases (1) and (2) “From first to Seventh Scenario”: Rank acceptability indices (All the data are expressed in percent) ... 103
Table A-2 Cases (1) and (2) “From first to Seventh Scenario”: Downward cumulative rank acceptability indices (All the data are expressed in percent). ... 107
Table A-3 Rank acceptability indices on Financial macro-criterion ... 108
Table A-4 Rank acceptability indices on Sustainability macro-criterion ... 109
Table A-5 Rank acceptability indices on Technical macro-criterion ... 110
Table A-6 Rank acceptability indices on Market macro-criterion ... 110
Table B-1 Energy companies in the final balanced sample after the stratified resampling method distributed per country. Authors’ elaboration ... 112
Table B-2 Stages performed to select independent variables of the sample introduced in the failure prediction model. Authors’ elaboration. ... 113
ix
List of figures
Figure 1.1 Global GDP growth and global energy consumption. Source: World Bank ... 2
Figure 1.2 The energy transition results in GDP growth higher than the planned scenario between 2018-2050. Source: IRENA ... 3
Figure 1.3 The energy sector jobs growth under the planned and transforming energy scenarios in 2017-2030-2050. Source: IRENA ... 4
Figure 1.4 Global welfare indicator under the Transforming Energy Scenario in 2030-2050. Source: IRENA ... 4
Figure 1.5 Global renewable electricity consumption by technology, 1990-2017. Source: EIA and UNS ... 6
Figure 1.6 Share of renewables in electricity consumption by region, 2017. Source: EIA and UNSD. ... 6
Figure 1.7 Simplified picture of a typical electric power system. Source: US-Canada Power System Outage Task Force (2004) ... 7
Figure 1.8 Main stages of Decision aid activity. Source: Belton and Stewart (2002) ... 14
Figure 1.9 General scheme of model development in the M.H.DIS model. Authors’ elaboration ... 38
Figure 1.10 Types of preference functions 𝑃𝑑𝑖. Authors’ elaboration ... 40
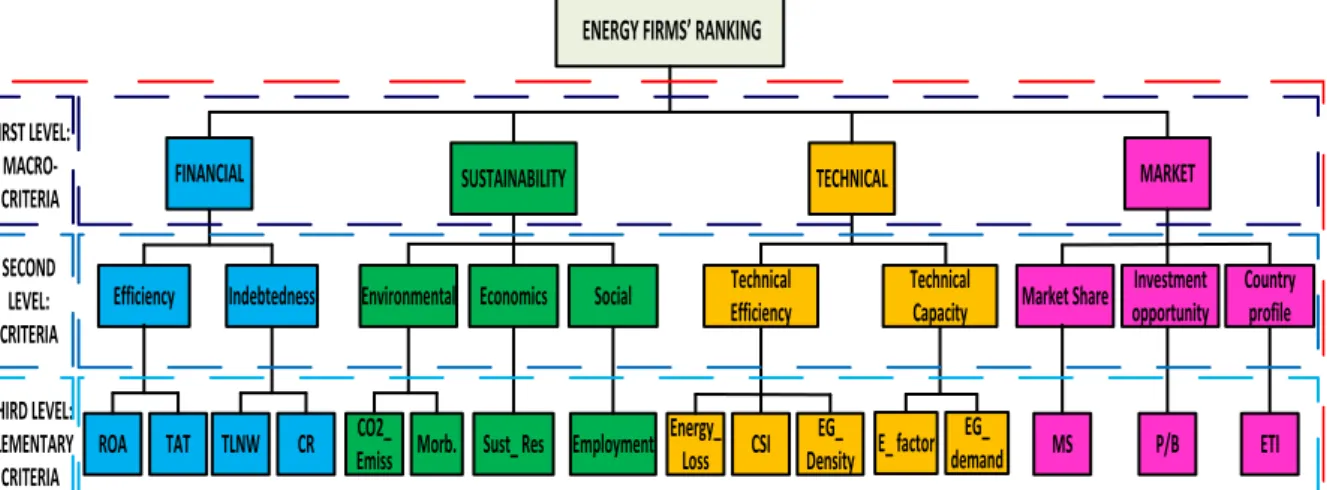
Figure 2.1 Hierarchical structure of criteria ... 54
Figure 2.2 Boxplot of the alternatives’ score in case (1). ... 61
Figure 2.3 Case (1) “First Scenario”: Rank acceptability indices probability distributions. Authors ‘elaboration. ... 63
Figure 2.4 Case (1) Downward cumulative rank acceptability indices as line chart. ... 64
Figure 2.5 Cases (1) and (2) “From first to Seventh Scenario”: Rank acceptability indices. Authors’ elaboration ... 65
1
Chapter 1
The energy sector and the role of MCDA models
Energy is the lifeblood of the worldwide economy that provide input for all good and services of the modern society. Since early 1900s, in particular electrical energy, has improved life-standards of population and driven the social and economic growth of a country by providing the key sources for most of economic activities. Its support to the country’s economic growth is twofold: firstly, it directly contributes to the creation of new job positions and to generating value through the mining, generation, transformation and distribution activities; secondly it sustains significantly the rest of the economy by providing essential Stern products and facilities to all sectors.
In this regard, the ecological economist David Stern, in his paper entitled “The role of Energy in Economic Growth”, emphasized the relevance of energy sector in enhancing the economic progress of a society due to its special features of non-substitutability and storability for a long time (Stern, 2010).
In order to recognize the value of energy sector in the modern economy and therefore to understand the motivations that led us to consider multicriteria models for this study, this Chapter outlines first the link between energy consumption and economic growth up until now and for next years, in the light of the recent renewable energy sources programmes. Then the structure of the Electric Power System is presented along with the key liberalization directives, to comprehend the reasons behind the transition from the monopoly regime to the competition and the effects of energy market deregulation on energy companies. After that, the role of multicriteria methods in the performance and creditworthiness assessment of energy companies is discussed, by introducing the basic notions of multi-criteria models, the most common elements of their main applications in the energy sector and the literature review of the most employed MCDA methods in firms’ performance evaluation and credit risk assessment. Finally, the key concepts of the three MCDA models employed respectively in Chapter 2 and Chapter 3 are described.
1.1 The impact of energy sector on global economy
In the wake of the energy crises in 1970’s, where high-level of energy prices reduced dramatically the economic development of countries, a large number of studies have been conducted to examine the relationship between energy consumption and economic growth. Most of them argue that the increase of energy for transport, residential and industrial uses, directly causes Gross Domestic Product (GDP) to rise; some others provide empirical evidences of the high and positive correlation between energy consumptions and economic growth in different countries (see for a literature review on this topic: Ozturk, 2010; Payne, 2010; Tiba and Omri, 2017 and Waheed et al., 2019). Although the direction of causality is still debated, usually the impact of energy consumption on economic growth has been widely
2
measured with different macroeconomic indicators such as the gross domestic product (GDP), employment and welfare (Liko, 2019).
In order to highlight how energy consumption affects the economic development of a country, we focus on these variables to detect their worth in the current economy.
GDP is the most used indicator for income and growth that reflects the value of total output produced by an economy during a year and adjusted for inflation.
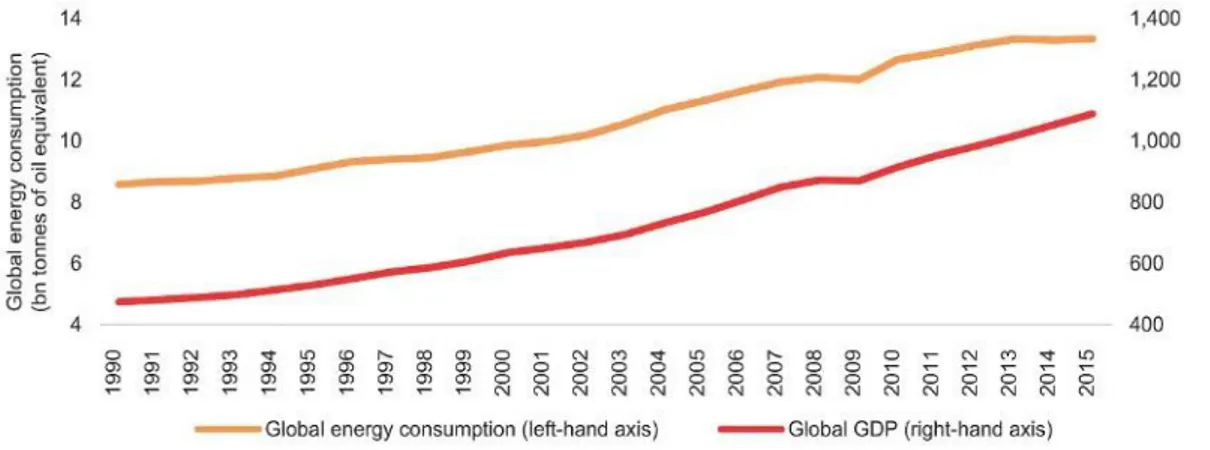
Figure 1.1 below shows the pattern of energy consumption and GDP from data provided by the World Bank between the 1990 and 2015 (Jakeman, 2019).
Figure 1.1 Global GDP growth and global energy consumption. Source: World Bank
As observed from this graph, energy consumption and gross domestic product have increased with a similar trend during years, highlighting a very high positive correlation. Energy consumption is required for many aspects of GDP growth such as electricity, transportation, heating and cooling and this chart is perfectly in line with what we would expect: the wider the energy use, the higher the GDP growth. Moreover, over the past 15 years, the global economic growth has increased faster (+2.8%) than the global energy consumption (1.6%) as result of energy efficiency improvement.
However, energy consumption and economic growth does not provide only benefits. For instance, the environmental effects generated by energy consumption, like the air and water pollutant emissions and the land issues related to coal mining and other power production, have to be considered for a deeper analysis. Debates about how to reduce these negative externalities are faced by current policies that promote the use of non-polluting energy sources to enhance the economic well-being of population and environment. Thus, the expansion of renewable energies and the improvement in energy efficiency will be the Action Priorities of leaders in coming years, as better explained in Section 1.1.1 (World Energy Issues Monitor, 2020).
The report issued by the International Renewable Energy Agency (IRENA) offers a good example of these new environemntal concerns, by providing a comparison between the
3
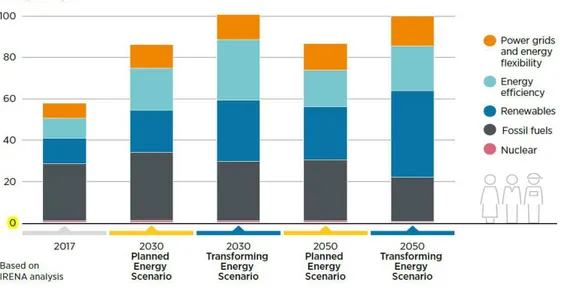
Planned1 and the Transforming energy scenario2 in terms of GDP growth, employment and welfare (IRENA, 2018). Figure 1.2 shows the positive effects of the IRENA’s Renewable Energy Roadmaps (Remap) towards the global GDP of 2018-2050 in both scenarios.
Figure 1.2 The energy transition results in GDP growth higher than the planned scenario between 2018-2050. Source: IRENA
The GDP growth under the Transforming scenario has a consistent positive effects compared to the Planned one. However, the highest value of GDP growth (1.5%) is expected to be reached in 2031 and decrease slowly in 2050 (1%) for both scenarios. Moreover, the GDP growth is driven by the change in four major elements: investments, trade, tax and other inderect and induced effects. Among these, investments in renewables, energy efficiency, infrastructures and technologies’ flexibility (indicated in green), play a key role in stimulating GDP growth, especially in the first half of the energy transition, followed by changes in consumer expenditures due to tax rate changes (in grey). After the 2027, IRENA expects that the indirect and induced effects (in yellow) caused by the changes in consumer spending, contributes more to GDP growth than the change in energy and non-energy trade (in red) such as import or export.
With respect to the second economic growth indicator, the employment indicator, often considered for its ability to enhance the economic productivity, the individual benefits and the social stability, Figure 1.3 shows the estimates of jobs within the energy sector by 2030 and 2050 under the aforementioned scenarios (IRENA, 2020).
1 Planned Energy Scenario (PES): is a projection of the energy system developments based on governments’
current energy plans and other planned targets as of 2019.
2 Transforming Energy Scenario (TES): is the most recent scenario planned to keep the rise of temperature
4
Figure 1.3 The energy sector jobs growth under the planned and transforming energy scenarios in 2017-2030-2050. Source: IRENA
In both 2030 and 2050, the transforming energy scenario is expected to be higher than the planned (+15%) and the current one (+72%). The job composition of next years is expected to be different from that of 2017, due to a wider deployment of renewable energy technologies, the transition progress towards energy efficiency and the system flexibility. Jobs and GDP growth capture only the socio-economic condition of a country, without reflecting about the quality of life improvement arising from the energy transition. Thus, a composite indicator has been built by IRENA, to assess the multifaceted nature of welfare developments. It consists of three dimensions, economic, social and environmental, each one derived by two sub-indicators as shown in Figure 1.4. Again, the welfare is higher under the transforming energy scenario than the planned one where the environmental and social dimension prevail by limiting the pollutants.
5
1.1.1 The renewable energy and the sustainable development
In recent years, the global energy system has faced a dual challenge: on the one hand, the need for more energy; on the other hand the less carbon emissions. Renewables, being clean and non-exhaustible energy sources, represent an interesting alternative to deal with these issues.
Renewable energy is defined as the energy produced by non-fossil sources like hydropower, wind, solar photovoltaic, solar thermal, geothermal, tide, renewable municipal waste, solid and liquid biofuels and biogases (Union, 2018).
Their importance is growing over the years, due to the heightened attention of European policies thereafter the Kyoto Protocol of December 1997 for lowering the greenhouse gas emissions (GHGs) and increasing the energy supply security.
The original renewable energy directive in Europe is dated to 2009 (2009/28/EC) and marked the start of a policy centred on the production and promotion from renewable energy sources (Union, 2009). This directive was revised to Renewable Energy Directive (2018/2001/EU) that aim to achieve two goals: to make Europe the global leader of renewables and to lower its pollutant emissions. In order to achieve these aims, the Directive fosters to cut GHGs of at least 40% compared to 1990, boosts countries to use at least 32% of RES in total final energy consumption and encourages to improve at least 32.5% in energy efficiency (Union, 2018).
Recently, new measures have been proposed by the European Community to achieve important targets by 2030. For instance, the 2030 Agenda for sustainable development includes the goal “to ensure access to affordable, reliable, sustainable and modern energy for all”, enhancing the international cooperation and expanding infrastructures to simplify access to clean energy and sustainable energy supply services (Desa, 2016).
Despite the great efforts implemented by latest political strategies, the recent Tracking SDG7: Energy Progress Report of 2020, highlights that the world is far to meet targets by 2030 under the current policies (IEA et al., 2020). Indeed, in 2018 almost 790 millions of people around the world had no access to electricity, especially in Sub-Saharan Africa. However, the number is falling compared to 1.2 billion in 2010 and data on renewable electricity consumptions reveal that mainly the developed countries are moving towards the right direction, showing an increasing of almost 6% in 2017.
Moreover, Figure 1.5 and Figure 1.6 show respectively the Global renewable electricity consumption by technology from 1990 to 2017 and the share of renewable in electricity consumption by region. Figure 1.5 displays that the share of renewables in global electricity consumption has reached the 24.7% in the last year and the hydropower generation remains the largest source of renewable electricity although it has declined in favour of wind (+35%), modern bioenergy and solar PV energy (+18%). Figure 1.6 highlights that Latin America and The Caribbean present the highest share of renewables in electricity consumptions for hydropower and bioenergy resources; while in Europe, Northern America and Oceania, hydropower remains the largest sources of renewable generation, followed by wind and solar PV.
6
Figure 1.5 Global renewable electricity consumption by technology, 1990-2017. Source: EIA and UNS
Figure 1.6 Share of renewables in electricity consumption by region, 2017. Source: EIA and UNSD.
Thus, as the share of RES deployed in energy mix production and global consumptions increases, the policies that drive organisations evolve by generating benefits in terms of new jobs and economic well-being. The relationship between energy and economic development, previously identified, is therefore realised.
7
1.2 The structure of the Electric Power System and the
role of government.
Since the Second World War, the electricity supply model was based on a fully integrated statutory monopoly. European countries nationalized energy industry for several reasons: to reorganize production facilities eliminating territorial inequalities, to expand companies’ size and their marketplace competitiveness with public funds, to provide a greater coordination between power production and transmission system and to protect particular categories of end-users.
To pursue these aims, since 1996, the most effective government tool was the introduction of competition in those electric power segments where the natural monopoly was not necessary. In order to understand deeply this aspect, we provide a brief description of the electric power system structure.
The Electric power system is identified with the physical structure that makes electric service available to consumers. Because of non-storability of electricity, the network system is highly complex and energy companies have to be able to respond to an ever floating demand for tackling any peaks on it. The over-production capacity is therefore the only way to ensure the continuity of the service, even in front of structural inefficiencies.
Figure 1.7 represents the structure of the Electric Power System in four different segments: the power generation, the transmission, the distribution and the selling system (US-Canada Power System Outage Task Force, 2004).
Figure 1.7 Simplified picture of a typical electric power system. Source: US-Canada Power System Outage Task Force (2004)
Power generation: consists in the production of electrical energy through the direct or indirect primary energy sources transformation. In addition, according to whether a power plant uses renewable (like solar, wind, water, hydro, geothermal and biomass) or not-renewable energy sources (like coal, oil, nuclear, diesel and natural gas), it is distinguished in traditional (thermoelectric, hydroelectric, geothermal, nuclear) or innovative power plant (cogeneration, combined cycle, exploiting renewable energy sources);
8
Transmission system: is responsible for delivering generated electricity over long distances, usually from a generating site located outside of densely populated areas to the distribution grid situated closer to the population. The main characteristic of this system is the transmission of electrical energy with overhead lines at very high voltage (100kV-800kV), covering long distance with minimum power losses (Stenhouse et al., 2020a);
Distribution system: it distributes power from high-voltage transmission system to end-use consumers through lower voltages lines (26kV-69kV) like Underground and
Sub transmission lines (Stenhouse et al, 2020b);
Selling system: it consists in providing the electrical service to end-users. It involves therefore the definition of a different tariff option for type of customers, the seller’s liability for the electrical power availability of end-users within the timeframe and under the conditions laid down in the agreement, the parameters measurement, the billing and the related commercial activities.
In the electric power system, energy producers (i.e. power generation) compose the supply, individual and industrial consumers constitute the demand and the transmission and distribution system, with their unique and not replicable structure, create the link between the demand and the supply. Thus, two questions arise: what is the best organizational regime
for the electric supply chain in view of this specific structure? What is the role of the government in this sector?
In the energy industry, since the main aim is to minimize the cost of production and to increase the efficiency of companies without generating their power market abuse, the ideal solution is introducing competition and/or natural monopoly in those segments where it is necessary. Thus, power generation and selling segment are suitable to be organized competitively because of their economies of scales linked respectively to power plant production and wholesale market price variability; whereas, transmission and distribution division represent a natural monopoly system because they need fixed lines and high upfront building costs.
In view of this organization, in the early nineties, the electricity supply model was converted from a fully integrated statutory monopoly to a more competitive system. This has been made possible through the liberalization policies.
1.2.1 The Liberalization of electricity supply in Europe
The recent European Energy Directives were aimed to achieve the following two headlines targets by considering the peculiarities of this sector: the creation of a single internal energy market and the development, as far as possible, of a more competitive environment. These two targets were considered the basics for carrying out other central goals, such as the greater production efficiency, the general reduction of prices and the increasing security of supply. However, to reach these aims, governments had to tackle with several difficulties due to the specificity of the electricity sector and its political, technical and economic setting. Firstly, electricity, being a commodity involved into the technological progress of a country, is an
9
essential and special good compared to the others. Secondly, from the political point of view, national monopolies, often owned by government, managed different segments of the electricity supply chain due to the vertical integration of the electricity system. Thirdly, taking into account the technical aspect, the electricity system is a tricky process to be introduced in a unique European market, because of its non-storability and the compliance to specific physical law. Compared to any other technological commodities, it takes part of a larger system where different phases are coordinated each other and if one of them delays or advances at one stage, the whole system will be affected. Fourthly, from the economic perspective, two conditions occur from the sudden market opening: consumers begin to pay less and producers start to enter in new markets and to deal with new competitors (Léautier and Crampes, 2016).
In such articulated system, it is fundamental to introduce common European policies supporting stakeholders who are in trouble.
1.2.1.1 The key European directives: the directive 96/92/EC and the more recent ones.
The Directives 90/377/EEC and 90/547 EEC issued in 1990, introduced the first common elements in the European energy sector. These directives were aimed to communicate all relevant information to industrial end-users and consumers in terms of prices and sale conditions, and to create an alignment of different national regimes by regulating the conditions of network access to cross-border exchanges. However, these generic rules gave national legislatures sufficient latitude based on subsidiarity.
The first significant Community Directive for the electricity market was the Directive
96/92/EC, undersigned by the European Parliament on 19 December 1996, which covered
common electricity market principles and where all segments of the electricity industry chain were regularised properly. For instance, in the Power generation was allowed the construction of new power plants through authorisations or tendering procedures that brought down entry barriers and laid the foundation of a regulated competitive regime. In the Transmission system, each Member State designated the management (but not the ownership) of the national transmission network to only one subject responsible of dispatching and independent from other activities unrelated to the transmission system. In the Distribution system, the European legislator adopted a partition of national territories in local monopolies by providing a regulated charging system for customers served by distributors. Finally, in the Selling system, consumers were free to choose their provider according to their annual power consumption and therefore market was opened progressively to all consumers groups.
More recently, the Directives 2003/54/EC and 2009/72/EC have introduced few changes in comparison to the previous ones such as, the independence and the market power of transmission and distribution providers, the consumers’ protection and the greater opening up of the market, the stronger connection among national markets, the security of supply and the facilitation of competition.
10
1.2.1.2 Consequences of deregulation in the energy market
The aim to create a unique European market with lower wholesale electricity prices and a broader competition between producers and providers has been reached with liberalisation (Kočenda and Čábelka, 1998; Meyer, 2003). It was a great success for Europe, since any consumer could buy from any producer within the continent and any producers could have a direct access to a global market composed by millions of customers.
However, different examples offer arguments against liberalisation and in favour of a market redesign. Among the most significant:
- the financial difficulties faced by electricity suppliers;
- the government intervention for ensuring security of supply and energy transition.
With regard to electricity suppliers, some energy companies faced significant financial distress after deregulation processes, which had threatened their very survival. The specific situations depended on the companies’ characteristics but the reasons of problems were analogous: the management structure of the electricity incumbents was not aligned to the creation of a unique and more competitive electricity market. Incumbents had undervalued the increasing impact of renewable energy sources (RES) in the power production, for the future development of electricity market. To strengthen their market share, they believed more on the economic and technological upgrading than the power of renewable energy and failed to grasp the police maker’s desire to fund such renewal production with limited emphasis to the economic efficiency. Moreover, with the recent opening of the market, electricity suppliers could not charge customers for their mistakes, as companies also had before the reform by making prices transferrable to the end-users through the electric surplus obtained by the overcapacity of power generation with respect to the demand (Léautier and Crampes, 2016).
The only entities able to solve the financial difficulties of energy companies could be national governments. In most of cases, their attitude was positive. Indeed, governments, being shareholders of national energy suppliers, felt responsible for the financial distress of energy companies and worried about the potential impact of this crisis on the job losses and therefore on economic growth.
Thus, leaders preferred to monitor the energy industry for guaranteeing security of supply and energy transition at global level. The security of supply was ensured by maintaining the capacity adequacy with a power production able to cover the peak demand and satisfying the exceptional events. Moreover, the government intervention was justified for pursuing a global transition toward a cleaner energy with specific actions. The most important were: the reduction of negative externalities like the greenhouse gas emissions, the introduction of subsidies like the green and white certificates, the creation of new renewable technologies and the centralized planning where the production mix was decided preventively.
1.2.1.3 Examples of energy companies’ failures
11
consequence of deregulation processes. In this section, we provide a brief description of the most noteworthy examples of energy crisis occurred all over the world to highlight the economic effects of such events.
One of the best-known case is the California energy crisis, which involved the distribution companies from 2000 to 2001. California was the first state to launch the competition in the energy sector (1998) and it was considered, by other American countries, as the prototype of liberalization. This energy market was one of the biggest in the United States accounting for 246 billion kWh of annual electricity consumption and the largest power grid in the world (Taylor and Van Doren, 2001; Stuebi, 2001). However, it encountered a regulatory crisis in May 2000 (Safai, 2011). According to the book of McNamara (2002), the following eight factors contributed to the energy crisis: the failure of the wholesale electricity market, the asynchrony between power supply and demand, the reduction of cross-border power imports, the unhelpful in-state generation, the rapid increase of the wholesale electricity prices, the obstacles in the transmission grid, the weather conditions and the accusation of system deceptions. Among these, the sudden rise of the wholesale prices (+ 800%) while keeping the retail prices low, was the main cause to financial indebtedness of Californian distribution companies (Razeghi et al., 2017). In this situation, the state was determinant to avoid their complete financial crash by purchasing power and issuing bonds. However, the prices of electricity rose again and some distribution companies such as Pacific Gas and Electric Co. went to bankruptcy (Ardiyok, 2008).
In 2001, the Brazilian energy system suffered the same fate as California. Here the main causes were the delay in investments and the climate conditions. Indeed, with liberalization processes, the Brazilian government did not invest in power generation and transmission systems because of the high expectations of private intervention and the fulfillment to a policy of economic stabilization. These events failed to be realized and led the risk of power outage to increase between 1998 and 2001 (Jardini et al., 2002).
In UK, the financial collapse of British Energy plc is dated 2000, when the fall in the wholesale electricity prices generated significant effects over other US electricity companies such as Edison International and AES and TXU Europe. The British Energy, being a nuclear company, had to bear large fixed costs related to fluctuations in energy prices, which compromised its operating and financial leverage and made it riskier than any other fossil fuels companies (Taylor, 2010).
A more recent example concerns the distress of Electricaribe in the north of Colombia during the period from 2015 to 2016. It faced a severe crisis due to the non-payment of electricity by a consistent share of private and public customers (over 25%) (Osorio et al., 2017). In the same years, the incident of El Nino, led the electricity price to rise considerably, creating liquidity problems for the company. Thus, the company became unable to get the credit it needed and to deliver the energy to its end-users. As consequence, electricity shortages become frequent and the state was forced to absorb the company to guarantee energy supply. Furthermore, the study of Larsen et al. (2018), suggests that other energy companies such as the Dong, EDF, Vattenfall, E.ON Endesa, Enel, Centrica, SSE, faced similar crisis like the ones just described.
12
As observed by these examples, in electricity sector critical companies are not allowed to go bankrupt since these failures have the potential to generate serious effects on the economy of a country such as, large expenses, power cut and reduced available sources for industrial production, that governments have to prevent. In order to properly give an idea of the impact that the energetic failures can have in terms of costs, we mention the study of Walker et al., (2014) that has estimated the cost of electricity crisis in California during the 2000-2001 to be almost $40 billion, corresponding to a GDP loss ranging from 0.7 to 1.5%.
In order to prevent domino effects on the economy, it is fundamental a constant monitoring of energy companies’ financial performances. Therefore, it would likely to be expected that in the next years stakeholders such as employees, providers and owners (for small companies) or shareholders (for large companies) as well as policy makers should focus on this topic with proper methods.
In next Section, we highlight how multicriteria models are the most suitable tools to deal with the multi-dimensional issues of the energy sector.
1.3 The role of MCDA methods in the performance
evaluation and credit risk assessment of energy
companies
1.3.1 Basic notions of MCDA models
Multiple Criteria Decision Making and Multiple Criteria Decision Analysis are two terms that become popular respectively with the acronyms of MCDM and MCDA due to the paper of Ziont (1979). MCDA is a discipline that falls within the broader framework of Operations Research (OR) dealing with the applications of innovative mathematical methods to help a Decision Maker (DM) in making better decisions. More specifically MCDA is a collection of formal approaches to support Decision Makers (DMs), in structuring and solving complex decisions that involve a set of conflictual and multiple criteria (for some survey on MCDA see Roy, 1990; Belton and Stewart, 2002; Figueira et al., 2005). Because of the multi-dimensional nature of decision-making problems, a unique best solution does not exist and analysts need to incorporate subjective information, better known as decision maker’s preferences, to solve the problem. In this regard, the statement of Belton and Stewart (2002) encloses in few lines the main objective of MCDA:
“the aim of good MCDA is to facilitate decision makers’ learning about the many facets of an issue in order to assist them in identifying a preferred way forward”.
In MCDA framework, some key concepts need to be defined (Belton and Stewart, 2002; Greco et al., 2016):
Alternatives: constitute the options, the solutions or the actions of a decision-making problem. Usually they are denoted with the finite set 𝐴 = {𝑎1, ⋯ , 𝑎𝑗, ⋯ , 𝑎𝑚} where
13
𝑚 represents the total number of alternatives involved in the decision process; Criteria: are the attributes or the point of views under which alternatives are
evaluated and compared each other. A coherent3 family of criteria is represented as 𝐺 = {𝑔1, ⋯ , 𝑔𝑖, ⋯ , 𝑔𝑛} with 𝑛 denoting the number of total criteria considered in the
analysis (Bouyssou, 1990). Generally, the criterion is a real valued function on the set of alternatives 𝐴, i.e. 𝑔𝑖 ∶ 𝐴 ⟶ ℝ that allows to evaluate an alternative 𝑎𝑗 ∈ A on
a criterion 𝑔𝑖 ∈ G with a partial score 𝑔𝑖(𝑎𝑗). According to whether the preference
value is expressed in a linguistic or quantitative extent, criteria can assume an ordinal or a quantitative scale.
Moreover, each criterion can have an increasing, decreasing or non-monotonic preference direction. If the preference direction is increasing, then the higher the evaluation of an alternative 𝑎𝑗 with respect to 𝑔𝑖 , the more preferred is the alternative 𝑎𝑗 with respect to 𝑔𝑖 . If the preference direction is decreasing, then the higher the evaluation of an alternative 𝑎𝑗 with respect to 𝑔𝑖 , the less preferred is the alternative 𝑎𝑗 with respect to 𝑔𝑖 . If the preference direction is non-monotonic, it is neither
increasing nor decreasing.
Weights: represent the individual formulation of trade-off existing among the different evaluations of criteria and they are usually denoted with 𝑊 = {𝑤1, 𝑤2, ⋯ , 𝑤𝑛}. Through them, DM can express the relative importance of one criterion with respect to another according to its own preferences. The definition of weight differs according to what MCDA model is being applied. For instance, in value function based model the proper meaning of weight is close to that of trade-off; whereas in outranking techniques, the correct interpretation is of “voting power” allocated to each criterion (see Section 1.3.1.1 for a more detailed description on MCDA models and aggregation functions).
With these few elements, it is possible to build the performance matrix that summarizes in a unique table the key features of the problem and represents the starting point to develop the decision process. The following performance matrix 𝑀 is formed for 𝐴 x 𝐺, where 𝑔𝑖(𝑎𝑗) = 𝑎𝑗𝑖 is the evaluation in row 𝑗 and column 𝑖:
3 According to Roy (1996), a family of criteria is coherent if it is based on three notions: exhaustiveness (all
the relevant attributes of a decision problem have to be considered), cohesiveness (if two alternatives 𝑎1 and 𝑎2 have the same evaluation of the whole set of criteria except one, and 𝑎1 has a better evaluation on
the remaining criterion than 𝑎2, then 𝑎1 is at least as good as 𝑎2), non-redundancy (the withdrawal of one
14 𝑀 = [ 𝑔1 𝑔2 … 𝑔𝑖 … 𝑔𝑛 𝑎1 𝑎11 𝑎12 … 𝑎1𝑖 … 𝑎1𝑛 𝑎2 𝑎21 𝑎22 … 𝑎2𝑖 … 𝑎2𝑛 … … … … 𝑎𝑗 𝑎𝑗1 𝑎𝑗2 … 𝑎𝑗𝑖 … 𝑎𝑗𝑛 … … … … 𝑎𝑚 𝑎𝑚1 𝑎𝑚2 … 𝑎𝑚𝑖 … 𝑎𝑚𝑛] Furthermore:
Decision maker (DM): is the individual or the group of people that would like to solve a decision problem. Generally, three types of problems are identified:
- Choice problem consists of the selection of a subset of alternatives from a given initial set of options;
- Ranking problem requires to rank alternatives in a partial or total order;
- Sorting problems assign each alternative to one or more contiguous preferentially ordered classes;
Analyst: is the expert that thanks to its mathematical expertise guides DMs in all stages of the decision making process (Figure 1.8) for solving the problem;
Uncertainty: in order to solve a decision problem, some elements of uncertainty involving the measurement or the quantification of criteria, the trade-off or the preferences, could arise. Often occurs for instance that criteria are evaluated on a qualitative scale or DM is unable to quantify its preferences on a criterion. However, the analyst needs to incorporate these elements into the model and in order to overcome with the uncertainty issue, different methods have been proposed, such as the interaction between aggregation and disaggregation approach (Jacquet-Lagreze and Siskos, 2001).
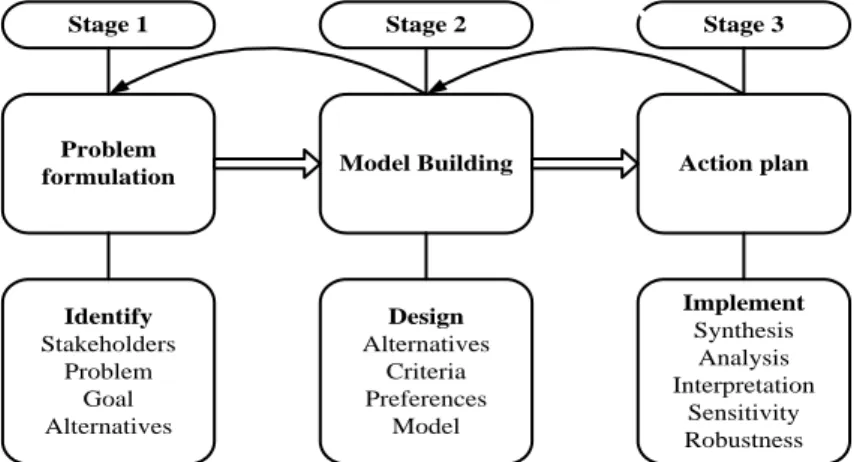
Figure 1.8 below shows the decision aid activity organized in three main stages. It combines objectives measurements and the subjectivity of DMs (see Belton and Stewart, 2002 and Cinelli et al., 2020 for a comprehensive taxonomy of the MCDA process characteristics):
Problem
formulation Model Building Action plan
Identify Stakeholders Problem Goal Alternatives Design Alternatives Criteria Preferences Model Implement Synthesis Analysis Interpretation Sensitivity Robustness
Stage 1 Stage 2 Stage 3
15
In stage 1 DMs are advised by the analyst to provide essential information for the decision model development. In this phase, stakeholders have to discuss with analyst about the problem to solve and the goals to achieve. Thus, the identification of a potential set of alternatives, jointly to constraints and values are the key elements in order to apply any multicriteria model.
Stage 2 consists of the development of a preference model. Although it does not exist a specific classification for MCDA methods (Sen and Yang, 2012), three types of models can be identified with different aggregation procedures: value measurement, goal programming or reference level and outranking methods (Section 1.3.1.1). Despite the choice of analyst to use one model rather than another one, in this phase it is fundamental to specify alternatives, to define criteria and to elicit values. Among these, the selection, the organization and the development of appropriate criteria is crucial, and varies according to the problem under investigation. It faces with the issues of data quality, preferential dependency, imprecision and uncertainty determination. Since MCDA models manage with several criteria simultaneously, aggregation procedures have to be provided to the analyst in order to build a model able to support DMs in taking the final decision. To deal with this aim, analyst asks DMs to estimate the model parameters such as criteria weights, indifference thresholds, trade-off and so forth. Moreover, since the direct estimation of parameters is a very complex task for DMs, it can cause the interruption of the whole process. Thus, Stage 2 is crucial for the entire development of a MCDA model.
Once the MCDA model has been applied to the problem under investigation, Stage 3 consists of action plan, i.e. to interpret outcomes, synthetize information and provide a final recommendation to DMs. Since it may happen that the MCDA solution is unexpected and has to be interpreted in relation to the context of the problem, it is required therefore that the results of MCDA model have to be examined and tested for their validity and implications. Thus, this stage implies further analysis of sensitivity and robustness.
1.3.1.1 Main categories of MCDA models and aggregation functions
The following subsection presents the basic notions on the most important MCDA models classified according to Belton and Stewart (2002) in three main categories: value measurement, goal programming or reference level and outranking methods.
However, before providing a thorough description of the most traditional models, it is useful to introduce the mathematical notation employed for comparing alternatives to each other according to the evaluation criterion chosen.
More specifically, for alternatives 𝑎1, 𝑎2 ∈ 𝐴 it is assumed that: - 𝑎1𝑃𝑎2 ⟺ 𝑔𝑖(𝑎1) > 𝑔𝑖(𝑎2) and
- 𝑎1𝐼𝑎2 ⟺ 𝑔𝑖(𝑎1) = 𝑔𝑖(𝑎2)
where 𝑃 and I indicate the binary relations between the two alternatives, respectively with the meaning of “𝑎1 is strictly preferred to 𝑎2” (𝑎1𝑃𝑎2) and “𝑎1 is indifferent to 𝑎2” (𝑎1𝐼𝑎2) with regard to the criterion 𝑔𝑖.
16
In some models, any kind of difference between the two evaluations, even if minimal, indicates a strict preference of one alternative over the other; in other models, it is more reasonable to assume that small differences 𝑔𝑖(𝑎1) − 𝑔𝑖(𝑎2) among alternative evaluations are consistent with an indifference condition, leading to another model of comparison (Bouyssou, 1990):
- 𝑎1𝑃𝑎2 ⟺ 𝑔𝑖(𝑎1) − 𝑔𝑖(𝑎2) > q and
- 𝑎1𝐼𝑎2 ⟺ |𝑔𝑖(𝑎1) − 𝑔𝑖(𝑎2)| ≤ q
where q is the indifference threshold. Thus, a difference 𝑔𝑖(𝑎1) − 𝑔𝑖(𝑎2) wider than q gives a strict preference of an alternative over the other, also if the difference is close to q; otherwise it leads to an indifference condition. Moreover, because of the sudden variation from a strict preference to an indifferent condition, it may be useful to introduce a “baffer zone” where the hesitation between the two aforementioned conditions is introduced. This hesitation is called weak preference and it is denoted with the binary relation 𝑆, where 𝑝 and 𝑞 indicate respectively the preference and the indifference threshold:
- 𝑎1𝑃𝑎2 ⟺ 𝑔𝑖(𝑎1) − 𝑔𝑖(𝑎2) > q
- 𝑎1𝑆𝑎2 ⟺ 𝑞 < 𝑔𝑖(𝑎1) − 𝑔𝑖(𝑎2) ≤ 𝑝
- 𝑎1𝐼𝑎2 ⟺ |𝑔𝑖(𝑎1) − 𝑔𝑖(𝑎2)| ≤ q
In what follows, the basic concepts of the main categories of MCDA models:
Value measurement methods: have been introduced by Keeney and Raiffa (1976)
with the aim to assign a score or a value (𝑉) for each option. Initially the model evaluates a partial score for each criterion that is then aggregated into a global score by considering the whole set of criteria and their associated weights. Through the global score it is possible to delineate a preference order of alternatives such that 𝑎1 is preferred to 𝑎2 if and only if the value of 𝑎1 is greater than the value of 𝑎2 on the whole set of criteria 𝐺 (i.e. 𝑎1𝑃𝑎2 ⟺ 𝑉(𝑎1) > 𝑉(𝑎2)). Thus, preferences are
characterized by two main properties: completeness and transitivity. Preferences are complete when, given two alternatives, one is necessarily more or equally preferred to the other; while they are transitive when, given three options 𝑎1, 𝑎2, 𝑎3 ∈ 𝐴 such that 𝑎1 is preferred to 𝑎2 and the latter is preferred to 𝑎3, then 𝑎1 is preferred to 𝑎3
(i.e. if 𝑎1𝑃𝑎2 ∧ 𝑎2𝑃𝑎3 ⇒ 𝑎1𝑃𝑎3). Moreover, to take into account the importance of criteria, a partial value function 𝑣𝑖(𝑎𝑗) is created for each 𝑔𝑖 𝜖 𝐺.
The simplest additive model is the weighted sum that expresses the value function in an additive form. More specifically the global value of an alternative 𝑉(𝑎𝑗) is obtained through the product between the partial value function 𝑣𝑖(𝑎𝑗) on the criterion 𝑔𝑖 and the weight value 𝑤𝑖 assigned by the DM to that criterion, as in the following equation:
𝑉(𝑎𝑗)=∑𝑤𝑖𝑣𝑖(𝑎𝑗) 𝑛
17
Goal programming or Reference level models: are based on reference levels of achievements for each criterion, considered as goals. The main aim of these models is to discover those alternatives that are closest to the reference levels. The model is articulated in different stages. At the beginning, DM has to prioritize criteria according to an order; the most important one is assessed on the set of alternatives until a desirable level of performance is achieved and alternatives with the less performances on the reference level are eliminated. Similarly, DM evaluates the performances on the second best criterion and alternatives with the less reference level are removed. The process continues until the worst criterion of the whole set is considered.
Outranking methods: have been introduced by Roy (1996) and are based on an binary relation on the set of alternatives. Initially options are pairwise compared by considering one criterion at a time in order to detect the preference degree of one alternative over the other. Then the model is extended to the entire set of criterion by providing strong enough evidence to affirm that “𝑎1 is at least as good as 𝑎2” (𝑎1𝑆𝑎2). To use this model it is required that criteria are based on the dominance
notion and satisfy the preferential independence property. Dominance implies that, given two alternatives 𝑎1 and 𝑎2 and their corresponding preference functions
𝑉(𝑎1) and 𝑉(𝑎2), if 𝑉(𝑎1) > 𝑉(𝑎2) then 𝑎1 is preferred to 𝑎2 (𝑎1𝑃𝑎2); whereas the preferential independence property entails that the set of criteria must not show any degree of interaction. However, if any alternative outranks another one, it does not imply that they present the same preference value or they are indifferent (Belton and Stewart, 2002).
1.3.2 Multi-criteria Decision Analysis in the energy sector
Multi-criteria decision analysis and its wide range of methodologies have been applied to many domains. In this study, we focus on MCDA models employed in energy decision making in view of the significance that this sector plays in the economic, political and environmental context, as stressed before.
MCDA methods, thanks to their capability to handle simultaneously with multiple and conflictual criteria, different categories of stakeholders and several uncertainty conditions, are well suitable instruments to implement in the energy industry and achieve integrated results (Mateo, 2012).
In what follows, an extensive literature review on the main applications of MCDA models in the energy sector, emphasizes the importance of these mathematical tools to solve decision-making issues related to this area and proves the recent growing attention of researchers for this field. For instance, the studies of Abu-Taha (2011) and Mardani et al. (2015) provide a review of MCDM techniques in the main areas of sustainable and renewable energy for type of multi-criteria model employed, authors’ origin, kind of journal, year of publication and criteria considered. They underline the role of MCDA methods in supporting DMs for disclosing the uncertainties of environment decision-making and solving the different stages of energy system. Similarly, the paper of Wang et al. (2009)
18
reviewed the main MCDA models employed in each stage of sustainable energy decision-making such as criteria identification, weighting, evaluation and aggregation. Pohekar and Ramachandran (2004) offer a wide survey of 90 published papers dealing with the application of MCDA methods in the comprehensive area of sustainable energy planning that consists of seven categories: renewable energy planning, energy resource allocation, transportation and building energy management, energy projects and electric utility planning and other various areas. Instead, more oriented to energy investments question is the recent literature review of Strantzali and Aravossis (2016) that allow understanding the dynamics of evaluation in renewable energy sources investments. The authors, through the classification of energy planning papers in year of publication, method employed, energy source, area of application, criteria and geographical distribution of case studies, highlight the widespread use of MCDA methods to solve energy planning problems.
In analyzing these comprehensive studies, it is possible to bring out some common elements:
- The problems to solve
- The criteria employed
- The methods applied
- The uncertainty of data
The problems to solve: typically, the decision problems related to the energy sector applying
MCDA techniques concern the following subjects:
The choice of the power plants location involving the strategic selection of the most efficient site to locate thermal, solar or wind power plants in terms of economic and sustainable development of a country (Choudhary and Shankar, 2012; Barda et al., 1990; Ren, 2010; Wu et al., 2014; Yunna and Geng, 2014);
The evaluation of the power generation projects consisting of the assessment of renewable energy investments for power generation (Chen et al., 2010; Atmaca and Basar, 2012; Liu et al., 2010; Mavrotas et al., 2003);
The comparison among power generation and supply technologies concerning the sustainability assessment of power production and supply from renewable and not renewable energy sources or from traditional and renewable energy technologies (Barros et al., 2015; Maxim, 2014; Stein, 2013; Troldborg et al., 2014; Doukas et al., 2007; Hirschberg et al. 2004);
The designing of energy plans and policies involving the strategic decision among different energy scenarios faced by energy planners or political stakeholders to comply with more sustainable energy strategies (Angilella et al., 2016; Kablan, 2004; Greening and Bernow, 2004; Diakoulaki et al., 1999);
The system of energy transportation entailing the choice of the most environmentally sustainable transport system to mitigate the environmental risks related to pollutant emissions (Yedla and Shrestha, 2003; Awasthi and Chauhan, 2011; Sayers et al., 2003);
19
aggregated indicators for monitoring the energy performance at national or regional level (Song et al., 2017; Ding et al., 2018; Zhou et al., 2007; Hatefi and Torabi, 2010; Peng et al., 2017).
The criteria employed: in the framework of energy system, the most used attributes for
evaluating or comparing alternatives to each other are usually grouped into four main categories: technical, economic, environmental and social criteria (Wang et al., 2009). Table 1.1 summarizes the most commonly used sub-criteria for each category. They have been derived from the main literature reviews in energy planning studies (Wang et al., 2009; Antunes and Martins, 2014; Ibáñez-Forés et al., 2014; Luthra et al., 2015; Strantzali and Aravossis, 2016). Moreover, a detailed description for each of them is provided below:
Table 1.1 Most used criteria and sub-criteria in energy planning studies employing multi-criteria methods (Wang et al., 2009; Antunes and Martins, 2014; Ibáñez-Forés et al., 2014; Luthra et al., 2015; Strantzali and Aravossis, 2016)
Technical criteria Economic criteria Environmental criteria Social criteria
Efficiency Fuel costs Pollutants emissions
(CO2, NOx, SO2)
Risk of premature mortality
Safety Investment costs Particles emissions Morbidity
Reliability Maturity Capacity
Operation and Maintenance costs Production costs
Levelized electricity cost
Wastewater discharge Waste and sludge generation Land use
Accidents
Social acceptability Job creation Peak load response
Primary energy ratio Fuel availability Risk
Avoided costs Economic impacts
Economic profitability (Payback Period, service life, equivalent Annual costs, net present value)
Noise pollution Visual impact Climate change
Social benefit Social equity
Cultural heritage protection
Adaptability Diversity Lifetime Market maturity Financial capacity Acidification Greenhouse effect Equipment design Waste utilization
Technical criteria: usually refer to the production features of each technology. They include efficiency (the percentage of useful energy, namely electricity or heat, obtained from energy sources), safety (the security of workforces in the place of energy activity or the reduction of energy dependence), reliability (the capability for the power technology to perform, in a certain time span, as planned, ensuring a continuous energy service without failures or blackout), maturity (the technology’s maturity degree with respect to other international technologies, viewed as a sort of technical advantage), capacity (the firm’s ability to get the maximum energy production by using its installations), peak load response (the capability of a device or a system to respond immediately to large demand fluctuations), primary energy
ratio (the ratio between the primary energy consumption and the user’s energy
demand), fuel availability (computes the availability of a specific kind of fuel during years over its actual consumption), risk (the exposition to certain dangers due to new policies or control properties), adaptability (the technology’s ability to conform the energy production to the current situations), diversity (refers to the energy production mix, technology or supply sources), lifetime (the number of years the power plant