Pietrobono et al. Cell Death and Disease (2018) 9:142
DOI 10.1038/s41419-017-0142-0
Cell Death & Disease
A R T I C L E
O p e n A c c e s s
Targeted inhibition of Hedgehog-GLI
signaling by novel acylguanidine
derivatives inhibits melanoma cell growth
by inducing replication stress and mitotic
catastrophe
Silvia Pietrobono
1, Roberta Santini
1, Sinforosa Gagliardi
1, Francesca Dapporto
2, David Colecchia
2, Mario Chiariello
2,
Cosima Leone
3, Massimo Valoti
3, Fabrizio Manetti
4, Elena Petricci
4, Maurizio Taddei
4and Barbara Stecca
1,5Abstract
Aberrant activation of the Hedgehog (HH) signaling is a critical driver in tumorigenesis. The Smoothened (SMO) receptor is one of the major upstream transducers of the HH pathway and a target for the development of anticancer agents. The SMO inhibitor Vismodegib (GDC-0449/Erivedge) has been approved for treatment of basal cell carcinoma. However, the emergence of resistance during Vismodegib treatment and the occurrence of numerous side effects limit its use. Our group has recently discovered and developed novel and potent SMO inhibitors based on acylguanidine or acylthiourea scaffolds. Here, we show that the two acylguanidine analogs, compound (1) and its
novelfluoride derivative (2), strongly reduce growth and self-renewal of melanoma cells, inhibiting the level of the HH
signaling target GLI1 in a dose-dependent manner. Both compounds induce apoptosis and DNA damage through the ATR/CHK1 axis. Mechanistically, they prevent G2 to M cell cycle transition, and induce signs of mitotic aberrations ultimately leading to mitotic catastrophe. In a melanoma xenograft mouse model, systemic treatment with 1 produced a remarkable inhibition of tumor growth without body weight loss in mice. Our data highlight a novel route for cell death induction by SMO inhibitors and support their use in therapeutic approaches for melanoma and, possibly, other types of cancer with active HH signaling.
Introduction
Hedgehog (HH) signaling is a conserved pathway that plays a pivotal role during embryonic development, tissue
homeostasis, and regeneration1,2. In vertebrates, canonical
HH pathway activation is triggered by binding of secreted HH ligands to the 12-pass transmembrane receptor Pat-ched (PTCH1) on nearby cells. The binding abolishes
repression on the G protein-coupled receptor Smooth-ened (SMO), initiating an intracellular signaling cascade that regulates the formation of the zinc-finger transcrip-tion factors GLI2 and GLI3, which induce transcriptranscrip-tion of GLI1. Both GLI1 and GLI2 control the transcription of a number of context-dependent target genes that regulate cellular differentiation, proliferation, survival, and self-renewal.
Aberrant activation of the HH pathway has been reported to drive tumor progression in numerous cancers, including those of the skin, brain, lung, pancreas,
sto-mach, and hematopoietic malignancies3–5. The
© The Author(s) 2018
Open Access This article is licensed under a Creative Commons Attribution 4.0 International License, which permits use, sharing, adaptation, distribution and reproduction in any medium or format, as long as you give appropriate credit to the original author(s) and the source, provide a link to the Creative Commons license, and indicate if
changes were made. The images or other third party material in this article are included in the article’s Creative Commons license, unless indicated otherwise in a credit line to the material. If
material is not included in the article’s Creative Commons license and your intended use is not permitted by statutory regulation or exceeds the permitted use, you will need to obtain
permission directly from the copyright holder. To view a copy of this license, visithttp://creativecommons.org/licenses/by/4.0/.
Correspondence: Barbara Stecca (barbara.stecca@ittumori.it) 1Core Research Laboratory, Istituto Toscano Tumori, Florence, Italy 2
Consiglio Nazionale delle Ricerche, Istituto di Fisiologia Clinica and Core Research Laboratory, Istituto Toscano Tumori, AOU Senese, Siena, Italy Full list of author information is available at the end of the article Silvia Pietrobono and Roberta Santini contributed equally to this work. Edited by M. Malewicz.
Official journal of the Cell Death Differentiation Association
development of small molecules targeting the HH signaling is a promising approach for the treatment of
HH-dependent tumors. Starting from the natural
compound Cyclopamine, an alkaloid isolated from Vera-trum californicum that attenuates HH signaling by
antagonizing SMO6,7, several SMO antagonists have
been identified so far8,9. Among them, Vismodegib
(GDC-0449/Erivedge) and Sonidegib (LDE-225/Odomzo) have been approved by FDA for treatment of locally advanced or metastatic basal cell carcinoma. However, despite an initial clinical response, the use of SMO inhibitors has been associated with the acquisition of tumor drug
resistance as a result of structural mutations in SMO10–12.
In addition, Vismodegib and Sonidegib can trigger a number of side effects, including constipation, diarrhea, hair loss, and fatigue. Several clinical trials with SMO antagonists led to negative results due to low selectivity on cancer stem cells (CSCs), poor pharmacokinetic properties, and the occurrence of mechanisms of
non-canonical HH pathway activation downstream of
SMO13,14. Resistance to SMO inhibitors can be mediated
by amplification of the HH target genes GLI2 and
CyclinD1 (ref. 15) or upregulation of GLI by
non-canonical HH pathway16. Therefore, there is a need for
new SMO antagonists able to effectively inhibit tumor growth and CSC self-renewal, while avoiding drug resis-tance mechanisms.
Our group has recently developed a series of novel SMO inhibitors based on acylguanidine or acylthiourea
scaffolds17. In particular, compound 1 (MRT-92) was
shown to uniquely bind to the entire transmembrane cavity of SMO and to be insensitive to the human
D473H18, a key mutation that renders SMO resistant to
Vismodegib10or Sonidegib16. Compound1 is among the
most potent SMO antagonists known so far, being 10-fold more potent than Vismodegib or Sonidegib in inhibiting
rat cerebellar granule cell proliferation18. However, the
biological effects of these acylguanidine and acylthiourea derivatives in human melanoma cells remain to be
determined. Here we show that 1 inhibits GLI1
expres-sion and reduces melanoma cell growth in vitro and in vivo, by inducing DNA damage and G2/M cell cycle arrest.
Results
Inhibition of endogenous HH signaling by 1 and 2
The inhibitory properties of 1, 2, and 3 on the
tran-scriptional activity of the HH pathway were investigated using the HH-competent murine NIH3T3 cells
tran-siently transfected with a GLI-binding sitefirefly
lucifer-ase reporter and treated with the SMO agonist SAG19.
Compounds1 and 2 reduced the transcriptional activity
of the endogenous HH pathway by 50%, to a level
com-parable to the GLI inhibitor GANT61 (ref. 20) whereas3
did not affect it (Fig.1a). Consistently, western blot
ana-lysis in NIH3T3 cells showed that only1 and 2 reduced
the expression of endogenous Gli1, the best read-out of an
active HH pathway21 (Fig. 1b). Compound 1 showed a
dose-response ability to inhibit the transcriptional activity
of the endogenous HH pathway (Fig. 1c). Synthesis of
compounds 1, 2, and 3 is reported in Supplementary
Figure S1.
GLI1 shuttles between the cytoplasm and the nucleus,
where it induces the expression of target genes22.
Therefore, we tested whether 1 affects the intracellular
trafficking of Gli1. As expected, SAG treatment
induced the expression of Gli1 protein in the
nucleus, and, to a lesser extent, in the cytoplasm.
Treat-ment with1 resulted in a strong Gli1 inhibition in both
the nucleus and the cytoplasm (Fig.1d), suggesting that1
does not affect the intracellular trafficking of Gli1, but it rather inhibits its expression. To further confirm the specificity of action of 1 for the HH signaling, no sub-stantial inhibition of any of the 46 analyzed kinases was
detected upon treatment with 1 (Supplementary
Figure S2).
Altogether these data indicate that1 and 2 show a very
strong inhibitory activity against the HH pathway,
whereas3 shows no ability to suppress it. The guanidine
moiety of 1 and 2 appears to be crucial for the HH
inhibitory activity, because its replacement by a thiourea
lead to inactive compound3 (Table1).
Compounds 1 and 2 inhibit melanoma cell viability
Compound1 has been shown to inhibit proliferation of
rat cerebellar granule cells and of murine Ptch1+/−
medulloblastoma cells at nanomolar concentrations18.
However, it is unknown whether 1 or 2 have
anti-proliferative activity in human cancer cells.
Along with others, we previously showed that inhibition of SMO reduces growth of human melanoma cell lines
in vitro and in vivo23–25. Thus, we tested the ability of 1
and 2 to suppress proliferation of human melanoma
cells compared with the SMO antagonist LDE-225. Treatment of A375, SSM2c, and MeWo melanoma
cells with 1 and 2 showed a dose-dependent reduction
of cell viability in all three cell types, with IC50
concentrations ranging from 299 to 614 nM for 1 and
from 368 to 608 nM for2 (Figs.2a–d). On the other hand,
LDE-225 showed IC50 in theμM range (Figs.2d, e) and
acted mainly through induction of apoptosis
(Supple-mentary Figure S3), as previously reported24. Western
blot analysis showed that both 1 and 2 reduced the
expression of endogenous GLI1 protein in a dose-dependent manner in all three melanoma cell lines
(Fig. 2f). These data indicate that both compounds are
able to restrain melanoma cell growth in vitro by inhi-biting the expression of GLI1.
Compounds 1 and 2 induce DNA damage and apoptosis in melanoma cells
The efficacy of many anticancer drugs relies on their ability to induce damage to cellular DNA and subsequent
apoptosis26. To determine whether 1 or 2 induce
DNA damage, we examined the activities of
ataxia–telangiectasia mutated (ATM) and
ataxia–telangiectasia and Rad3 related protein (ATR), two kinases that are critical for the DNA damage response through the activation of cell cycle checkpoints. Western blot analysis showed that both compounds increased DNA damage in melanoma cells by inducing phosphor-ylation of ATR and consequently activation of the
downstream target pCHK1. Consistently, p53 was phos-phorylated in the N-terminal activation domain at Ser15
(ref. 27) (Fig. 3a). In contrast, phosphorylation of ATM
and, hence, activation of pCHK2 remained undetectable after treatment with either drugs (Supplementary Fig-ure S4). To further characterize the DNA damage response, the expression of poly ADP-ribose polymerase-1 (PARP-polymerase-1), a DNA damage sensor activated by DNA
lesions28, and γH2AX, which can be induced by ATR in
response to single-stranded DNA breaks and during
replication stress29, were determined by western blot.
Treatment of SSM2c, A375, and MeWo cells with both compounds induced cleavage of PARP-1 and a
dose-Fig. 1 Effect of compounds 1, 2, and 3 on the endogenous HH pathway. (a) Quantification of GLI-dependent luciferase reporter assay in HH-responsive NIH3T3 cells treated with 100 nM SAG and GANT61 (5μM), 1, 2, or 3 (1 μM). Cells were treated with SAG for 48 h and with GANT61 or compounds for 24 h. Relative luciferase units were GLI-dependent reporterfirefly/renilla control ratios, with untreated cells equated to 1. (b) Western blot (WB) analysis of endogenous GLI1 protein in NIH3T3 cells treated with 100 nM SAG and GANT61 (5μM), and 1, 2, or 3 (1 μM) for 48 h. HSP90 was used as loading control. Quantification of GLI1 protein, expressed as relative ratio of GLI1/HSP90, is shown in italic. (c) Quantification of GLI-dependent luciferase reporter assay in HH-responsive NIH3T3 cells treated with 100 nM SAG and increasing doses of 1 for 48 h. Relative luciferase units were GLI-dependent reporterfirefly/renilla control ratios, with untreated cells equated to 1. (d) WB analysis of cytoplasmic and nuclear endogenous GLI1 protein in NIH3T3 cells treated with 100 nM SAG and 1 at the indicated doses for 48 h. After treatment, cell fractionation was performed and lysates were subjected to WB with anti-GAPDH (control for cytoplasmic proteins) and anti-Lamin B1 (control for nuclear proteins). Data are shown as mean ± SD of at least three independent experiments.*p < 0.05 compared with DMSO control.
Pietrobono et al. Cell Death and Disease (2018) 9:142 Page 3 of 16
dependent increase of phosphorylated γH2AX (Fig. 3a; Supplementary Figure S5a). Strong accumulation of γH2AX foci was also confirmed by confocal microscopy
(Figs.3b, c). These data suggest that both1 and 2 induce
DNA damage in melanoma cells through the ATR/CHK1 axis.
To determine whether 1 or 2 affected apoptosis, we
performed analysis of Annexin V/7-amino-actinomycin D
(7-AAD) labeling. Compound 1 led to a dose-dependent
increase of both early and late apoptosis in A375 and
SSM2c cells already after 48 h (Figs.3d, e). Conversely,2
was less efficient in inducing apoptosis, increasing only
early apoptosis in SSM2c cells and both early and late
apoptosis at the highest doses (0.5 and 1μM) in A375 cells
(Figs. 3f, g). Similarly, 1 was more effective than 2 in
inducing apoptosis in MeWo cells (Supplementary Figure S5b and c). Induction of apoptosis was confirmed at the molecular level by increased BAX/BCL2 ratio
(Figs. 3h, i; Supplementary Figure S5d), an indicator of
mitochondrial apoptosis.30These data indicate that1 and,
to a lesser extent, 2 induce apoptosis in melanoma
cells.
Compound 1 induces G2/M cell cycle arrest culminating in a process of mitotic catastrophe
As the decrease in melanoma cell viability caused by1
and 2 could be due to a decrease in cell proliferation,
augmented cell death, or both, we examined the mechanism of cell growth inhibition. First, we measured
how1 and 2 impact on cell cycle by carrying out
propi-dium iodide staining of SSM2c, A375, and MeWo cells treated with increasing doses of either compounds.
Treatment with 1 and, to a lesser extent, 2 induced
accumulation of SSM2c, MeWo, and A375 cells in the G2/M phase of the cell cycle with a concomitant decrease in the G0/G1 population compared with the control
(Figs. 4a–d; Supplementary Figure S5e-f). To further
investigate the mechanisms underlying the observed G2/ M arrest, melanoma cells were synchronized in prome-taphase with the microtubule-interfering agent
nocoda-zole, and then released in absence or presence of either1
or 2. Fluorescence-activated cell sorting (FACS) analysis
confirmed that A375 and SSM2c cells were arrested in
mitosis after nocodazole blockade, as shown by the 4N DNA content of cells immediately following the block
(Fig.4e; Supplementary Figure S6a-b) (0 h release). After
removal of the spindle poison, dimethyl
sulf-oxide (DMSO)-treated cells rapidly re-entered the cell cycle, and the majority of A375 and SSM2c cells were in G1 phase with 2N DNA content at 8 and 6 h, respectively. In contrast, the majority of A375 and SSM2c cells treated
with1 were still at G2/M phase, as indicated by the large
fraction of cells with 4N DNA content at 8 h (SSM2c) and
at 6 h (A375) (Fig. 4f; Supplementary Figure S6c). This
Table 1 Summary of IC 50 values on melanoma cell viability and inhibition o f endogenous Gli1 protein Compound Ch emical structure IC50 (nM) on cell viabil ity * Gli1 protei n inhibiti on, % ** A375 SSM 2c MeWo 1 (MR T-92) 299 ± 0.05 393 ± 0.1 614 ± 0.05 99 ± 0.5 2 368 ± 0.07 391 ± 0.04 608 ± 0.07 99 ± 0.8 3 (MR T-95) nd nd nd 31 ± 5 *IC 50 values were calculated using GraphPad; nd: IC50 cannot be determined by GraphPad. Data represent mean ± SEM **Gli1 protein levels were determined in NIH3T3 cells stimulated with SAG 100 nM and treated with 1 μ M o f each compound for 48 h. Data represent mean ± S D
Fig. 2 (See legend on next page.)
Pietrobono et al. Cell Death and Disease (2018) 9:142 Page 5 of 16
delay in the production of G1 cells could be due to their inability to initiate anaphase or to exit mitosis. Prolonged observation of treated cells indicated that cells with a 4N DNA content failed to complete mitosis, as shown by the appearance of a 8N DNA content already after 8 h, thus
suggesting mitotic catastrophe. Notably, higher doses of1
induced increase of the subG0 fraction in both SSM2c and A375 cells after 24 h, which is compatible with the
acti-vation of the “mitotic death” program of mitotic
cata-strophe (Fig.4f; Supplementary Figure S6c).
Failing mitoses are often associated with gross nuclear alterations, such as multinucleation and micronucleation, which constitute the most prominent morphological traits
of mitotic catastrophe31. Indeed, confocal microscopy
examination revealed that 1 induced the formation of
multinucleated cells (Figs. 4g, h), similarly to what
observed by cell cycle analysis (Fig.4f), with a very high
percentage of cells containing several micronuclei
(Fig. 4i). Compound 2 was less effective in delaying
mitotic exit, since 12 h (for SSM2c) and 8 h (for A375) after release most of the cells progressed into the G1 phase (Supplementary Figure S7) but, nonetheless, showed high percentage of multinucleated and
micro-nucleated cells (Figs.4g–i). Confocal microscopy showed
disruption of the spindle apparatus upon treatment with 1, confirming the induction of mitotic catastrophe
(Figs.4j, k).
At the molecular level, treatment with1 led to a
dose-dependent reduction of cyclin A2, whose inhibition
occurs upon entry into mitosis32,33, and induced
phos-phorylation of histone H3 (pH3-Ser10), which is asso-ciated with chromosome condensation and mitotic
entry34(Fig. 4l). Of note, both compounds decreased the
activity of Wee1 (pWee1-Ser642), which is involved in G2/M cell cycle checkpoint arrest to allow DNA repair
before mitotic entry35,36. As a consequence, CDC2 is
activated, as shown by decreased phosphorylation of the
Tyrosine 15 (pCDC2-Tyr15) (Fig.4l; Supplementary
Fig-ure S5g), suggesting that1 and 2 induced a forced passage
through the G2 checkpoint despite large DNA damage, which may lead to apoptosis in response to replication
stress (Fig. 3; Supplementary Figure S5)37. These data
suggest that 1 and, to a lesser extent, 2 delay exit of
melanoma cells from mitosis by inducing signs of mitotic catastrophe.
As treatment of melanoma cells with compounds
induces activation of p53 (Fig. 3a), we investigated
whe-ther p53 could mediate the effects of these compounds by
silencing it. Cell cycle analysis showed that 1 and 2
induced G2/M arrest in A375 and SSM2c cells transduced with both LV-c or LV-shp53, whereas late apoptosis occurred only in presence of p53 (Supplementary Fig-ure S8). Nocodazole treatment revealed that p53-depleted cells re-entered cell cycle earlier than cells expressing p53, but accumulated in G2/M at later time points.
Con-sistently,1 prevented inactivation of pWee1 and induced
activation of pCDC2 in absence of p53 (Supplementary Figure S9). Taken together, these results suggest that
functional p53, although not required for compound
1-induced G2/M cell cycle arrest, might play a role in mediating mitotic catastrophe.
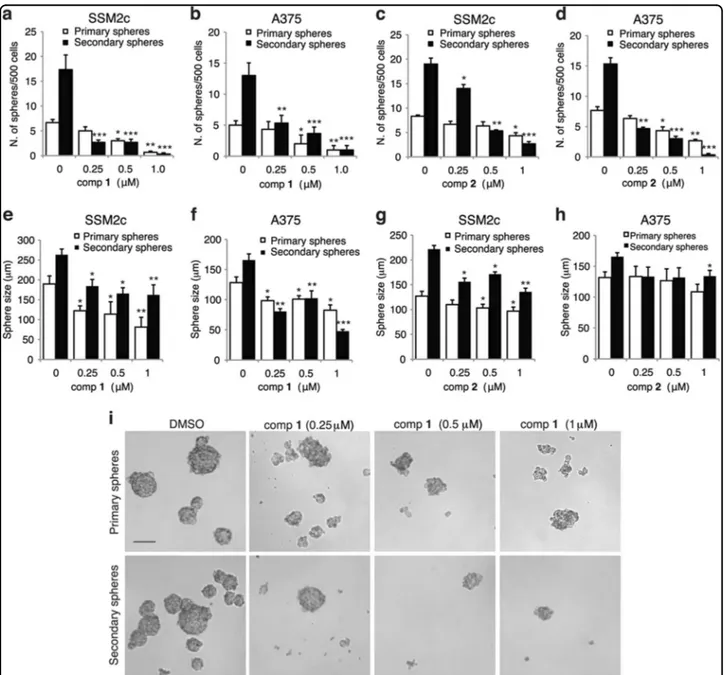
Compounds 1 and 2 suppress self-renewal of melanoma stem-like cells
HH signaling plays a pivotal role in the maintenance and self-renewal of stem-like cells in several types of
cancer38. The presence of these cells in the tumor mass is
a major cause of resistance and favors tumor relapse. However, to date SMO inhibitors have demonstrated low
selectively against stem-like cells39. Therefore, we tested
whether 1 and 2 affect clonogenic self-renewal ability of
non-adherent melanoma spheres, which are enriched in
CSCs40,41. Treatment of A375 and SSM2c cells with
increasing doses (0.1, 0.25, 0.5, 1μM) of either
com-pounds negatively affected their ability to form primary spheres and led to a progressive and almost complete loss of their ability to self-renew and form secondary spheres
from single-cell suspension (Figs. 5a–d). Primary and
secondary spheres treated with both compounds were
also reduced in size (Figs.5e–i), thus suggesting an effect
on progenitors or more differentiated cells composing the
sphere. Altogether, these data indicate that both1 and 2
drastically reduce the ability of melanoma spheres to self-renew in vitro, suggesting that these compounds have high selectively against melanoma CSCs.
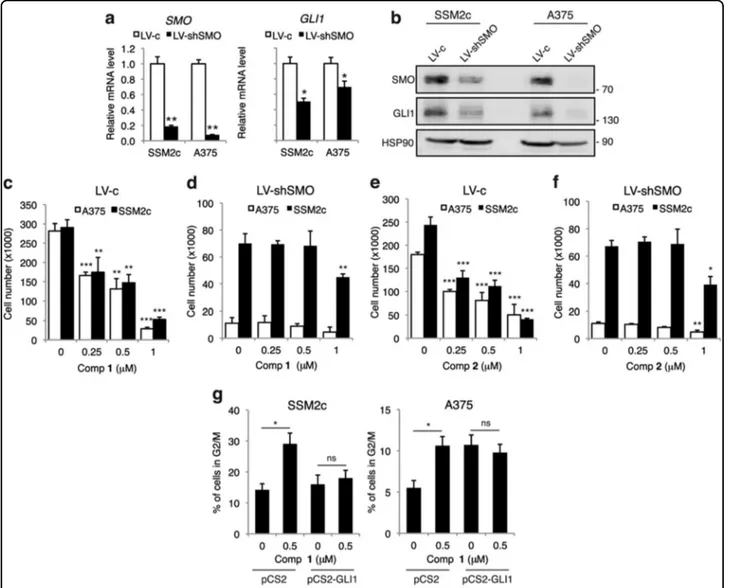
Silencing of SMO abolishes the effect of 1 and 2 on melanoma cell viability
To confirm the specificity of 1 and 2 for SMO, we
silenced it in melanoma cells using a short hairpin RNA
(seefigure on previous page)
Fig. 2 Compounds 1 and 2 inhibit melanoma cell growth in a dose-dependent manner. (a-c) Dose-response curves of 1 (a), 2 (b), and LDE-225 (c) in A375, SSM2c, and MeWo melanoma cells treated with vehicle (DMSO) or increasing doses of each drug for 72 h. Curves were obtained using GraphPad. (d) Table reports IC50values for each cell line. Data represent mean ± SEM of at least three independent experiments. (e) Western blot analysis of GLI1 in SSM2c, A375, and MeWo cells treated with DMSO or LDE-225 (10μM) for 48 h. (f) Western blot analysis of GLI1 in SSM2c, A375, and MeWo cells treated with DMSO (0) or increasing doses of 1 or 2 for 48 h. ACTIN was used as loading control. Quantification of GLI1 protein, expressed as relative ratio of GLI1/ACTIN, is shown in Italic.
Fig. 3 (See legend on next page.)
Pietrobono et al. Cell Death and Disease (2018) 9:142 Page 7 of 16
specific for SMO40and we treated them with increasing concentrations of either compounds. Silencing of SMO drastically reduced the expression of SMO and GLI1 mRNA and protein in both A375 and SSM2c cells (Figs.
6a, b), as expected. Silencing of SMO strongly inhibited
proliferation of melanoma cells compared with control
LV-c in both cell types (Figs. 6d vs c and f vs e), as
previously shown40. Noteworthy, treatment with
increasing doses of either compounds reduced viability of melanoma cells transduced with LV-c control
(Figs. 6c, e). On the contrary, treatment of
SMO-depleted melanoma cells (LV-shSMO) with both
com-pounds showed a minor effect only at 1μM in both cell
types (Figs. 6d, f). To further confirm that these
com-pounds act through the inhibition of the HH signaling to exert their anti-proliferative and mitotic catastrophe effects, we transiently overexpressed GLI1 in presence
of compound 1. Cell cycle analysis showed that GLI1
rescued the effect of 1 on G2/M cell cycle arrest
(Fig. 6g). Ectopic GLI1 prevented ATR activation and
p53 induction (Supplementary Figure 9d), consistently with the previously described negative autoregulatory
loop between p53 and GLI142–44. Thisfinding suggests
that the p53-mediated mitotic catastrophe likely occurs downstream of GLI1.
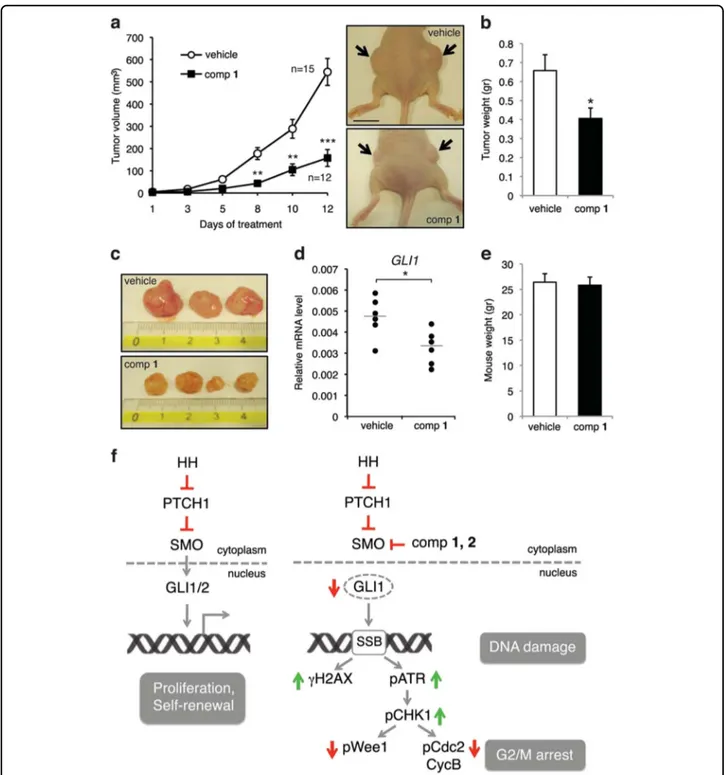
Compound 1 inhibits growth of human melanoma xenografts
To investigate the inhibitory effect of 1 on tumor
growth in vivo, A375 melanoma cells were subcutaneously injected into athymic nude mice and when tumors were palpable mice were randomized and treated twice a day
with intraperitoneal (i.p.) injections of 1 (15 mg/kg) or
vehicle alone. Treatment with 1 produced a significant
reduction in tumor growth compared with vehicle
(Figs. 7a–c), consistently with decreased expression of
GLI1 mRNA (Fig. 7d). No significant changes in body
weight of the animals were observed, indicating good
tolerance of the doses of1 (Fig.7e). These results further
confirm 1 to be effective in the inhibition of the HH
signaling and a potent anticancer agent in vivo with negligible systemic toxicity.
Discussion
The HH signaling pathway plays a critical role in the initiation and progression of several types of cancer. SMO, which is one of the major components of the HH pathway, transduces the signal in receiving cells, trigger-ing an intracellular cascade that ultimately leads to the
activation of the GLI transcription factors45. SMO is also
the target of several small-molecule inhibitors for
antic-ancer therapies8,9. The clinical development of SMO
antagonists has been undermined by several factors, including the emergence of drug resistance, severe side effects, poor pharmacokinetic properties, and low
selec-tivity on CSCs13,14.
Recently, novel acylguanidine and acylthiourea
deriva-tives targeting SMO have been discovered17. However, the
biological effects of these drugs were not addressed, nor the expression of the downstream mediator GLI1 was investigated. In this study, we report the synthesis of the
acylthiourea 3 (MRT-95), the acylguanidine 1 (MRT-92)
and itsfluoride derivative 2. We provide evidence that 1
and2 are able to reduce viability of melanoma cells, with
nanomolar IC50(Table 1), and to inhibit self-renewal of
melanoma stem-like cells. In addition, 1 drastically
reduces growth of human melanoma xenografts.
Com-pounds 1 and 2 appear to be specific toward the HH
pathway, as both are able to drastically inhibit Gli1 pro-tein expression in murine NIH3T3 cells and in human
melanoma cells without significant effect on a panel of 46
kinases. On the contrary, the substitution of the guanidine
moiety with a thiourea (3) abolishes the inhibitory activity
on the HH signaling, thus suggesting that the guanidine
moiety present in 1 and 2 is critical for their activity.
Metabolic stability studies of1 showed that the principal
metabolite is the O-demetylated compound either in rat liver microsomes (RLM) and human liver microsomes (HLM). The formation of this metabolite, however,
can-not affect the pharmacological properties of 1 but can
contribute to modify its pharmacokinetic properties, with the formation of more hydrophilic derivatives.
The clinical development of SMO antagonists has proved disappointing due to the low selectively against CSCs. Formation of clonogenic non-adherent melanoma spheres in serum-free media is a functional assay that has
(seefigure on previous page)
Fig. 3 Effects of compounds 1 and 2 on apoptosis and DNA damage. (a) Western blot analysis of DNA damage markers in SSM2c and A375 cells treated with DMSO (0) or increasing doses of 1 or 2 for 48 h. ACTIN or HSP90 were used as loading controls. (b) Confocal images ofγH2A.X in A375 melanoma cells treated with compounds 1 or 2 for 48 h. Scale bar = 40μm. (c) Quantification of γH2A.X in A375 cells as shown in b. (d-g) Evaluation of cell death by Annexin V/7-AAD staining in A375 and SSM2c cells treated with DMSO or increasing doses of 1 (d-e) or 2 (f–g). (h) Western blot analysis of apoptotic markers in SSM2c and A375 cells treated with DMSO (0) or increasing doses of 1 or 2 for 48 h. HSP90 was used as loading control. (i) Densitometric quantification of BAX/BCL2 ratio in SSM2c and A375 cells treated as indicated in h. Data are shown as mean ± SD (c) and mean ± SEM (d-g, i) of at least three independent experiments.*p < 0.05;**p < 0.01;***p < 0.001 compared with DMSO control.
Fig. 4 (See legend on next page.)
Pietrobono et al. Cell Death and Disease (2018) 9:142 Page 9 of 16
been used to investigate self-renewal ability of cancer cells
with stem-like properties41,46,47. Our data demonstrate
that1 and 2 reduce the putative CSC population in both
A375 and SSM2c melanoma cells already at 250 nM, paralleling results obtained with genetic silencing of SMO,
GLI1 or treatment with GANT61 (ref. 40) These data
suggest that both compounds have good selectivity against melanoma CSCs, making them promising candi-dates for further pre-clinical and clinical studies in mel-anoma and other types of cancer.
Our results revealed that treatment with1 or 2 induces
a replication stress that leads to the activation of the ATR/ CHK1 DNA damage signaling cascade. In mammalian cells, there are two parallel pathways that respond to stress-induced DNA damage: ATM-CHK2, mostly driven
by double-strand breaks, and ATR-CHK1, which
responds to agents interfering with replication forks and
single-strand breaks48,49. One of the earliest modifications
of chromatin in the DNA damage response is
phosphor-ylation of γH2AX, located at the sites of DNA strand
breaks as immunoreactive foci. Expression ofγH2AX was
detected by both western blot analysis and confocal
microscopy by 48 h in melanoma cells treated with1 or 2.
It was previously reported that inhibition of HH signaling with GANT61 leads to alterations in genes involved in DNA damage. In particular, it was shown that GANT61 elicits a DNA damage response in colon cancer cells
through the ATR/CHK1 axis50.
In this study, we show that1 and, to a lesser extent, 2
overcome the G2 checkpoint despite large DNA damage,
leading to the activation of the “mitotic death” program
of mitotic catastrophe in response to replication stress
(Fig. 7f). These results highlight a novel mechanism
through which these SMO inhibitors might induce cell death in melanoma cells. Mitotic catastrophe is a
tumor-suppressive mechanism, defined as a mode of cell
death that results from aberrant mitosis51. Mitotic
catastrophe can be induced by several drugs, including
spindle assembly inhibitors, DNA-damaging agents
and radiation52. It ensues from a combination of
dys-functional cell cycle checkpoints, particularly those rela-ted to DNA structure and spindle assembly, together
with cellular damage53. At the moment, the molecular
mechanisms that link mitotic catastrophe to the engage-ment of the apoptotic machinery in melanoma cells upon
treatment with 1 or 2 are unknown and are under
investigation. Nevertheless, mitotic catastrophe can be viewed as a desirable outcome for the development of
novel anticancer drugs31. First, a considerable amount of
cancer cells are tetraploid or aneuploid, rendering them more prone to mitotic aberrations and therefore
particularly sensitive to the induction of mitotic
catastrophe. Second, several chemotherapeutic drugs are
currently used at concentrations that induce
apoptosis irrespective of the cell cycle phase, yet are very efficient at triggering mitotic catastrophe at lower doses, which would significantly limit side effects.
In conclusion, we report the synthesis and the biological characterization of the most potent SMO inhibitors of the acylguanidine family discovered so far.
Our findings highlight the enhanced HH pathway
inhi-bition and anticancer properties of these compounds, opening the avenue for novel therapeutics for melanoma and, possibly, other types of cancer with active HH signaling.
Materials and methods
Cell lines and treatments
Commercial human melanoma cell lines A375 and MeWo and murine NIH3T3 cells were obtained from ATCC (Manassas, VA, USA). Cells were maintained in Dulbecco’s modified Eagle’s medium (DMEM) (Euro-clone, Milan, Italy) supplemented with 10% fetal bovine serum (FBS), 1% penicillin-streptomycin, 1% glutamine (Lonza, Basel, Switzerland). Patient-derived SSM2c
mel-anoma cells were previously described54, and were grown
in DMEM/F12 (Euroclone) supplemented with 10% FBS, 1% penicillin-streptomycin, 1% glutamine (Lonza) and
(seefigure on previous page)
Fig. 4 Compound 1 induces G2/M cell cycle arrest in melanoma cells. (a-d) Cell cycle analysis in A375 and SSM2c cells treated with DMSO (0) or increasing doses of 1 or 2. (e) Effect of nocodazole treatment (600 nM) for 16 h in A375 cells. (f) Cells were treated as indicated after release from nocodazole block and cell cycle distribution was determined byflow cytometric analysis of propidium iodide-stained cells collected at the indicated time points (right). Note that treatment with 1 prevents cell cycle progression after the released from nocodazole block. (g) Representative confocal microscopy images showing multinucleated A375 melanoma cells following treatment with DMSO and compounds 1 or 2 (1μM for 48 h). Cells were incubated with WGA and nuclei were stained with DAPI. Scale bar = 10μm. (h) Percentage of multinucleated A375 cells after treatment with DMSO, 1 or 2 for 48 h. (i) Percentage of A375 cells with micronuclei after treatment with DMSO, 1 or 2 for 48 h. (j) Percentage of A375 with mitotic catastrophe after treatment with 1 for 72 h. Cells were stained withα-tubulin (red), γ-tubulin (green), and DAPI (blue) to evaluate mitotic progression. Over 150 mitotic cells were observed and scored as normal or undergoing mitotic catastrophe. (k) Representative confocal microscopy images of A375 cells counted as normal mitosis (DMSO) or mitotic catastrophe after treatment with compound 1. Cells were stained withα-tubulin, γ-tubulin, and DAPI. Scale bar = 10μm. (l) Western blot analysis of cell cycle markers in SSM2c and A375 cells treated with DMSO (0) or increasing doses of compound 1 for 24 h. ACTIN was used as loading controls. Data are shown as mean ± SD (h, i) or mean ± SEM (j) of at least three independent experiments.*p < 0.05;**p < 0.01;***p < 0.001 compared with DMSO control.
epidermal growth factor (EGF) (5ng/ml) (Life Technolo-gies, Paisley, UK). Cells were periodically screened for mycoplasma contamination by PCR. For cell viability assay, 15,000 cells per well were plated in 12-well plates and treated with LDE-225 (Selleckchem, Munich,
Ger-many). Compounds1, 2, or 3 were used at the indicated
concentrations for 48 h in 1% FBS. Nocodazole (Sigma-Aldrich, St Louis, MO, USA) was used at 600 nM for 16 h.
Luciferase reporter assays
Luciferase reporters were used in combination with Renilla luciferase pRL-TK reporter vector (Promega, Madison, WI, USA) to normalize luciferase activities; pGL3Basic vector (Promega) was used to equal DNA amounts. Luminescence was measured using the Dual-Glo Luciferase Assay System (Promega) and the Dual-GloMax® 20/20 Luminometer (Promega).
Fig. 5 Compounds 1 and 2 inhibit self-renewal of melanoma stem-like cells. (a-d) Effects of 1 (a, b) and 2 (c, d) on primary and secondary spheres from SSM2c (a, c) and A375 (b, d) melanoma cells. (e-h) Spheres size, as indicated in a-d. Melanoma spheres were treated at the indicated doses for 96 h during primary sphere formation and left untreated to form secondary spheres. In all, 500 single cells were plated and the number of spheres larger than 50μm was counted after 1 week. Data represent mean ± SEM of three independent experiments. (i) Representative phase contrast images of primary and secondary SSM2c spheres as indicated in a. Scale bar = 100μm.*p < 0.05;**p < 0.01;***p < 0.001 compared with DMSO control (0)
Pietrobono et al. Cell Death and Disease (2018) 9:142 Page 11 of 16
Lentiviral vectors and plasmids
Lentiviruses were produced in HEK-293T cells. Lenti-viral vectors pLKO.1-puro and pLKO.1-shSMO were
already described40. Cells were transfected with equal
amounts of pCS2-Myc-tagged human GLI1 or pCS2-Myc.
Quantitative real-time PCR
Total RNA was isolated with TriPure Isolation Reagent (Roche Diagnostics, Basel, Switzerland), subjected to DNase I treatment (Roche Diagnostics). Reverse tran-scription was performed with High Capacity cDNA
Reverse Transcription Kit (Applied Biosystems, Carlsbad, CA, USA). Quantitative real-time PCR (qPCR) amplifi-cations were carried out at 60 °C using FastStart SYBR Green Master (Roche Diagnostics) in a Rotorgene-Q.
Primer sequences are: β-ACTIN fwd:
5ʹ-GAAAATCTGGCACCACACCT-3ʹ; β-ACTIN rev:
5ʹ-TAGCACAGCCTGGATAGCAA-3ʹ; GAPDH fwd:
5ʹ-GACGCTGGGGCTGGCATTG-3ʹ; GAPDH rev:
5ʹ-GCTGGTGGTCCAGGGGTC-3ʹ; TBP fwd:
5ʹ-CAA-CAGCCTGCCACCTTAC-3ʹ; TBP rev:
5ʹ-CTGAA-TAGGCTGTGGGGTC-3ʹ; GLI1 fwd: 5
ʹ-Fig. 6 Silencing of SMO abolishes the effect of 1 and 2 on melanoma cell viability. (a) Quantitative real-time PCR (qPCR) analysis of SMO and GLI1 mRNA in SSM2c and A375 cells treated as indicated. The y axis represents expression ratio of gene/(GAPDH andβ-ACTIN average), with the level of control equated to 1. (b) Western blot analysis of SMO and GLI1 in A375 and SSM2c melanoma cells transduced with LV-c or LV-shSMO. HSP90 was used as loading control. (c-f) Effect of 1 (c-d) and 2 (e-f) on viability of A375 and SSM2c melanoma cells transduced with LV-c or LV-shSMO. Cells were treated with DMSO (0), 1 or 2 at the indicated doses for 72 h. (g) Percentage of SSM2c and A375 cells in G2/M phase upon transient transfection of pCS2 or pCS2-GLI1 and treatment with DMSO (0) or 1. Data are shown as mean ± SD of at least three independent experiments.*
p < 0.05;**p < 0.01;***p < 0.001 compared with DMSO control
Fig. 7 Inhibition of melanoma xenograft growthin vivo by 1 and mechanism of action. (a) In vivo tumor growth of A375 melanoma cells subcutaneously injected into athymic nude mice. Animals were treated at tumor appearance with vehicle or compound 1 (15 mg/kg). After 12 days of treatment, mice were sacrificed. Number of tumors for each group is indicated. Representative images of A375 xenografts, as indicated. Scale bar = 10 mm. (b) Tumor weight in mice treated with vehicle or compound 1. (c) Representative tumor size in mice treated with vehicle or compound 1. (d) qPCR of GLI1 mRNA in melanoma xenografts in mice treated with vehicle or compound 1 (six tumors were analyzed for each group). The y axis represents expression ratio of gene/(GAPDH and TBP average). (e) Mice body weight at the end of the treatment. Data shown are mean ± SEM (a, b) or mean ± SD (e).*p < 0.05;**p < 0.01;***p < 0.001 compared with vehicle control. (f) Schematic representation of the mechanism underlying the inhibition of HH pathway that results in G2/M arrest. Targeting SMO with 1 and 2 blocks GLI1 function and induces DNA damage with formation of γH2AX foci, activation of the ATR-CHK1 axis and sign of mitotic catastrophe, as observed by increased chromatin condensation (pH3-Ser10), multinucleation, presence of micronuclei, and aberrant mitotic spindle (see Fig.5for details)
Pietrobono et al. Cell Death and Disease (2018) 9:142 Page 13 of 16
CCCAGTACATGCTGGTGGTT-3ʹ; GLI1 rev:
5ʹ-GCTTTACTGCAGCCCTCGT-3ʹ; SMO fwd:
5ʹ-GGGAGGCTACTTCCTCATCC-3ʹ; SMO rev:
5ʹ-GGCAGCTGAAGGTAATGAGC-3ʹ.
Primary sphere formation and self-renewal assay
For melanoma-sphere cultures, cells were seeded in human embryonic stem cell medium supplemented with
4 ng/ml basic fibroblast growth factor (bFGF), as
pre-viously reported40,41,54. For primary sphere formation
assay, melanoma cells were seeded in 12-well plates at 1
cell/μl dilution and spheres were counted after 96 h. For
self-renewal assay, primary melanoma spheres were dis-sociated into single cells and plated at 1 cell/μl dilution in 12-well plates. After 1 week, secondary spheres were counted.
Flow cytometric analysis
For cell cycle analysis, melanoma cells were
resus-pended in 50μg/ml propidium iodide, 0,1% Triton X-100
and 0.1% sodium citrate 24 h after treatment with
com-pound1, 2 or vehicle (DMSO). Data were collected on BD
Accuri C6 software and analyzed using ModFit LT soft-ware (Verity Softsoft-ware House). For the mitotic shake off procedure, cells were treated for 16 h with 600 nM of
nocodazole. Typically, ≈95% cells were in mitosis after
nocodazole removal. Cells were then washed with
com-plete medium and treated with1, 2 or vehicle at indicated
concentration in 1% FBS. Cell cycle distribution was
analyzed every 2 h by using flow cytometry analysis. For
apoptosis, melanoma cells were measured 48 h after
treatment with 1 or 2 using Annexin V-PE/7-AAD
apoptosis kit (BD Biosciences, San Jose, CA, USA), according to the manufacturer’s instructions. The number
of both early (Annexin V+/7-AAD−) and late (Annexin
V+/7-AAD+) apoptotic cells was detected and analyzed
using BD Accuri C6 software.
Western blot analysis
Western blotting was performed as already described55.
The following antibodies were used: mouse anti-GLI1 (#2643), mouse anti-cyclin A2 (#4656), rabbit anti-BCL2 (#2876), rabbit anti-BAX (#2772), rabbit anti-cyclin B1 (#12231), rabbit PARP-1 (#9532), rabbit ATR (Ser428) (#2853), rabbit anti-phospho-CHK1 (Ser345) (#2348), rabbit anti-phospho-CDC2 (Tyr15) (#4539), rabbit anti-phospho-H2A.X (Ser139) (#9718), rabbit anti-phospho-Histone H3 (Ser10) (#3377), rabbit anti-phospho-WEE1 (Ser642) (#4910) (Cell Sig-naling Technology, Danvers, MA, USA), rabbit CDC2 (sc-954), mouse Myc (sc-40), mouse anti-HSP90 (sc-13119) (Santa Cruz Biotechnology, Santa Cruz, CA, USA), and rabbit anti-SMO (ST1718) (Merck Milli-pore, Burlington, MA, USA). Chemiluminescent detection
was used. Cell fractionation was performed as previously
described56. The following antibodies were used: mouse
GLI1 (#2643) (Cell Signaling Technology), goat anti-fibrillarin (D-14), and goat anti-GAPDH (V-18) (Santa Cruz Biotechnology).
Immunofluorescence and confocal microscopy
For immunofluorescence experiments, A375 cells were
seeded at a density of 5× 10³ in 12-well cluster plates in
DMEM supplemented with 1% FBS. After 24 h, cells were
treated with compounds 1 or 2 (0.5 and 1 μM for 48 h).
Cells were then washed with phosphate-buffered saline
(PBS), fixed with ice-cold methanol for 5 min and
per-meabilized with Triton 0.2% in PBS for 10 min.
Immu-nostaining of γH2AX was performed as previously
described57. For Wheat Germ Agglutinin (WGA)
immu-nostaining, cells were labeled as previously described58.
Samples were visualized on a TSC SP5 confocal micro-scope (Leica Microsystems, Milan, Italy) installed on an inverted LEICA DMI 6000CS microscope, using PlanApo
40× 1.25 NA objective or PlanApo 63 × 1.4 NA oil
immersion objectives. Images were acquired using the LAS AF acquisition software (Leica Microsystems). Fluorescence intensity measurements were performed using the Quantitation Module of Volocity software (Perkin Elmer Life Science, Milan, Italy).
Xenografts
A375 cells were resuspended in Matrigel (Becton Dickinson, Milan, Italy)/DMEM (1/1) and subcutaneously
injected (10,000 cells per injection) into lateral flanks of
adult (8 weeks) female athymic nude mice (Foxn1 nu/nu)
(Envigo, Udine, Italy), as previously described55,56. Once
tumors were palpable, mice were randomized in two
groups and treated i.p. twice a day with comp1 (15 mg/
kg) dissolved in vehicle (30% 2-hydroxypropyl-
β-cyclo-dextrin) (Sigma-Aldrich) or vehicle alone for 12 days. Subcutaneous tumor size was measured three times a week with a caliper and tumor volumes were calculated
using the formula: V= W2× L × 0.5, where W and L are,
respectively, tumor width and length. The experiments were approved by the Italian Ministry of Health and were in accordance with the Italian guidelines and regulations.
Statistical analysis
Data represent mean± SD or mean ± SEM values
cal-culated on at least three independent experiments. The p-values were calculated using one-way analysis of variance or Student’s t-test. A two-tailed value of p < 0.05 was considered statistically significant.
Acknowledgements
This work was partially supported by a grant from the Italian Association for Cancer Research (AIRC) to B.S. (IG-14184).
Author details 1
Core Research Laboratory, Istituto Toscano Tumori, Florence, Italy.2Consiglio Nazionale delle Ricerche, Istituto di Fisiologia Clinica and Core Research Laboratory, Istituto Toscano Tumori, AOU Senese, Siena, Italy.3Department of Life Sciences, University of Siena, Siena, Italy.4Department of Biotechnology, Chemistry and Pharmacy, University of Siena, Siena, Italy.5Department of Oncology, Careggi University Hospital, Florence, Italy
Authors contributions
B.S., M.T., E.P., and F.M. designed the study. S.P., R.S., S.G., F.D., and D.C. conducted the experiments. F.M. designed and E.P. synthesized the compounds. C.L. and M.V. studied the metabolic stability. B.S., S.P., R.S., M.C., F. M., and E.P. analyzed the results. B.S. and S.P. wrote the manuscript. All authors reviewed the manuscript.
Conflict of interest
The authors declare that they have no conflict of interest. Publisher's note
Springer Nature remains neutral with regard to jurisdictional claims in published maps and institutional affiliations.
Supplementary information
The online version of this article (https://doi.org/10.1038/s41419-017-0142-0) contains supplementary material.
Received: 4 August 2017 Revised: 9 November 2017 Accepted: 13 November 2017
References
1. Ingham, P. W. & McMahon, A. P. Hedgehog signaling in animal development: paradigms and principles. Genes Dev. 15, 3059–3087 (2002).
2. Beachy, P. A., Karhadkar, S. S. & Berman, D. M. Tissue repair and stem cell renewal in carcinogenesis. Nature 432, 324–331 (2004).
3. Teglund, S. & Toftgård, R. Hedgehog beyond medulloblastoma and basal cell carcinoma. Biochim. Biophys. Acta. 1805, 181–208 (2010).
4. Pak, E. & Segal, R. A. Hedgehog signal transduction: key players, oncogenic drivers, and cancer therapy. Dev. Cell. 38, 333–344 (2016).
5. McMillan, R. & Matsui, W. Molecular pathways: the hedgehog signaling pathway in cancer. Clin. Cancer Res. 18, 4883–4888 (2012).
6. Chen, J. K., Taipale, J., Cooper, M. K. & Beachy, P. A. Inhibition of Hedgehog signaling by direct binding of cyclopamine to Smoothened. Genes Dev. 16, 2743–2748 (2002).
7. Taipale, J. et al. Effects of oncogenic mutations in Smoothened and Patched can be reversed by cyclopamine. Nature 406, 1005–1009 (2000).
8. Amakye, D., Jagani, Z. & Dorsch, M. Unraveling the therapeutic potential of the Hedgehog pathway in cancer. Nat. Med. 19, 1410–1422 (2013).
9. Lin, T. L. & Matsui, W. Hedgehog pathway as a drug target: Smoothened inhibitors in development. Onco. Targets Ther. 5, 47–58 (2012).
10. Yauch, R. L. et al. Smoothened mutation confers resistance to a Hedgehog pathway inhibitor in medulloblastoma. Science 326, 572–574 (2009). 11. Atwood, S. X. et al. Smoothened variants explain the majority of drug
resis-tance in basal cell carcinoma. Cancer Cell. 27, 342–353 (2015).
12. Sharpe, H. J. et al. Genomic analysis of smoothened inhibitor resistance in basal cell carcinoma. Cancer Cell. 27, 327–341 (2015).
13. Pandolfi, S. & Stecca, B. Cooperative integration between HEDGEHOG-GLI signaling and other oncogenic pathways: implications for cancer therapy. Expert. Rev. Mol. Med. 17, e5 (2015).
14. Infante, P., Alfonsi, R., Botta, B., Mori, M. & Di Marcotullio, L. Targeting GLI factors to inhibit the Hedgehog pathway. Trends Pharmacol. Sci. 36, 547–558 (2015). 15. Dijkgraaf, G. J. et al. Small molecule inhibition of GDC-0449 refractory smoothened mutants and downstream mechanisms of drug resistance. Cancer Res. 71, 435–444 (2011).
16. Buonamici, S. et al. Interfering with resistance to smoothened antagonists by inhibition of the PI3K pathway in medulloblastoma. Sci. Transl. Med. 2, 51ra70 (2010).
17. Solinas, A. et al. Acylthiourea, acylurea, and acylguanidine derivatives with potent hedgehog inhibiting activity. J. Med. Chem. 55, 1559–1571 (2012). 18. Hoch, L. et al. MRT-92 inhibits Hedgehog signaling by blocking overlapping
binding sites in the transmembrane domain of the Smoothened receptor. FASEB. J. 29, 1817–1829 (2015).
19. Chen, J. K., Taipale, J., Young, K. E., Maiti, T. & Beachy, P. A. Small molecule modulation of Smoothened activity. Proc. Natl. Acad. Sci. USA 99, 14071–14076 (2002).
20. Lauth, M., Bergström, A., Shimokawa, T. & Toftgård, R. Inhibition of GLI-mediated transcription and tumor cell growth by small-molecule antagonists. Proc. Natl. Acad. Sci. USA 104, 8455–8460 (2007).
21. Lee, J., Platt, K. A. & Censullo, P. & Ruiz i Altaba, A. Gli1 is a target of Sonic hedgehog that induces ventral neural tube development. Development 124, 2537–2552 (1997).
22. Kogerman, P. et al. Mammalian suppressor-of-fused modulates nuclear-cytoplasmic shuttling of GLI1. Nat. Cell. Biol. 1, 312–319 (1999).
23. Stecca, B. et al. Melanomas require Hedgehog-Gli signaling regulated by interactions between Gli1 and the RAS-MEK/AKT pathways. Proc. Natl. Acad. Sci. USA 104, 5895–5900 (2007).
24. O’Reilly, K. E. et al. Hedgehog pathway blockade inhibits melanoma cell growth in vitro and in vivo. Pharmaceuticals (Basel) 6, 1429–1450 (2013). 25. Jalili, A. et al. NVP-lde225, a potent and selective smoothened antagonist
reduces melanoma growth in vitro and in vivo. PLoS ONE 8, e69064 (2013). 26. Swift, L. H. & Golsteyn, R. M. Genotoxic anticancer agents and their relationship
to DNA damage, mitosis, and checkpoint adaptation in proliferating cancer cells. Int J. Mol. Sci. 15, 3403–3431 (2014).
27. Tibbetts, R. S. et al. A role for ATR in the DNA damage-induced phosphor-ylation of p53. Genes Dev. 13, 152–p157 (1999).
28. Wei, H. & Yu, X. Functions of PARylation in DNA damage repair pathways. Genom. Proteom. Bioinforma. 14, 131–139 (2016).
29. Ward, I. M. & Chen, J. Histone H2AX is phosphorylated in an ATR-dependent manner in response to replicational stress. J. Biol. Chem. 276, 47759–47762 (2001).
30. Oltvai, Z. N., Milliman, C. L. & Korsmeyer, S. J. Bcl-2 heterodimerizes in vivo with a conserved homolog, Bax, that accelerates programmed cell death. Cell 74, 609–619 (1993).
31. Vitale, I., Galluzzi, L., Castedo, M. & Kroemer, G. Mitotic catastrophe: a mechanism for avoiding genomic instability. Nat. Rev. Mol. Cell. Biol. 12, 385–392 (2011).
32. den Elzen, N. & Pines, J. Cyclin A is destroyed in prometaphase and can delay chromosome alignment and anaphase. J. Cell. Biol. 153, 121–136 (2001). 33. Geley, S. et al. Anaphase-promoting complex/cyclosome-dependent
proteo-lysis of human cyclin A starts at the beginning of mitosis and is not subject to the spindle assembly checkpoint. J. Cell. Biol. 153, 137–148 (2001). 34. Crosio, C. et al. Mitotic phosphorylation of histone H3: spatio-temporal
reg-ulation by mammalian Aurora kinases. Mol. Cell. Biol. 22, 874–885 (2002). 35. Russell, P. & Nurse, P. Negative regulation of mitosis by wee1+, a gene
encoding a protein kinase homolog. Cell 49, 559–567 (1987).
36. Mir, S. E. et al. In silico analysis of kinase expression identifies WEE1 as a gatekeeper against mitotic catastrophe in glioblastoma. Cancer Cell. 18, 244–257 (2010).
37. Do, K., Doroshow, J. H. & Kummar, S. Wee1 kinase as a target for cancer therapy. Cell Cycle 12, 3159–3164 (2013).
38. Cochrane, C. R., Szczepny, A., Watkins, D. N. & Cain, J. E. Hedgehog signaling in the maintenance of cancer stem cells. Cancers (Basel) 7, 1554–1585 (2015). 39. Justilien, V. & Fields, A. P. Molecular pathways: novel approaches for improved
therapeutic targeting of Hedgehog signaling in cancer stem cells. Clin. Cancer Res. 21, 505–513 (2015).
40. Santini, R. et al. Hedgehog-GLI signaling drives self-renewal and tumorigenicity of human melanoma-initiating cells. Stem Cells 30, 1808–1818 (2012). 41. Pietrobono, S. et al. Down-regulation of SOX2 underlies the inhibitory effects
of the triphenylmethane gentian violet on melanoma cell self-renewal and survival. J. Invest. Dermatol. 136, 2059–2069 (2016).
42. Abe, Y. et al. Hedgehog signaling overrides p53-mediated tumor suppression by activating Mdm2. Proc. Natl. Acad. Sci. USA 105, 4838–4843 (2008). 43. Stecca, B. & Ruiz i Altaba, A. A GLI1-p53 inhibitory loop controls neural stem
cell and tumour cell numbers. EMBO J. 28, 663–676 (2009).
44. Mazzà, D. et al. PCAF ubiquitin ligase activity inhibits Hedgehog/Gli1 signaling in p53-dependent response to genotoxic stress. Cell. Death. Differ. 20, 1688–1697 (2013).
Pietrobono et al. Cell Death and Disease (2018) 9:142 Page 15 of 16
45. Robbins, D. J., Fei, D. L. & Riobo, N. A. The Hedgehog signal transduction network. Sci. Signal. 5, re6 (2012).
46. Infante, P. et al. Inhibition of Hedgehog-dependent tumors and cancer stem cells by a newly identified naturally occurring chemotype. Cell Death Dis. 7, e2376 (2016).
47. Kumar, V. et al. Design, synthesis and biological evaluation of novel Hedgehog inhibitors for treating pancreatic cancer. Sci. Rep. 7, 1665 (2017).
48. Abraham, R. T. Cell cycle checkpoint signaling through the ATM and ATR kinases. Genes Dev. 15, 2177–2196 (2001).
49. Osborn, A. J., Elledge, S. J. & Zou, L. Checking on the fork: the DNA replication stress-response pathway. Trends Cell. Biol. 12, 509–516 (2002).
50. Mazumdar, T., DeVecchio, J., Agyeman, A., Shi, T. & Houghton, J. A. Blocking Hedgehog survival signaling at the level of the GLI genes induces DNA damage and extensive cell death in human colon carcinoma cells. Cancer Res. 71, 5904–5914 (2011).
51. Galluzzi, L. et al. Molecular definitions of cell death subroutines: recommen-dations of the Nomenclature Committee on Cell Death 2012. Cell. Death. Differ. 19, 107–120 (2012).
52. Denisenko, T. V., Sorokina, I. V., Gogvadze, V. & Zhivotovsky, B. Mitotic cata-strophe and cancer drug resistance: a link that must to be broken. Drug. Resist. Updat. 24, 1–12 (2016).
53. Castedo, M. et al. Cell death by mitotic catastrophe: a molecular definition. Oncogene 23, 2825–2837 (2004).
54. Santini, R. et al. SOX2 regulates self-renewal and tumorigenicity of human melanoma-initiating cells. Oncogene 33, 4697–4708 (2014).
55. Pandolfi, S., Montagnani, V., Lapucci, A. & Stecca, B. HEDGEHOG/GLI-E2F1 axis modulates iASPP expression and function and regulates melanoma cell growth. Cell. Death. Differ. 22, 2006–2019 (2015).
56. Pandolfi, S. et al. WIP1 phosphatase modulates the Hedgehog signaling by enhancing GLI1 function. Oncogene 32, 4737–4747 (2013).
57. Rossi, M. et al. MAPK15 upregulation promotes cell proliferation and prevents DNA damage in male germ cell tumors. Oncotarget 7, 20981–20998 (2016).
58. Monaco, I. et al. Aptamer functionalization of nanosystems for glioblastoma targeting through the blood-brain barrier. J. Med. Chem. 60, 4510–4516 (2017).

![Improvement of pyrazolo[3,4-d]pyrimidines pharmacokinetic properties: Nanosystem approaches for drug delivery](data:image/gif;base64,R0lGODlhAQABAIAAAP///wAAACH5BAEAAAAALAAAAAABAAEAAAICRAEAOw==)