PHD THESIS
HIDDEN UNEMPLOYMENT:
A CRITICAL REVIEW AND ANALYSIS ACROSS COUNTRIES
by
FRANCIS AMOASAH
This is a Thesis submitted to the Department of Economics and Law of the University of Cassino and Southern Lazio in fulfillment of the requirements for the Award of a Doctor of
Philosophy (PhD) Degree in
Economics
(Institutions, Markets and Behaviors)
Due: October 2019
UNIVERSITÀ DEGLI STUDI DI
CASSINO E DEL LAZIO MERIDIONALE
Corso di Dottorato in
Istituzioni, Mercati e Comportamenti
Curriculum: Applied Economics
Ciclo XXXII
A. A. 2016/2017
Hidden Unemployment:
A Critical Review and Analysis across the World
SSD:
(SECS – P/01 )Coordinatore del Corso
Chiar.mo Prof. (Rosella Tomassoni) Dottorando (Francis Amoasah)
Supervisore
Table of Contents
Extended Abstract of thesis ... iv
Acknowledgements ... v
List of abbreviations ... vii
CHAPTER I ... 1
Introduction ... 1
Statement of the problem ... 2
Motivation for the study ... 4
Chapter II ... 7
Overview of concepts, definitions and the nature of unemployment ... 7
Definitions by the International Labour Office ... 10
Measurement of broader rates of unemployment ... 15
A short history of statistics on the labour market ... 16
Informality in employment ... 18
Prominent Institutions - The major statistical organizations ... 20
International Labour Organization (ILO) ... 20
The Statistical Office for European Communities (Eurostat) ... 24
The Organization for Economic Co-operation and Development (OECD) ... 25
Country measures and studies on labour underutilization ... 30
The United States ... 30
Canada ... 32
Some individuals’ studies ... 33
Dynamics in unemployment and measurement ... 35
CHAPTER III ... 39
Hidden unemployment in the United States ... 39
3.1 Introduction ... 39
3.2 Unemployment and under-employment in the United States ... 41
The US unemployment situation ... 43
Economy ... 43
Labour force participation ... 45
Part-time (for economic reasons), marginal attachment and job-seeker discouragement, and gender ... 48
Unemployment rate by youth, women, part-time, U3 and U6 ... 52
Recession in the United States ... 54
Methodology ... 56
Determining the determinants of U6: a systematic approach ... 59
Proceeding from Autoregressive distributive lag model (ARDL) ... 67
Johansen cointegration Analysis ... 71
Conclusion ... 75
CHAPTER IV ... 77
Introduction ... 77
Data challenges ... 83
Global trends in unemployment ... 86
A note on the labour underutilization in the least developed countries ... 94
Complementary statistics of the ILO ... 97
Conclusion to the chapter ... 100
CHAPTER V ... 102
Underemployment among European countries ... 102
Analysis of the dynamics of unemployment over time in European countries ... 108
Further analysis using OECD countries ... 113
Marginally attached labour in the OECD ... 115
Conclusion to the chapter ... 117
General conclusion and policy recommendation ... 118
APPENDICES ... 120
References ... 153
List of Tables Figure 2. 1 Employment quantity and labour market slack (2015) ... 28
Table 3. 1 Description of variables ... 58
Table 3. 2 Ordinary Least Squares (our general model) ... 60
Table 3. 3 OLS Restricted model ... 62
Table 3. 4 GLS Restricted ECM model 3.4 ... 63
Table 3. 5 GLS Restricted ECM model 3.5 ... 64
Table 3. 6 GLS Alternative Restricted ECM model 3.6 ... 66
Table 3. 7 ARDL model ... 69
Table 3. 8 ARDL long run form and bounds test ... 70
Table 3. 9 Comparison of models ... 74
Table 4. 1 ILO modelled estimates for 2017 (Figures are in thousands) ... 78
Table 4. 2 Correlation between variables ... 90
Table 4. 3 Model estimation ... 93
Table 5. 1 The unemployment statistics for EU28 (for 2016) ... 103
List of Figures Figure 2. 1 Employment quantity and labour market slack (2015) ... 28
Figure 3. 1 Measures of Labour Underutilization from the Current Population Survey, US Bureau of Labour Statistics ... 42
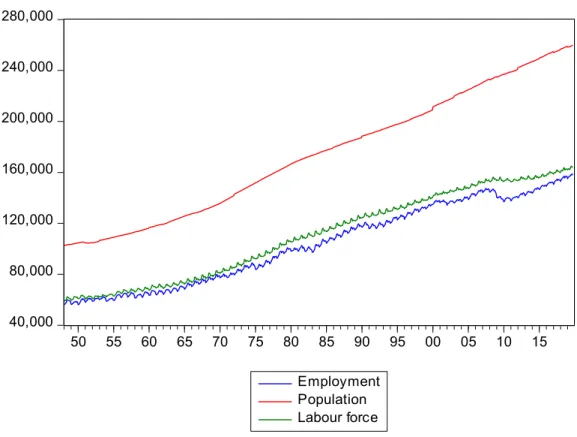
Figure 3. 3 Employment-population ratio ... 45
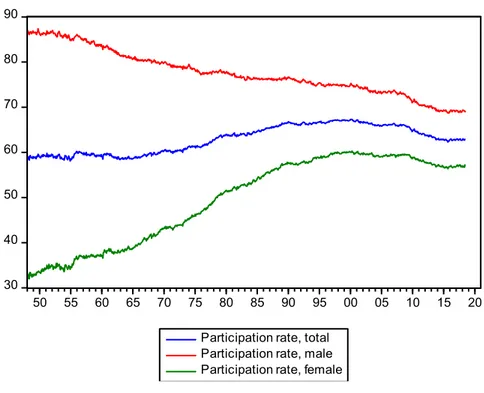
Figure 3. 4 Civilian labour force participation rate: by gender and age ... 46
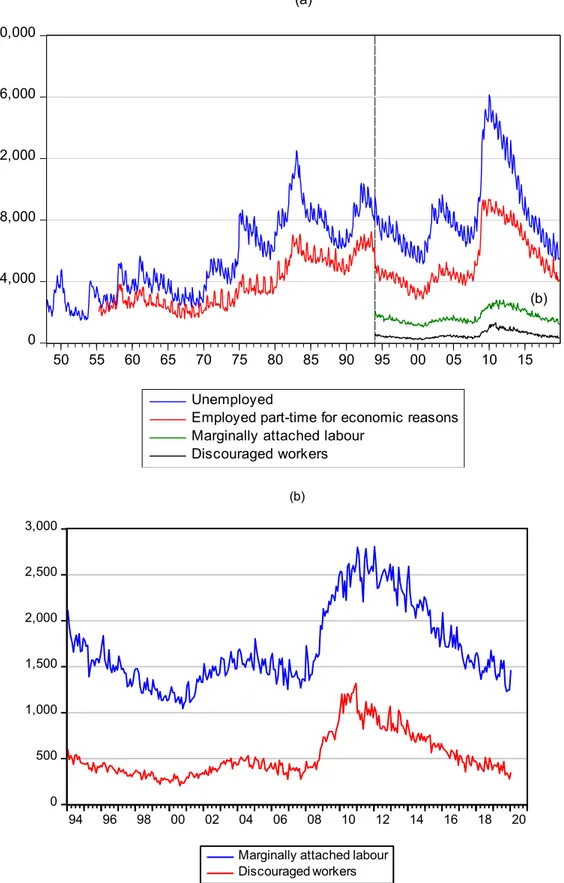
Figure 3. 5 Unemployment, employed part-time for economic reasons, discouraged and marginally attached labour ... 50
Figure 3. 6 Ratio of part-time for economic reasons to total employment vs ratio of unemployment to working-age population ... 51
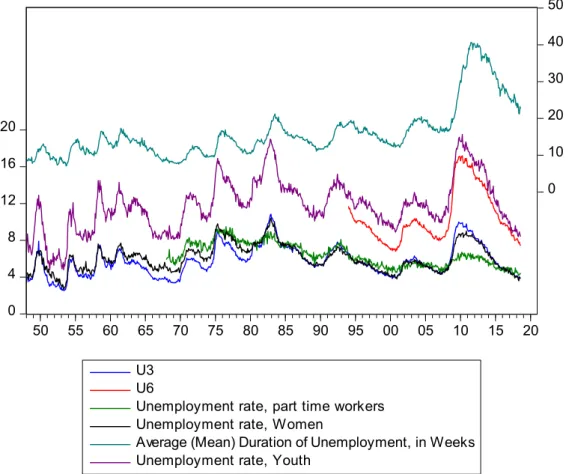
Figure 3. 7 Trends in U3, U6, Women unemployment rate, Youth unemployment rate, and Part-time unemployment rate ... 53
Figure 3. 8 Gap between U6 and U3 vs Number of unemployed persons per job opening ... 55
Figure 3. 9 XY plot of U6 on U3 ... 57
Figure 3. 10 United States Extended Unemployment ... 67
Figure 3. 11 U6 backcast ... 72
Figure 4. 1 Youth employment and unemployment rate ... 81
Figure 4. 2 Status in Employment: World ... 83
Figure 4. 3 Unemployment vs the Potential labour force (World’s regions) ... 87
Figure 4. 4 Unemployment rate vs combined rate of unemployment and potential labour force, world’s regions ... 88
Figure 4. 5 Relationship between the LU4 and its determinants ... 90
Figure 4. 6 Traditional unemployment rates, groups ... 95
Figure 4. 7 Traditional unemployment rates, countries ... 97
Figure 4. 8 The labour dependency ratio for the world and its regions ... 98
Figure 5. 1 Trends in unemployment (EU28 and EA19) ... 108
Figure 5. 2 Time series of U, ANS, SNA and UEP (% of ELF) ... 109
Figure 5. 3 Movements in the rates among some European countries ... 110
Figure 5. 4 Increasing U6-U3 gap among some of the countries ... 111
Figure 5. 5 Persons employed part time for economic reasons ... 112
Figure 5. 6 Youth not in education, employment or training (NEET) OECD average, estimate for 2018 ... 115
List of Appendices Appendix 1. 1 Synopsis of coverage and concepts of unemployment in labour force surveys 120 Appendix 1. 2 Schematic presentation of operational definitions of Hauser’s labour underutilization framework ... 121
Appendix 3. 1 Current Alternative measures of labour underutilization (Percent), US ... 121
Appendix 3. 2 Old Measures (U1 - U7) of labour underutilization (Percent), United States .. 122
Appendix 3. 3 Supplementary unemployment rates, Canada ... 122
Appendix 3. 4 Descriptive stats our variables ... 123
Appendix 3. 5 Correlation matrix ... 124
Appendix 3. 6 Johansen cointegration between U6 and U3 ... 125
Appendix 3. 7 Redundant Variables Test ... 127
Appendix 3. 8 Wald test ... 128
Appendix 3. 9 Determining the number of lags ... 128
Appendix 3. 11 Battery of tests Model 6 ... 130
Appendix 3. 12 Battery of tests Model 3.7 ... 133
Appendix 3. 13 Battery of tests VECM ... 136
Appendix 3. 14 Results of Johansen cointegration test ... 138
Appendix 3. 15 Plot of residuals of ARDL model ... 138
Appendix 3. 16 Granger causality ... 139
Appendix 3. 17 Recession in the US: dates and duration ... 139
Appendix 3. 18 Breakpoint unit root test (Sample 1994 – 2018) ... 141
Appendix 3. 19 VECM estimates ... 141
Appendix 3. 20 Additional test on structural break (ARDL 4, 3, 3) ... 143
Appendix 4. 1 Test of multicollinearity ... 144
Appendix 4. 2 Filtering system for data processing: labour underutilization ... 145
Appendix 5. 1 Dispersion of measures of labour underutilization for European countries ... 145
Appendix 5. 2 Hypothetical change in measured unemployment rate after reclassification of persons working short hours from a 1-hour minimum to 10-hour during reference week into “unemployed” or “not economically active” ... 146
Appendix 5. 3 Traditional unemployment rate among European countries (%) ... 147
Appendix 5. 4 U3 through U6 for European countries ... 148
Appendix 5. 5 Unemployment, underemployment, worker discouragement, and unavailable jobseekers for European countries ... 149
Appendix 5. 6 Unemployment, underemployment, worker discouragement, and unavailable jobseekers as a share of the extended labour force for European countries ... 150
Appendix 5. 7 Unemployment rates by education level, 2018 estimates ... 151
Appendix 5. 8 Marginally attached workers, by gender and age. OECD countries not in EU and Italy ... 151
Extended Abstract of thesis
A broader measure of unemployment by the United States’ Bureau of Labour Statistics (U6), expands the official unemployment measurement (U3) by considering a number of categories of persons who are not included in U3 either because they are not searching for job (discouraged workers) or because they are working, but under-employed (part-time workers for economic reasons). However, the U6 measure is available only for a relatively short period of time (from 1994), compared to U3 which is available from 1948. Starting from a general to specific approach, we explore the determinants of the U6 rate using the cointegrating relationship between U6 and its determinants. Due to limitation in the data availability required to project U6 backwards to the same date as the U3, we examine the cointegrating relationship between the US BLS U6 rate as left-hand-side variable and many possible explanatory variables in chapter III. We find that besides the traditional unemployment rate (U3), the confidence of consumers is significant in influencing unemployment in its extension in the United States. The business cycle also plays an instrument part in the analysis. We explored using the autoregressive redistributive lag framework including a vector error correction model of the variables exploring the short- and long-run relationship among them. We also include an assessment of the stability of our model parameters and tests of structural breaks.
Prior to chapter III, we do a critical review of the world’s hidden unemployment; i.e., the global labour underutilization. We introduce key concepts and definitions of the ILO as they relate to the study. We begin chapter IV with a cursory look at the global unemployment statistics in the world’s regions. Basing on the unemployment rate in its extension, namely the Hauser labour underutilization indicator LU4 adopted in the ILO statistics, we find that time-related underemployment, worker discouragement, vulnerable employment and informality determine much of the world’s hidden unemployment. One problem in the estimation, however, lies in data unavailability for the fact that two countries who contain much of the world’s total population, namely china and India as well as many developing countries lack the data on discouraged jobseekers. In chapter V, we extend our study to exploring further the dynamics of the extended unemployment for European countries and OECD countries. We find that business cycle influences significantly impact the total unemployment situation among European countries. And the patterns are heterogeneities associated with cross country idiosyncrasies, labour programs and policies affecting the individual countries.
Acknowledgements
Words cannot express all the joy in my heart for achieving the highest qualification in academic laurels; the qualification of a Doctor in Philosophy (PhD). I am extremely overwhelmed and happy for this success. The ups and downs of the journey has taught me an important life lesson: resilience. Like an iceberg, people are accustomed to seeing the tip of it, but I glad to be among the few who dare to see the great mass of ice that lies beneath. I dreamt, I dared, I did, and I made it!
I give thanks first to God Almighty, maker of all things, for making this dream a reality.
I express my sincere gratitude to my Thesis Advisor, Prof. Gennaro Zezza for his support and guidance that saw me through the whole research process and my studies. I owe him a great deal of thanks for his professional astuteness and kindness. I would not have completed this journey without him. I am grateful also to Prof. Anwar Shaikh who I had the opportunity to work under during my stay at The New School for Social Research in New York, USA. It was such a breakthrough and a pleasant experience. That was where I had the inspiration for the first part of work on the US – a very crucial topic worth exploring, thanks to Prof. Shaikh, and I’m glad I did.
I am grateful to my mother, Mrs. Margaret Amoasah, my father, Mr. Joseph Amoasah who I believe has been watching from afar (may his soul rest in peace). I am also grateful to my siblings for their cares and support.
I would like to say thank you to the staff and members of the University of Cassino and Southern Lazio where I submit this thesis in fulfillment to earning my degree. I thank the Italian government for the PhD scholarship award; I cannot imagine how my study would been without the financial support – I am grateful. Thank you also to the University of Naples Federico II where I attended advanced courses and seminar as part of my first year PhD training in Economics and Finance. I cannot forget the pleasant memories also at The New School for Social Research where I was visiting student during the second year of studies. Receiving tuition in n I benefitted from lectures and weekly seminars in the heterodox tradition in the state-of-the-art study university environment while working on my thesis.
I am grateful also to the Head and the members of the Department of Economics of the University of Cape Coast, Ghana, where I got the opportunity to present a chapter of my work related to the United States during the Winter break in January 2019. I benefitted from useful comments and suggestions members of staff including the HOD and the students present who were pursuing their PhD and master’s degrees.
Last, I am glad for the opportunity to attend additional seminars and summer schools during my training, thanks to the scholarship funding of the Italian government disbursed via the University of Cassino. I say thank you to the Austrian Institute of Economic Research (WIFO) for publishing my earlier work on trade liberalization from my master’s thesis (which is not a part of the study) online on the 11th FIW-research conference in International Economics in Vienna, and at Econstor.
I appreciate also all my friends and loved ones, near and far, who provided some emotional support.
Disclaimer
I am solely responsible for the content of this report as well as for any remaining errors of
List of abbreviations
CONSCONF US Consumer confidence
FRED Federal Reserve Economic Database, Federal Reserve Bank of St. Louis, U.S. Eurostat Statistical Office for European Communities
EA 19 19 countries of the eurozone (euro area) EFTA European Free Trade Association EU 28 28 countries of the European Union
ICLS International Conferences of Labour Statisticians ILO International Labour Organization
LU1 Traditional unemployment rate by the ILO, Hauser’s framework LU4 Unemployment rate in its extension by the ILO, Hauser’s framework NBER National Bureau of Economic Research of the United States
OECD Organization for Economic Cooperation and Development OLS Ordinary least squares
PRW Participation rate of females
SSA Sub-Sahara Africa
G7 Group of Seven
U3 Traditional unemployment rate for the United States U6 Unemployment rate in its extension for the United States (US) BLS US Bureau of Labour Statistics
US United States
CHAPTER I
Introduction
The study of unemployment is crucial not only with regard to the intrinsic importance of the concept in relation to labour slack but also with regard to the socio-economic implications of the idleness from joblessness. As “one cannot catch a butterfly while lying on his or her bed”, unemployment is defined to give indication of the number of persons without job who are taking practical steps within the past four weeks (or in the past month) during a specified reference period to find a job, or waiting to start a new one or on a temporary layoff looking forward to a recall. Many concerns are raised against the conventional way of assessing the labour slack. Keen followers of the measurement of unemployment observe that the indicator, measured in rate, tells only a partial story from the whole of the economic reality. A change in the unemployment rate1
could mean that people are finding jobs (hence leaving unemployment) or that they are leaving the labour force altogether due to a prolonged period of unemployment. Changes in the unemployment rate could be due to reasons that have nothing to do with (actual) changes in the employment or in the number of jobs in a country, but may be due only to reasons linked to the people’s beliefs or to their confidence in a brighter (or gloomier) economic or jobs prospects. This comes from renewed perceptions of the economic fundamentals, which causes the people to intensify or reduce their job search efforts in attempts to finding job. Conversely, changes in the unemployment rate may be due to actual increases or decreases in the job counts in the economy (affecting the
1 The conventional unemployment rate is measured as the ratio of the unemployed to the labour
likelihood of employment) which is not based on sheer beliefs, perception or on the confidence in the prevailing economic progress.
The Business Cycle Dating Committee of the National Bureau of Economic Research (NBER) of the United States, for instance, falls on a few economic indicators including the household-based employment in the economy, while assessing the date(s) of occurrence of a recession. Why the Committee falls on employment (among others) as one of the indicators of the economic activity – in assessing the dates of occurrence of a recession – but not directly on the unemployment rate even though the unemployment rate is a more popular economic indicator is a question of fact. A plausible reasoning could be that many people seem to have less doubts (or disagreements) on the employment to population ratio (a.k.a. the employment rate) than on the unemployment rate.
Statement of the problem
As one in every three of all working-aged persons does not participate to the overall world’s labour market activities (and is in fact deemed inactive), one common question is: Does the official
unemployment statistics give us a clear picture of the situation of the labour market? The answer
is always in the negative because of segments of the working age population disguised in the labour market statistics. In line with social goals such as “ending extreme poverty and promoting shared prosperity in a sustainable way [the World Bank’s mission]”, an accurate evaluation of the unemployment situation is indeed a must!
Since its inception, the concept of unemployment has not been without quibble due essentially to how it is measured. Unemployment is defined traditionally by the number of persons2 of working
2In the United States, they comprise persons in the civilian non-institutional working-age
“Non-age3 who are: (1) without work, (2) available for work, and (3) seeking work. This masks important
groups of persons who are (1) without work but (2) do not satisfy one of the remaining other conditions in its definition criteria. It also conceals significant intricacies of the realities of the labour markets pertaining to the total unemployment situation. While it is reasonable4 to
characterize unemployment using those three conditions above, it is not to say that measuring unemployment in this way is without problems. Due to its problematic measurement criteria, many authors have suggested complementing the traditional measure with broader measures. Bienefield and Godfrey (1975) identify that measuring unemployment is not spared from statistical and conceptual problems. And untapped labour resources is a problem not only because it is a waste on the economic growth and development, it is also that it causes economic distress which has substantial costs on a person’s morale, dignity, and productivity, which could induce political and social instability.
institutional” refers to persons who are not in institutions, such as nursing homes, prison inmates or those in mental institution. The BLS excludes members of the armed forces but Eurostat, for example, includes career military personnel residing in private residencies.
3 The ILO does not state what the age limit should be. For many countries, the working age is
understood to be 15 years and above, like for the ILO. Countries may adopt different upper bound or lower bound; for example, it is specified to be 16 years and above for the United States. Countries typically adopt an upper age limit, e.g. the working-age is from 15 to 64 years for the OECD. For its economic outlook, however, the OECD defines the working age to be 15 to 74 years and same age range for the labour force participation for the same report. For further information, see Sorrentino (2000) or Table of synopsis of coverage and concepts referred to in Appendix 1.1. Also see ILOSTAT spotlight on work statistics, issue n°8 – August 2019 on Persons
outside the labour force: How inactive are they really? Delving into the potential labour force with ILO harmonized estimates for details.
One primary goal of government and policy is increasing employment to the maximum possible level while keeping unemployment to the barest minimum, ceteris paribus. While (being in) employment has a more direct bearing on people’s incomes or earnings (Haugen 2009), it is suggested using “joblessness or underemployment” as a satisfactory gauge of the economic hardship since much of many people’s income come from employment (ibid, ILO 2013). What is less debated is that the unemployment rate is useful for tracking the cyclical shifts in the economy through time although it does not completely reflect of the overall hardship in an economy. Partly, this stems from the fact that the unemployment rate centers on persons belonging to the labour force without considering the whole of the working-age population. Yet, it is surprising that only a few countries, in North America and Europe, strive to provide additional labour statistics on the overall unemployment situation. The problem, while not new to the ILO, bogs down to challenges relating to the data availability for a significant number of countries.
Motivation for the study
The concept of unemployment is a fuzzy one. While useful for assessing the labour market slack, many people have expressed doubts on the aptness of a single indicator to serve as a complete gauge of the overall labour situation of countries (e.g. Bienefeld and Godfrey (1975), Jones and Riddle’s (1999, 2000, 2002), Brandolini et al (2006), Sengenberger (2011), Shimer (2012), Bell and Blanchflower (2013)). While structural factors are fundamental to analyzing unemployment in different parts of the world, much of the problem point to where there is significant degree of job non-formalism and vulnerable forms of employment; for example, in the economies of Africa, Asia, and the Americas. The measurement of unemployment, however, centers usually on the overt side of the economy relatively easy to measure in the statistics while much of what goes on in the shadow economy (i.e. the covert) is most often overlooked. Understanding unemployment in its extension for the world’s countries would help reaching a better understanding of the broader
unemployment and the nuanced labour market processes for the countries and regions. A world-oriented view of the unemployment faces serious limitation principally because two of the world’s countries with the greater share of the world’s population (namely China and India) are lacking in the ILO data on the broad unemployment rate statistics, i.e. the ILO’s labour underutilization rate LU4 (discussed later).
In this study, we assess whether the unemployment rate tells a story different from the whole and if so, how close is it from the complete story. Using statistical data available from publicly-available sources, principally the International Labour Organization (ILO) and also the World Bank, the Statistical Organization for European Communities (Eurostat), the Organization for Economic Cooperation and Development (OECD), the US Bureau of Labour Statistics, the FRED database, etc., we go into the matter of verifying to what degree a broader measure can be reproduced for countries based on the available data. With a focus on the world’s hidden unemployment, we will start (in chapter III) by assessing the labour (under)utilization in the United States, a pioneer in providing extended (broad) unemployment rate statistics. We will continue with a wholesome approach to reviewing the state of the total labour (under)utilization for the world. Complementary indicators to the measurement of unemployment adopted in the United States Bureau of Labour Statistics, in ILO statistics and in Eurostat statistics will be emphasized.
The rest of the work is organised as follows: Chapter two provides an overview of concepts and definitions, the background and relevant literature review of the study. Chapter three will look at unemployment in the United States with a special focus on the determinants of the gap between the traditional unemployment rate and an extended definition of unemployment (U6), in order to project the U6 rate – which has become available only more recently – backwards. Chapter four extends the analysis to countries across the world, with attention to investigating the overall
unemployment situation in the world. Chapter five extends the analysis to Europe and among OECD countries. We provide an overall conclusion to the thesis in the final chapter. Useful conclusions will also be provided for each chapter.
Chapter II
Overview of concepts, definitions and the nature of unemployment
In order to spell out the problems in obtaining a complete picture of the situation of the labour market in a country, it is useful to start from a logical decomposition of the population in different groups, on the basis of their activity (Table 2.1).
Table 2. 1 Decomposition of population in working age (WAP)
Table 1.1 Decomposition of population in working age (WAP)
WAP = LF + IN 15+ years Labor force LF = E + U Employed (E=RE+VPT+PTER)
Regular For pay or profit RE Part-time
(PT=VPT+PTER)
Voluntary VPT Economic reasons PTER
Unemployed (U = ULT+UST) Long-term unemployed (Unemployed over a threshold, e.g. 3
months or 6 months) Available and seeking ULT
Short-term unemployed (Unemployed for a
period less than threshold)
UST
Out of Labor Force: Inactive (IN = MA + NA)
Marginally attached (PALF=ANS+SNA)
Available not seeking ANS Seeking not available SNA Not available Not
seeking (NA=IN1+IN2+RET)
In schooling or home activities IN1 Other inactive IN2 Retired RET
Source: Author’s elaboration
The logic behind the distinction in Table 1.1 is straightforward: people may be working, looking for a job, or inactive. However, as we shall discuss in the following, when we move from a logical distinction to the problem of measuring the number of people in each group we have to rely on arbitrary assumptions and definitions, which will be translated in specific questions in the survey aimed at measuring such phenomena, and unless the definitions are shared across countries, and
everyone adopts the same questionnaire, international comparisons of employment, under-employment and ununder-employment becomes problematic.
The first decomposition is between the population in working age (Working Age Population, WAP from now on) and other persons. The “other persons” will include children below working age, and old people who have retired. As we will see in more detail below, there is no universal agreement on when people become of “working age”, and in some countries children below working age are – sometime illegally – exploited in the labour market, so that such factors have to be taken into account in international comparisons. Similarly, the retirement age varies across countries, and in many cases people above the retirement age are allowed to work. Therefore, both the lower and the upper age limits needed to define persons belonging to the WAP will depend on institutional arrangements, habits, etc., and need to be harmonized for international comparisons. In the next logical step, the population in working age is split between the Labor Force (LF) and the inactives (IN), where the LF is composed of the employed (E) and those looking for a job: the unemployed (U). While the inactives can be defined residually, both the Employed and the Unemployed require an exact definition in order to be counted. Are you employed if you worked for only one hour last week, but you currently have no job? Are you unemployed if you would like to work, but you are not searching for a job every day? If two countries have the same number of employed people, but in the first country everyone has a full-time job at 40 hours per week, and in the other country half of the employed have part-time jobs at 20 hours per week, is employment the same in both countries?
It is clear that international comparisons for labour market statistics require a harmonization of such concepts, which has been achieved, and modified from time to time, in International Labour Conferences (ILC) and International Conferences of Labour Statisticians (ICLS) organized by the
ILO. ILC Conventions “are legally binding instruments for countries that choose to ratify them”:5
two such conventions have taken place, in 1938 and 1985. ICLS are organized every year, and produce international guidelines, which are not legally binding. Labour market statistics across countries therefore follow the same principles, but do not necessarily adopt the same definitions for identifying each sub-group of the active population.
For our purposes, it is useful to introduce some further sub-groups in the Employed, Unemployed and Inactive categories, that will be discussed in more detailed below.
Among those classified as Employed, we will distinguish those who have a part-time job, but would like to work more hours, usually defined as Part-Time for Economic Reasons (PTER). This is not an exhaustive measure of under-employment since, for instance, people may be employed full-time for a job for which they are over-qualified. There are many other cases where labour is not allocated efficiently (as it is often the case in rural areas in developing countries), but measures of these type of under-employment are difficult to obtain comparatively across countries and will not be considered here.
The current definition of unemployment requires that the person should be actively searching for a job and be available to work immediately. This rules out people who are available for work but have not searched for a job in the reference period, that we will label as Available Not Seeking (ANS), and people who are actively looking for a job but are not available to work immediately, that we will label as Seeking Not Available (SNA).
While most countries run surveys aiming at measuring the level of employment and unemployment, the measurement of the other categories requires specific questions to be introduced in a survey, which have been implemented only recently in North America and Europe, and are missing for many other countries.
In the following sections we will provide a further discussion of the problem, along with more details on the different measures obtained by the institutions producing statistics on the Labour market.
Definitions by the International Labour Office
By activity principle, the ILO defines the labour force6 as consisting of the employed (engaged in
economic activity even if for one hour) plus the unemployed. In determining the labour force, the ILO gives precedence to employment over unemployment in accordance with its priority rule. Employment is defined in relation to activities performed for pay or profit or for use by others. In its definition, the ILO does not provide any specifications on the job quality (ILO 2019) neither does it provide a lower bound on the number of job-hours or the job-activities required to be deemed in employment.7 Needless to say, a decrease in the unemployment rate does not amount
necessarily to an increase in the employment rate and vice versa, the reason being that the employment-to-population ratio (a.k.a. the employment rate) is the proportion of working-age
persons employed while the unemployment rate is the proportion of the labour force who are
unemployed. Likewise, low unemployment rates do not necessarily coincide with high employment rates. This is because the unemployment rate excludes other persons irrespective of
6 The labour force is also referred to as the economically active population. I submit that the term economically active population is a misnomer because it is sometimes confusing to the lay man
for having unemployed persons as a subset of persons in them.
7The ILO standard does not set a minimum threshold on the number of hours of job activities to
be classified as employment but recognizes that countries may prefer to set one. For example, Canada adopts no threshold in the minimum number of hours if engaged in unpaid family work, but the United States has a 15-hour minimum if a person works as unpaid family worker. See Sorrentino (2000) or Table of synopsis in the Appendix 1.1.
whether they had desired and are willing or available to take up employment opportunities if they came up and if they had in fact looked for or sought job but over four weeks (i.e. the reference period set by the ILO).
High employment rates do not always correspond with higher well-being. High incidence of vulnerable job activities, for instance, increases employment but says nothing about people’s income(s) from employment or their level of satisfaction derived the job. In effect, vulnerable job activities increase the total labour force (i.e. the denominator for computing the unemployment rate), implicitly reducing the unemployment rate. The reason follows intuitively: many people are employed but in less- or undesirable jobs. A low unemployment rate, therefore, often a delight to hear, does not give enough or rich information to its audience about essential traits that define a job, such as the level of social protection that comes with it, how formal the job is, or the degree of autonomy or flexibility inherent in the job. These are contained in broad social goals of the United Nations termed Sustainable Development Goals (SDGs8) intersecting with the objectives
of the ILO.
The unemployment rate is influenced by (1) changes in (ins and outs of) employment, (2) changes in unemployment, and by (3) changes in the labour force participation. This blurs the distinction between two important groups – the unemployed (in the labour force) and the jobless out of the labour force. Unemployment, however, is not the exact complement of employment. The potential
labour force is an important gap between members of the labour force and persons out of it.
Persons belonging here are not necessarily unproductive as they may be engaged in some forms of activities such as volunteering, producing for own-use or in training without pay, which are worth the while in undertaking them or for the time being. These activities are indeed valuable
8 See ILO 2013a or ILO 2019d. Also see
undertaken by those persons out of job but by the nature of those activities, do not make those persons to be deemed in employment (though not be idle). Nevertheless, persons out of the labour force are deemed “economically inactive” and were previously actually referred to by that phrase term by the ILO (ILO 2019b). Like members of the labour force, persons out-of-the-labour force9
do vary by gender, age, race, and geographical boundaries.
Among persons out of the labour force, there is a “potential available labour force” who are mainly (i.e. by their numbers) persons “available for job but not seeking”, a.k.a. “discouraged jobseekers” by reason of (they) being discouraged from the labour market prospects. Unsuccessful past tries basically cause them to believe in such ‘gloomy’ predisposition that there are non-existent job opportunities. Not all inactive persons are discouraged; the complement to this group (i.e. among persons “out of the labour force” or the “inactive”) represent persons “seeking but not available”, relatively smaller in number than the discouraged. “Seeking10”, according to the ILO and for the
purpose of this study, is defined as looking for job within a four-week relevant reference period. In any case, it is inferred from the intensity of search such as one deemed capable of landing the job seeker onto a job if available. Due to prevalence of information technology today, the definition of what goes into a search activity has become numerous as newer modes of assessing information add to the already accessible modes each day.
9 See ILO 2019b.
10 Looking or seeking is defined by making job search effort. Examples of search activities include
making contacts in employment offices, conducting internet search, sending out resumes, etc. Some search efforts are more passive while some are active. The ILO standard (and that of the United States) is based on active search while Canada and Europe require any kind of search even if passive (e.g. just looking at internet ads). All two modes of search adopted by individual countries are sanctioned by the ILO.
In less formalized economies, a significant number of persons “looking but not out of work” blur the distinction between who is active (in the labour force) and who is not i.e. out of the labour force (ILO 2013b, Sengenberger 2010; Howell 2004). While unemployment rates are relatively low in less developed and low-income countries, the overall joblessness in those countries is much higher. In developing economies, apart from low job creation capabilities hence lower employment opportunities (compared to the developed countries) there are information bottlenecks. For example, in many less developed countries and regions of the world, employment office services are usually non-existent, and literacy rates low while in the developed countries, not only is there adequate infrastructure for job searching (notably the services of jobs centers and employment offices). The services of these employment offices are more organized, making them more capable in linking up peoples with jobs. The unemployment statistics of developed countries against the developing counterparts therefore reflects this upward bias as job opportunities and job-searching-and-finding assistance imply greater incentives for searching by the unemployed and the remaining other jobless persons (i.e. discouraged jobseekers). While it makes sense to suppose that a time span of four-weeks (or one month) period is reasonably indicative of active job search, it is questionable to say that persons available and searching but beyond the short reference period are inactive. We submit that the ILO’s yardstick of one-month reference time for “seeking” is too tight because many persons insofar as they do not suffer any incapacity would want to work but are not able to do so due to reasons of economic nature. “Discouragement” sets in when the persons have made reasonable search efforts but found no job. Then, they decide to “relax” or give up the search altogether. Likewise, not all non-working persons ‘conventionally’ termed “discouraged” are “actually discouraged”. That is, although they are without work (and may not be seeking), they are not reluctant or adamant in their desire to embrace employment offers should they come up, and may in fact be as determined as the “unemployed”.
Not only does unemployment vary across time and regions, it results from a combination of frictional, structural (including technological), cyclical, seasonal, and hidden forces influenced by broad fundamental, systemic and idiosyncratic factors affecting the individual countries. The conventional measure captures a mix of these forces at work in influencing the joblessness. Information flow adjusted for labour market imperfections determine the likelihood of finding and filling up job vacancies by prospective job seekers. In the matching model, frictional
unemployment is the residual of the interaction between employers and employees. Some of the
determinants of unemployment are rather long-term in nature, correlated with the strength of the economic fundamentals of the countries, referred to as structural unemployment. There are also trends in employment and unemployment which comove with the ups and downs of the business cycle popularly known as cyclical unemployment. Yet, in crisis or no crisis, the traditional unemployment rate is said to be a potent indicator of the abundance or not of jobs. While employment is deemed procyclical, unemployment could be both countercyclical and lagging in nature. The average hourly earnings, the level of employment, the number of hours of work and the degree of productivity, however, are procyclical, responding favorably in good times but decreasing in bad economic times such as during recessions. On the converse, unemployment and work disguised in the shadow economy are countercyclical, going up during ailing economic times. Apart from rises and falls in unemployment, documented historical trends indicate that economies’ growth rates are punctuated by recessions in different points in time11. While this is
well-documented for the United States and Europe a recent study affiliated to the World Bank notes, for instance, that cyclical fluctuations in real GDP per capita explains about one-half (or 48%) of the variability in the world’s unemployment and about three-quarters (or 74%) for countries of Latin America and the Caribbean (LAC) (Vegh et al, 2019).
While different (broad) unemployment rate measures are useful for cyclical analysis, the officially measured rate is, nonetheless, “the most objective overall best cyclical indicator of the labour underutilization” (Haugen, 2009). Nonetheless, the impact of the financial crises impact on the shadow economy adversely affects official countries’ output and unemployment, as workers are displaced from the formal to the informal sectors of the economy (Martin, 2000; Abdel-Latif et al, 2017). Moreover, while fluctuations in unemployment happen with or without crises, marked increases in unemployment become magnified during times of recession, e.g. in the most recent global economic crisis of 2008. Also enlarged are the discouraged jobseeker phenomenon and time-related underemployment (a.k.a. involuntary part-time). For the countries that measure the unemployment in its extension using broader measures (such as the United States), we observe increases in the gap between broader rates of unemployment and the traditional measure during recession. Last, there are seasonal fluctuations correlated with unemployment over time such as over periods of one year or during certain quarters or months. One way of adjusting for the seasonal fluctuations in the statistics is performing standard procedures imbibed in modern statistical software packages (such as the X-12 procedure in EViews, for example).
Measurement of broader rates of unemployment
Beyond the employed (E) and the unemployed (U), when we collect data on persons available for
employment but not seeking (ANS) a.k.a. discouraged workers, persons seeking employment but not available (SNA), and underemployed part-time workers for economic reasons (PTER), we can
construct alternative measures of labour underutilization for countries. The sum of E and U make up persons in the labour force (LF), referred to as economically active population. The complement of the economically active population is the economically inactive population. Economically inactive persons are persons out of the labour force (POLF), consisting of potential additional
labour force (PALF) deemed marginally attached to the labour force (MA). PALF is the sum of ANS and SNA. The sum of LF and MA gives an extended labour force (ELF). The PTER (in E) and the MA (or PALF) make up an additional pool of labour which give supplementary indication to unemployment. PTER is defined with respect to a person’s willingness to work more hours if offered the opportunity to do so within the next two weeks of the specified relevant reference period of the labour survey. Stated elsewhere, while the sum of E and U equals LF, the sum of the employment rate (e) and the unemployment rate (u) does not equal unity. This is because e is E expressed as a percentage of the working age population (WAP) while the u is U expressed as percentage of LF, i.e. the two variables are computed using different denominators, the former being larger than the latter.
A short history of statistics on the labour market
The world’s unemployment statistics is facilitated by the ILO, aided by the periodic provision of guidelines, resolutions and recommendations to the labour statistics and practices. Prior to the 1940s, the practice of collecting labour statistics is perceived to have been in existence somewhere in France around the late 19th century (Sengenberger 2010) and around the same time (i.e. in 1890)
in the United States (Card 2011). A systematic collection of unemployment statistics is documented to have emerged from the United States through periodic household survey presently known as the Current Population Survey (CPS12) of the US BLS. Beginning in the 1940s, the
practice became the custom for other countries to follow suit (Haugen, 2009).
12 The CPS is a sample survey of about 60,000 eligible households selected to represent the entire
U.S. civilian noninstitutional population. On the basis of responses to a series of questions on work and job search activities, each person of working age, i.e. 16 years and over in a sample household, is classified as employed, unemployed, or not in the labor force.
From ancient and medieval times through the periods of industrial revolution to date, work has played vital part in the livelihood of man. The Industrial Revolution in the second half of the 18th
century brought several innovations to manufacturing process, and the prevailing production methods received the introduction of newer technologies as at the time. The period, however, coincided with a rapid population growth. As more people means many mouths to feed, many jobs were required to make their livelihood sustainable. The 19th century German economist and
philosopher, Karl Marx, understood as at the time and postulated that a greater level of population creates a surplus in the labour supply which he refers popularly to as a “reserve army of labour”. In Marx’s view, where the supply of labour exceeds its demand, the excess pool in the labour supply (i.e. the reserve army) would exert a downward pressure on the wages capital owners (a.k.a. bourgeoisies) are willing to offer the suppliers of the firm’s labour input to the production process (referred to as proletariats) in order to maintain the capitalists profit margin. The logic of Marx’s analysis seems to hold true even today particularly among developing countries13. A substantial
13 According to Levrero, Marx's theory of the industrial reserve army as used here is not so
straightforward and holds true only when it is (mistakenly) assumed that wages are set necessarily at a subsistence level. See Levrero (2013a and b) for a critique of the idea. Shaikh puts it this way: “Like the real wage, the rate of unemployment also has two sides. From the point of view of workers, it is the gauge of the relative demand for their capacities. As such, it plays a critical role in the economic life of a nation. But the unemployment rate is also a key factor regulating the strength of the link between productivity growth and real wages: the higher the unemployment rate, the weaker the strength of labor vis-à-vis capital, and the less likely that productivity growth will be associated with real wage growth. This is not only because persistent high unemployment weakens the relative bargaining position of labor but also because it erodes the institutions that support labor”.
part of the problem is linked to organizational informality of enterprises as well as in vulnerable forms of employment that abound in developing countries14.
Informality in employment
In 2016, about 2 billion people were in informal employment and by shares, 77% and 59% of youths and of adults respectively. Whereas a majority of informal employment (80%) are in the world’s developing communities, employment in the informal sector is characterised by jobs which are less decent, of low productivity, less income and high risk to poverty than jobs of formal nature (ILO, 2018c). Observed evidence exists for hidden unemployment in developed countries also. Howell (2004) (also cited in Sengenberger 2011) observes, for instance, that a majority of youth (ages 20 to 24) in Spain and Italy (89 and 87 percent respectively) live with their parents and although they may be engaged in family businesses, “they see themselves as not in ‘real employment’” (ibid, pp 83 – 84, Howell, 2004). In a vein similar to saying that the unemployment rate is relatively low among low-income countries but does not imply a high economic welfare in those regions (ILO, 2009), the unemployment rate about some developed countries may be underestimated or confounded as illustrated by Spain and Italy.
The labour market in Europe, for instance, is said to be less flexible and job tenure more secure compared to the United States’ linked to difference in the labour market institutions and the labour
14 For the purpose of simplicity in the analysis, we limit it to developing countries and we do not
to take into account the supply of labor in a complex relationship with wages in developed economies which is highly elastic with respect to labor demand.
law rigidity15. Consequently, European economies lag behind the United States in terms of the
structural capacity to creating jobs in both economies16. Sengenberger (2011) links this basically
to the labour markets’ responsiveness to incentives. This results in a dichotomy between mainstream economics versus heterodox summarized as follows:
From the viewpoint of Keynesian economics, limited or absent social protection engenders “disguised unemployment” so that measured unemployment in countries with low levels of protection is underestimated. This view turns around the position of neo-classical economics according to which social protection raises the unemployment level… As early as 1937, Joan Robinson argued that the failure to provide unemployment compensation will lead to “disguised unemployment”, defined as the absorption of workers in low productivity jobs, either because these jobs are protected [from product market competition. WS] or, more typically, because no other means of subsistence are available - Sengenberger 2011.
Over 60% of employees derive their livelihood from the informal economy (ILO, 2018c). This manifests in three ways: in enterprises in the informal sector, employment in the informal sector as well as in informal employment (ILO 2013, Fleck & Sorrentino 1994). A high prevalence of vulnerable employment restrains persons in unemployment from holding on their zeal when their desired job opportunities are not forthcoming. Akin to “forcing the lion to eat grass or go hungry”, the people in low-income economies must struggle to make ends meet at all cost as they resort to the shadow economy for jobs when the jobs are not forthcoming from the open economy. In most
15 See detailed description of employment protection legislation, 2012-2013 OECD countries at
https://www.oecd.org/els/emp/All.pdf
16 We do not neglect the contribution of fiscal and monetary policies to job creation in the two
of the case, the employment in these deprived regions lack social protection, e.g. replacement incomes, unemployment benefits, social security benefits, etc., depriving the workers of insulation from income losses when jobless they become (ibid) say, for 6 months or 1 year (i.e. long-term unemployed).
Prominent Institutions - The major statistical organizations
International Labour Organization (ILO)
The ILO serves as the United Nations specialized agency on labour, decent work and related statistics. With data coverage on close to 200 countries, the ILO is the most authoritative source of international labour statistics, providing comprehensive statistics on labour across the world. Major world’s statistical organizations look at different countries pertaining to their statistical territories. However, because they differ in goals, their statistical scope and country-coverage differ also. The reason is not far-fetched. The overall assessment of the world’s labour (under)utilization fits best the goals of the ILO. With a global perspective and statistical jurisdiction17, the ILO as mother organization of the labour statistics, provides the needed
statistical guidelines to the other organizations interested in specific regions, e.g. the OECD, Eurostat, etc. and to individual countries. Needless to say but for emphasis, the interest of the OECD does not completely intersect with that of Eurostat, neither is their statistical scope and coverage the same. Besides, the statistical interest of individual countries may go beyond the ILO
17See a recent report of ILO’s ILOSTAT Spotlight on work statistics no 8 – August 2019 dubbed
“Persons outside the labour force: How inactive are they really? Delving into the labour force with ILO harmonized estimates”.
to looking at additional groups of persons (marginally) attached to the labour force (e.g. the extra statistics in the US BLS or Canada’s mentioned a couple of times).
Labour underutilization measures adopted by the ILO
The ILO18 urges countries to provide statistics on “headline indicators of labour underutilization
(from among LU1, LU2, LU3 and LU4) for the population as a whole, by sex, by urban/rural areas and, to the extent possible, by broad levels of educational attainment and by standard age ranges” (ILO 2013b p.64). The different measures of labour utilization are provided in line with “… producing headline indicators for labour market monitoring… that can be used with other indicators relating to the labour market such as skill-related inadequate employment and income-related inadequate employment as per the relevant international statistical standards” (Report of the 19th ICLS, 2013b).
It is more straightforward and easier using the ILO estimates to assess or compare countries’ unemployment rates. The big challenge is to measure unemployment in its broad definition for many countries across sufficient time periods. ILO statistics provides some measures of labour underutilization from LU1 through LU4, organized from narrow to broad, referred to in the Hauser’s labour underutilization framework (Table 1.2). Different categorizations of the utilization of labour are needed to properly take care of different groups of non-working persons (Elmeskov & Pichelmann, 1994; Sorrentino (1993, 1995), Gray et al, 2005; Brandolini et al, 2006; ILO, 2008; Tronti & Gatto, 2012). However, consulting statistics of different categories of labour underemployment leads to overlap which we could avoid by resorting to a formula that integrates multiple statistics into a single indicator. This evades the difficulty as to which denominator (e.g.
18 See the ILO Room Document 13, 18th International Conference of Labour Statisticians. Also
the labour force or the total working age population) to go by. It helps also to attain better harmony in the statistics; hence, ease of comprehension and comparability of the measures (African Development Bank 2012). This presents a convincing case for adopting indicators such as the Hauser’s underutilization framework for analytical purpose.
In the present study, we will adopt the Hauser’s broadest measure known as Labour Underutilization rate LU4 against the tradition unemployment rate LU1 (later) to explain the determinants of the gap between them. LU4 is a composite rate composed of three ingredients, (1) the total traditional unemployment, (2) total part time unemployment and (3) the total potential labour force (i.e. made up of the persons available for job but not presently seeking termed discouraged job-seekers, and persons seeking job but not presently available, stated earlier). Where the statistics are provided in modelled estimates and in national estimates, the ILO modelled estimates are preferred over the national estimates for purpose of international comparability. The ILO modelled estimates adjust for differences in the national statistics correlated with the individual countries by applying some econometric techniques to the nationally sourced data. The ILO also identifies and provides data for time-related underemployment. “Underlying regional differences, the level of economic development is clearly an important factor: in 82 per cent of low-income countries with available data, the time-related underemployment rate is larger than the unemployment rate” (ILO 2019a). Among the employed, persons in time-related underemployment19 are engaged in part-time not by their own choosing but due to reasons of
economic nature. Given the opportunity, these persons would like to work some more hours. Categories of part-time employment are based on labour survey questions, determined by the usual working-hours of the employee or on a benchmark number of hours (e.g. 35 hours or less than
19 The time-related underemployment rate is computed as persons in time-related
full-time working hours). In other words, while the ILO measures some other forms of part-time employment, for example, by a stated threshold of working hours, let’s say 35 hours or using some other standard criteria say a certain number of hours less than full-time working hours among the countries we refer to time-related underemployment in this study when mention is made of part-time for economic reasons. Thus, part-time-related underemployment is one category of the ILO statistics based on people willing to work more than they are presently engaged.
The ILO further recognizes three other sorts of underemployment, namely skill-related underemployment, income related underemployment, and inadequate employment20. Inadequate
employment situations encompass persons within the labour force who believe they could be more adequately employed, utilized or compensated than their current employment situation. Persons in
skill-related underemployment lack the required skills for the available jobs or are essentially
underqualified. On the other hand, workers may meet more than the required qualification for the job which they are presently engaged (i.e. over-qualified) and this also constitutes skill-related underemployment. Persons in income-related underemployment, believe that given their qualification, they should receive a remuneration higher than their present remuneration whereas persons in inadequate employment work excessive hours than what is deemed normal (see for example Africa Development Bank, 2012; ILO 1998, ILO 2013b).
20 See Resolution concerning the measurement of underemployment and inadequate employment
situations, adopted by the Sixteenth International Conference of Labour Statisticians (October 1998). Also see Appendix 1.2 for schematic presentation of operational definitions of Hauser’s labour underutilization framework.
Table 2. 2 Overlapping measures in the Hauser’s underutilization framework
Measure Indicator Calculated as Dispersion for 58
countries with data (latest year
available*)
LU1 Unemployment
rate
LU1 = [persons in unemployment / labour force] x 100
Mean = 7.7 Median = 6.1
LU2 Combined rate of
time-related underemployment and unemployment
LU2 = [(persons in time-related underemployment + persons in unemployment) / labour force] x 100
Mean = 13.5 Median = 12.1
LU3 Combined rate of
unemployment and potential labour force:
LU3 = [(persons in unemployment + potential labour force) / (extended labour force)] x 100 Mean = 12.3 Median = 10.1 LU4 Composite measure of labour underutilization:
LU4 = [(persons in time-related underemployment + persons in unemployment + potential labour force) / (extended labour force)] x 100
Mean = 17.8 Median = 15.4
Sources: Indicators, draft resolutions sections 57 – 63 (19th ICLS, 2 - 11 October 2013) and ILO, 2018b. *Spotlight on work statistics ILO, 2018b. Note: As the components of the LU4 are the same
as the US BLS’s U6 rate, its computation arrives at a value equivalent or close to the US U6 rate.
The Statistical Office for European Communities (Eurostat)
The statistical office for European communities, Eurostat, is the principal statistical database for the labour market among European countries available online. Its data covers 28 countries of the European Union (EU28, including the United Kingdom which had been in process of exiting the Union since June 2017). The statistics include 19 countries of the euro area (eurozone). The coverage is presented as aggregates for EU28 and EA19 and for the individual countries and includes a few non-member countries of the Union or of the EFTA, e.g. US, Japan, etc. in few instances toward international comparability of the unemployment statistics. It extends to include
“underemployment and potential additional labour force statistics21” available from 1983, largely
inadequate, however, for many of the countries prior to 2008. The statistical definitions22 of
Eurostat are based largely on the ILO’s, which is based on periodic resolutions of the International Conference of Labour Statisticians and amended accordingly from time to time. Data are collected from periodic survey of the citizens in private households referred to as the European labour force survey.
According to the specific Eurostat’s definitions, an employed person is a person of working age (age 15 and above, or 16 and above in the case of Iceland and Norway) who during the reference week worked for at least one hour as employee, for self or family; for remuneration or reward in the form of cash (e.g. pay or profit) or kind (e.g. family gain); or is temporarily not at work due to illness, holiday, vacation, industrial dispute, education, training, etc. during the relevant week. An unemployed person is a person from 15 to 74 years (or 16 to 74 years for Italy, Spain, the United Kingdom, Iceland, and Norway) who within the relevant reference week is without work, available for work (within two weeks, or has already found a job to start within the next three months); and has actively sought work during the last four weeks.
The Organization for Economic Co-operation and Development (OECD)
In 1993, the need for complementing the OECD statistics with additional indicators had become strong, and by 1995 the OECD Employment Outlook had looked to additional measures of the labour slack. Discouraged workers and involuntary part-time had been presented in one article which represented the parallel of the US BLS complementary measures of unemployment which
21 For a recent article on this, see
http://ec.europa.eu/eurostat/statistics-explained/index.php/Underemployment_and_potential_additional_labour_force_statistics
http://ec.europa.eu/eurostat/statistics-had been introduced in 199523 (Bednarzik & Sorrentino, 2012). While the OECD depends on
Eurostat for unemployment statistics of member-countries (and the countries’ aggregates) which are European, including Iceland Norway, Switzerland (EFTA members) and Turkey, the OECD collects the data and calculates the unemployment rates for the rest of its member-countries24.
The OECD, like Eurostat, derive statistical guidelines on labour from the ILO. According to recent OECD estimates,25 the labour underutilization rate as percentage of the labour force is highly
positively correlated with the unemployment rate (a correlation coefficient of 0.88). The correlation between long-term unemployment and the normal unemployment is a higher of 0.95 for the member countries, the majority of which are European. However, there is a negative relationship between the unemployment rate and job creation, between the unemployment rate and the participation rate as well as between the employment rate and the unemployment rate (OECD, 2017). According to Elmeskov et al., “the fall in participation rate in the 1960s among OECD countries may result from school attendance, rising real incomes leading to increased demand for leisure, increase in the coverage as well as in the generosity of tax-financed public pension schemes. However, the subsequent rise in the aggregate participation rate from 1970 can be fully accounted for by the increase in female participation, shift cultural norms, developments coinciding with increased availability of publicly-financed day-care institutions, changing traditional family roles of women, reform of tax systems, including a shift from the family to the individual as the basic income tax unit” (Elmeskov et al (1994). The inverse relationship between unemployment and labour force participation is quite natural. Unemployment rate is not low for
23 See Bregger and Haugen (1995).
24 See Methodological Notes, OECD Harmonized Unemployment Rates News Release (December
2018) at https://www.oecd.org/sdd/labour-stats/44743407.pdf
reasons linked to the structural pointers of the labour market only, positive beliefs and sentiments in the labour market driven by a confident economic outlook by the workforce participants increases their participation while and a negative outlook induces the converse. Among select OECD countries, hidden unemployment represents untapped labour resources which can be explained by their economic growth and labour market policy reforms (Agbola, 2005).
Figure 2. 1 Employment quantity and labour market slack (201526)
26 See OECD Employment Outlook 2017. Notes: a) Employment rate in full-time equivalent units
is defined as employment rate of the working age population adjusted by a ratio of average usual weekly hours worked by all workers and average weekly hours worked by full-time workers (according to national definition of full-time employment).b) The labour underutilization rate is defined as the combined number of persons who are unemployed, marginally attached (i.e. persons not in the labour force who did not look for work during the past four weeks but who wish and are available to work) or underemployed (full-time workers working less than usual during the survey reference week for economic reasons and part-time workers who wanted but could not find full-time work), expressed as a percentage of the labour force.
Note: Correlation coefficient is statistically significant at 0.1% level (***), at 1% level (**) or at 5% level (*). Data for the OECD are weighted averages.
Source: OECD calculations based on labour force survey results for labour underutilization:
www.oecd.org/employment/emp/onlineoecdemploymentdatabase.htm
The fact that the employment rate and the full-time equivalent employment rate is highly positively correlated but the annual hours worked and the employment rate negatively correlated is a reasonable indication of labour slack among the countries. Besides, this confirms that the employment rate alone although providing a useful accompaniment to the unemployment rate, suffers a limitation inherent in the definition of employment based on the one-hour criterion. Nevertheless, the two indicators provide useful analytical companionship to the data user.