Abstract
Access to credit is among key elements for improving agricultural production and poverty re-duction. Credit can facilitate farm households to purchase the needed agricultural inputs and enhance their capacity to effect long-term investment in their farms. Despite this importance, the majority of farm households lacks access to formal credit. This study therefore was con-ducted in order to create knowledge of the factors that determine access of rural households to formal credit in Zanzibar and to establish the linkages between access to credit and the adop-tion of agricultural technology under the Zanzibar smallholder farming condiadop-tions.
Conceptually, access to credit can be influenced by institutional factors and household charac-teristics. Analyses of factors at the household level is therefore important to design strategic interventions aimed at deepening financial services through rural households in Zanzibar. In conducting this study, both primary and secondary data were collected. The data collection took place between May and June, 2006, covering the five districts of Unguja and Pemba lands. The districts involved in the study were North ‘B’, West and Central (for Unguja is-land) and Wete and Chake Chake (for Pemba isis-land). In total 750 households were surveyed. Secondary data were collected from relevant institutions, including existing financial institu-tions. The analysis of data collected was done descriptively as well as econometrically using STATA 10.0 and SPSS 13.0 computer softwares.
The main findings of the study suggest that a number of socio-economic factors are impor-tant in influencing farm households’ access to formal credit. These factors are: the number of accesses to credit, the possibility of keeping livestock, having a bank account, the value of productive assets owned, household income and the intensity of adoption of agricultural
1 The contents of this article were first presented in the poster session of the “BoulderBer
gamo Forum on Access to Financial Services: Expanding the Rural Frontier”, organised in Ber -gamo-Italy by the Boulder Institute of Microfinance and the University of Bergamo on Septem-ber 18-20, 2008.
2 Ministry of Labour, Youth, Women and Children Development, P. O. Box 884, Zanzibar,
Tanzania Sokoine University of Agriculture, P. O. Box 3000, Morogoro, Tanzania. Email: [email protected] or [email protected].
technologies. As regards factors determining farming technologies adoption, extension con-tacts intensity, household size, number of accesses to credit, and value of productive assets were found to significantly influence the adoption of agricultural technologies. However, with the exception of the number of accesses to credit, these variables were significant only for the non-credit constrained households and not for the credit constrained households. These results suggest the need for targeting credit interventions to farm households who are credit constrained for improving access to credit and the adoption of agricultural technolo-gies.
1. INTRODUCTION
Most developing countries continue to rely on their agricultural sectors for economic growth, poverty reduction, and food security. In Zanzibar, agri-culture contributed 30 percent to Gross Domestic Product in 2006 (GOZ, 2006). Although the sector contribution to the GDP exhibits a declining trend, agriculture still remains important to the majority of the Zanzibar population, particularly those living in rural areas. About 42 percent of the households in Zanzibar are directly engaged in agricultural activities for their income earning (GOZ, 2006). However, the majority of these farming households are categorized as smallholders with landholding of less than 1.2 ha (GOZ 2004).
Recognizing the importance of the agriculture sector to the Zanzibar economy and welfare of the majority of Zanzibar people, the Revolutionary Government of Zanzibar has placed a lot of emphasis on the role of credit and agricultural technology to increase agricultural productivity and house-hold income. The adoption of agricultural technology is regarded as a key el-ement for increasing productivity and production in the agricultural sector. However, to undertake productive investments in agricultural technology, smallholder farmers require sufficient access to financial capital. In Zanzibar, accessing subsidized credit to farm households has therefore been a long time policy option meant to financially empower farmers to purchase the needed technological inputs to increase productivity (GOZ, 2002). Special-ized credit schemes were therefore established by government in collabora-tion with various donor agencies and non-governmental organizacollabora-tions to promote the adoption of specific agricultural technologies. The government also undertook reforms in the financial sector since 1991, by liberalizing the financial sector in order to increase the outreach of the formal financial serv-ices to the farming communities.
2. STATEMENT OF THE RESEARCH PROBLEM
The reforms and liberalization of the financial sector in Zanzibar were aimed at increasing the deepening of the formal financial services and ad-dressing the need of the emerging private sector and household economy. This being the case, the outcomes of the reforms were expected to be an in-creased outreach of formal financial institutions and an enhanced access to formal financial services by the majority of people, both in urban and rural areas. Despite these efforts, the majority of smallholder farmers still lack ac-cess to formal credit. Smallholders’ acac-cess to financial services is important for the adoption of improved farming technologies. So lack of access to credit constrains farmers to adopt recommended technological packages, which result into low productivity and production and hence low income of farm households. This poses a serious challenge to the effort to reduce poverty.
Recognizing the increasing marginalization of poor farming households with respect to access to formal credit and the constraints that smallholder farmers are facing in accessing the required capital for farming technologies adoption, various policy options are adopted and implemented with the aim of filling the financial gap created by the liberalization of the financial sector. The government has been taking deliberate efforts to encourage the existing commercial banks to open up micro-finance windows to serve the poor. This has been done by establishing credit guarantee schemes and by relaxing bank lending conditions. In addition, the government has been creating a fa-vorable policy and legislative environment to encourage the establishment of Micro-finance Institutions (MFIs) and to mobilize members of communi-ties to establish Savings and Credit Cooperatives (SACCOS).
Despite these efforts, commercial banks still confine their financial servic-es to the low risk urban based customers and fail to realize the huge poten-tials by accumulating savings and lending to rural small borrowers. The MFIs, whose mission is to bridge the gaps between small clients and banking institutions, are found to be weak, fragmented and with limited scope and outreach. This continued overall inefficiency of the formal financial markets, which seem to have increased despite the financial reforms, make the fight against poverty reduction even more challenging. The existing inadequacy of the formal financial markets therefore continues to constrain rural devel-opment as potential households’ savings remain untapped and profitable ru-ral investments remain largely unfunded.
Although there are segments of evidence of poor performance of the for-mal financial markets with respect to accessing forfor-mal credit to the poor
farming households, no study has been carried out to substantiate the argu-ment. Moreover, no study has been carried out in Zanzibar so far, identify-ing the farm households’ socio-economic factors that influence their credit access constraint condition in the formal credit markets. Also the inter-link-ages that exist between access to formal credit and the adoption of agricul-tural technologies by smallholder farmers have not been explored. Under-standing the extent farm households have accessed formal credit markets and factors, which influence them to be credit constrained, is therefore rele-vant and is an important step towards improving access to credit for the majority of the population. Similarly, understanding the inter-linkages be-tween access to credit and technology adoption will shed light to the kinds of interventions that are needed for the credit access and non-credit access of constrained farmers to improve agricultural technology adoption. Thus this study is an attempt to fill the lack of knowledge and help policy mak-ers and rural development plannmak-ers in making informed decisions to im-prove rural development and achieve the country poverty reduction tar-gets.
3. STUDY OBJECTIVES
The general objective of this study is therefore to establish to what extent smallholder farmers in Zanzibar have accessed credit from formal credit in-stitutions and to assess its effect on the adoption of agricultural technologies. The study is guided by some key questions such as: (1) How many farm households in the sample have access to formal credit markets? (2) How many households are credit constrained? (3) What factors contribute to farm-ing households becomfarm-ing credit constrained in the formal credit markets? (4) Is there a linkage between access to credit and the adoption of agricultural technologies?
The specific objectives of the study are as follows:
• Assess the outreach of existing formal financial institutions.
• Examine the influence of household socio-economic characteristics in ac-cessing formal credits.
• Assess the effect of access to formal credit on the adoption of agricultural technologies under smallholder farming conditions.
• Recommend on policy aspects regarding the approaches and strategies to improve access and the effectiveness of formal credit in smallholder agri-culture in Zanzibar.
4. STUDY HYPOTHESES
• There is limited accessibility of formal credits in rural Zanzibar and smallholder farmers who are relatively poor tend to be marginalized. • Socio-economic characteristics of smallholder farmers influence access to
formal credit among smallholder farmers in Zanzibar.
• Access to formal credit affects positively the adoption of agricultural technologies among credit access constrained and not among the non-credit access constrained smallholder farmers.
5. CONCEPTUAL FRAMEWORK AND RESEARCH METHODOLOGY 5.1 Conceptual framework
The overall objective of this research work is to create knowledge on the factors that determine smallholder farmers’ access to formal credit in Zanz-ibar on the one hand, and establish the inter-linkages between access to cred-it and the adoption of farming technologies on the other. Thus, the conceptu-al framework of this research centers on access of farm households to the for-mal credit system and the way they interlink with households farming tech-nologies adoption levels. According to Dufhues and Buchenrieder (2005), households’ decisions with respect to accessing credit are largely influenced by household socio-demographic characteristics, and by institutional factors. The conditions, lending policies and operational procedures of the finan-cial institutions represent the first category of factors that determine farm household access to formal credit. According to Dufhues, (2007) short term loans with many formal requirements are considered less attractive than long-term loans or more flexible short term loans like those provided in the informal sector. Hoff and Stiglitz, (1990) also note that high interest rates can crowd out poor more averse households in favor of less poor more risk-taking households. High interest rates or high collateral requirements can make especially poor risk-averse households refrain from loan application (Sarap, 1990). The decision to apply for a loan is also constrained by the household’s willingness to take a loan and the perceptions on the desirabili-ty of working with credit (Dufhues, 2007 and Mchujuko, 1991).
A second group of factors that influence access to formal credit can be re-ferred to human capital (socio-demographic characteristics). These factors reflect the capacity of the household to meet formal credit institutions selec-tion criteria, and constitute such factors as the personal characteristics of the
household head (Dufhues, 2007, Mohamed, 2003, Temu et al., 2001 and Kashuliza, et al., 1998). The third category is the household characteristics determining the household’s capacity to meet the collateral requirements. Basically, these are households’ endowments such as owning registered land, houses, livestock and durable consumer goods (Ibrahim et al., 2007 and Nuryartono et al., 2005). Also social networks and engagement in non-farm activities are additional households’ characteristics that can support house-holds to meet the expectations of the financial institution on repayment ca-pacity. The role of networks in relation to preferential access to credit has been extensively documented under the guise of the role patronage or politi-cal backup (Tibaijuka et al., 1989 and McKee, 1989).
In addition, access to information on available financial services, degree of access to extension services, market access intensity and the level of farm-ing technology adoption are all key factors enhancfarm-ing households’ capacity to meet credit conditions to utilize it effectively (Temu, et al., 2001). In this study, it is conceptualized that some socio-economic factors influence farm households’ credit constraint condition in formal credit markets. The study further conceptualizes that some socio-economic factors and household credit access attributes influence the intensity of agricultural technology adoption between credit constrained and non-credit constrained households.
5.2 Approaches to measure access to credit and credit constraints
Existing literature indicates the existence of three main approaches that can be used to determine household access to credit and credit constraints. These approaches are: (i) the indirect method which infers the presence of credit constraints from violations of the assumptions of the life cycle or per-manent income hypothesis, (ii) detection of credit constraint by directly ask-ing households and (iii) the use of the credit limit variable.
Empirical models testing for the presence of credit constraints based on life-cycle/permanent income or “consumption–smoothing” hypotheses use household consumption and income data to look for a significant depend-ence of consumption on transitory income. Empirical eviddepend-ence of a signifi-cant dependence of consumption on transitory income is taken as an indica-tion of a borrowing or liquidity constraint. The Life Cycle (LC)/Permanent Income Hypothesis (PIH) literature is extensive and is reviewed by Brown-ing and Lusardi, (1996), Besley, (1995) and Deaton, (1992), among others. In general, the empirical evidence based on the Life Cycle/Permanent Income Hypothesis approach has been inconclusive.
information gained directly from household members on their participation and experiences in the credit market. In practice, households are classified as credit constrained, based on their responses to several qualitative questions regarding their loan applications and rejections during a given recall period. This classification is then used in reduced-form regression equations to ana-lyze the determinants of the likelihood of a household being credit con-strained and the effect of this likelihood on various household outcomes. The method was first applied by Jappelli, (1990) using data from a house-hold survey in China. The method was subsequently used by Zeller, (1994), Schrieder and Heidhues, (1995) and Zeller, et al., (1996) with household sur-vey data from Madagascar, Cameroon and Pakistan, respectively.
The third method to detect the presence of credit constraint uses the cred-it limcred-it variable. According to Diagne and Zeller, (2001), the credcred-it limcred-it vari-able is an extension of the direct method. It refers to the extent of access to credit from a given source. It is measured by the maximum amount a house-hold can borrow from that source. However, according to Diagne and Zeller (2001) the credit limit a borrower faces depends on the lender’s and the bor-rower’s characteristics and actions. It also depends on random events affect-ing the fortune of lenders and other potential borrowers who may compete for the same possible credit. Stiglitz and Weiss, (1981) also note that the con-cept of “credit limit” is based on the assumption that credit from any possi-ble source is of limited supply i.e., lenders are constrained by factors beyond their control on the maximum amount they can possibly lend to any poten-tial borrower. This maximum loanable fund is a function of available re-sources and is independent of the interest rate that can be charged and of the likelihood of default.
Of these three approaches, the most widely accepted and used measure of access to credit is the direct questioning of the households (Gilligan et al. 2005; Godquin and Sharma 2005). Jappelli, (1990) and Zeller, (1994) classify households as credit constrained if they report any rejected application of credit or report being granted less than the amount they initially asked for and were not able to get the corresponding amount through another credit application. They also classified households as being credit constrained if these households did not apply because they thought they would have been turned down. Gilligan (et al., 2005) and Feder (et al., 1990) resorted to the ap-proach of directly asking borrowing households whether they would have liked more institutional credit at the going rates of interest. They also asked the non-borrowing households the reason for not borrowing. According to Feder (et al., 1990) borrowing households, which would have liked more in-stitutional credit and non-borrowing households, which reported that they
did not borrow because they could not obtain credit, were all credit con-strained. Schrieder and Heidhues, (1997) also asked households whether, during the recall period, they had applied for a formal loan and if not, why they did not apply. Those households that applied for formal loan were also asked if they had received loan entirely as requested or not. From the re-sponses to these questions, households were classified into credit con-strained households and non-credit concon-strained households.
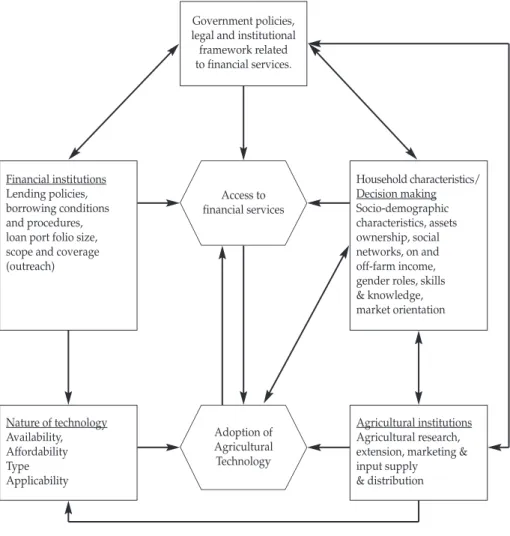
Figure 1. The conceptual framework of access to credit and the inter-linkages with farming technologies adoption
Financial institutions Lending policies, borrowing conditions and procedures, loan port folio size, scope and coverage (outreach)
Government policies, legal and institutional framework related to financial services. Access to financial services Adoption of Agricultural Technology Household characteristics/ Decision making Socio-demographic characteristics, assets ownership, social networks, on and off-farm income, gender roles, skills & knowledge, market orientation
Agricultural institutions Agricultural research, extension, marketing & input supply & distribution Nature of technology Availability, Affordability Type Applicability
5.3 Research Methodology 5.3.1 Data needs and sources
Data for the study were obtained both from primary as well as from sec-ondary sources. The secsec-ondary data were collected from various reports maintained by existing formal financial institutions such as commercial banks, micro-financial institutions and cooperatives, while the primary data were collected from a household survey of 750 farm households, carried out between May and June 2006.
The main data sets collected from the sample survey include:
• Demographic data i.e age, sex, education, marital status, main farm occu-pation, main off-farm activity and years of experience in farming of the head of the household and household size;
• Household resource ownership such as land, livestock, farm equipment; • Household head’s financial practices i.e. savings and credit access
as-pects, keeping financial records etc.;
• Levels of farming technologies adoption for various households; • Access to extension services (extension contacts intensity).
5.3.2 Data collection instruments
A structured questionnaire was used as a tool to collect primary data from farm households. The questionnaire was designed to capture both qualitative and quantitative data from the respondents. The questionnaire was made up of six main sections, in which the first section was designed to collect background information on the demographic characteristics of the re-spondents. The second section was intended to obtain information on the type of farming activities that the households are engaged with and the use of available technological packages. Household information on assets own-ership (land, livestock and productive equipment) was to be captured in sec-tion three of the quessec-tionnaire. The secsec-tion four of the quessec-tionnaire was de-signed to obtain household information on access and use of financial servic-es, while section five covers aspects related to household income and expen-ditures. The final section was designed to capture information on household access to extension services and degree of market integration.
The collection of information from the key stakeholders, mainly credit in-stitutions, was done through the use of a checklist questionnaire. The data collected from these institutions include loan portfolio size, sector-wise allo-cation of loans and coverage. The questionnaires were also designed to col-lect information on institutions’ lending conditions and procedures and or-ganizations’ opinion with regard to lending to smallholder farmers.
5.4 Sample size and sampling procedure
In sampling, five out of 10 districts were purposefully selected based on their agricultural potentials and presence of active credit operations. From each district, six Shehias3were randomly picked. In selecting respondents, a stratified random sampling technique was employed. With the assistance of
Shehia leaders, lists of all units in the target population was first developed
and later the population was stratified based on individual credit access sta-tus, gender and the level of farm technologies used. In order to be able to es-tablish the existence of inter-linkages between farming technologies adop-tion and access to credit it was necessary to have a sample that contained a sufficient share of households who were credit constrained and those who were credit unconstrained. At the same time, the households had to be at dif-ferent levels of farming technologies adoption. In addition, it was important to include in the sample a good number of women-headed-households in or-der to be able to assess the magnitude of genor-der disparity in terms of tech-nology adoption and credit access. Therefore in drawing the sample for this study, special considerations were made to ensure fair representation of mentioned strata.
Credit schemes registers as well as knowledge and experience of exten-sion agents and Shehia leaders were used in the stratification process. Selec-tion of respondents from these strata was done randomly by picking every fourth name that appeared in the lists. The target was to interview at least 20
respondentsfrom each selected Shehia. The aim of creating unique sub-sets of the population was to ensure that each stratum was well represented in the study sample. The study approach used literature review, interviews and formal surveys. In the first phase, a literature research was done to acquire a basic understanding of existing relevant research reports and documents. This was followed by a number of interviews with key informants from vari-ous institutions. The second phase involved the formal survey of 750 ran-domly selected households in 30 Shehias of five districts of Unguja and Pem-ba. The survey was conducted from May to June 2006 and involved heads of farm households who were used as the units of the study.
5.5 Data processing and analysis
Data from the study were first coded and later entered into the Statistical Package for Social Sciences (SPSS) for Windows version 11.5, cleaned by
run-3Shehia is the smallest administrative unit of the government, which is the same as a
ning frequencies of individual variables and later analyzed. Clean data were also exported to other software packages such as Micro Soft Excel, LIMDEP for Windows (version 8) and Stata/SE for Windows (version 10) for further analysis.
A substantial part of the analysis was based on descriptive statistics such as frequencies, cross-tabulations, means and correlation coefficients of some critical variables. These statistics were used to profile respondents’ character-istics, determine their financial practices with formal lenders as well as levels of adoption of improved farming technologies. To complement the descrip-tive analyses, some information was assessed qualitadescrip-tively, based on sound judgment and economic rationale. The Statistical Package for Social Sciences (SPSS-PC) software was used to analyze most of the descriptive statistics, while STATA 10 statistical software was used to generate histograms and boxplots.
In order to determine socio-economic factors that influence farm house-hold credit constraint condition in the formal credit markets, the probit re-gression model was employed. The probit model uses the normal Cummula-tive Distribution Function (CDF), which has been found to be very useful in analyzing dichotomous variables (Gujarati, 2004). In the probit regression model, the predicted probabilities for the dependent variable are never less than (or equal to) zero, or greater than (or equal to) one, regardless of the values of the independent variables.
This study was set to determine whether or not farm households are credit constrained in formal credit markets. A farm household head was con-sidered to be non-credit constrained, if he/she is able to borrow from formal financial institutions, although for a number of reasons he/she may choose not to borrow. On the other side, a household head is considered to be credit constrained if HE/SHE is unable to borrow from formal financial institu-tions or cannot borrow as much as he/she wants. The dependent variable considered in the study therefore is binary in nature i.e. it can only have two possible values, one for the occurrence of an event, zero otherwise. In this case, the dependent (binary) variable is one for all household heads who are non-credit constrained and zero if otherwise. A mixture of continuous and categorical variables may therefore explain this dependent binary variable.
However, to overcome the problem of sample selectivity bias, the Heck-man approach was employed. HeckHeck-man (1979) develops a simple two stages estimator to correct the bias that results from using nonrandomly se-lected samples to estimate behavioral relationships. This approach proposes the estimation of expected value of error and its inclusion as an extra explanatory variable in the regression (Wooldridge, 2002; Green, 2000;
Kennedy, 1998; Berndt, 1991). In other words, using a probit model, coeffi-cients are first estimated by maximum likelihood and the estimates ob-tained for each observation are passed to the second equation to be used as an exogenous variable. This allows the parameters in the second equation to be estimated consistently by least square regression (Hoffmann and Kas-souf, 2005). The theoretical exposition of the analytical model used in the analysis is given in annex 1.
From the foregoing discussion, the general form of the determinants of access to formal credit was specified as in equation 1 and the explanatory variables related to the model are summarized in Table 1.
Ca = β0+ β1EDUC + β2GEND + β3LSTOC + β4LEAD + β5AGE + β6BANS +
β7ACRE + β8FREC + β9NCRE + β10VASS + β11ICOM + β12EXTI + B13TECH +
β14HHS + 僆a ………. (1) Where:
Ca = Whether household head has access to credit or not
βi = Coefficients 僆a= Error term
Table 1. Variables specified in the analytical models
Variable name Abbreviation Specification A priori sign Variable category
Landholding size ACRE Number Negative Physical capital
Keeping livestock LSTOC Proxy Positive Physical capital
Value of productive assets VASS Tshs Positive Physical capital Household cash income ICOM Tshs Positive Physical capital Number of credit received NCRE Number Positive Physical capital
Bank savings BANS Proxy Positive
School years of hh head EDUC Number Positive or negative Human capital Extension contacts intensity EXTI Index Positive or negative Human capital
Household size HHS Number Negative Human capital
Agric. Technology adoption intensity TCH Index Positive or negative Human capital Keeping financial records FREC Proxy Positive Human capital
Age of household head AGE Years Negative Social capital
Sex of the respondent GEND Proxy Negative Social capital Respondent leadership role LEAD Proxy Positive Social capital
In the analysis, the marginal concept was also used to predict the effect of a change in an explanatory variable on the probability of a favorable attitude to-ward access to formal credit. For continuous variables, derivatives of the prob-ability function were evaluated at the mean values of the independent vari-ables. The marginal probability was calculated by multiplying the coefficient estimate βi by the standard probability density function n(Xi,βi) of the probit model evaluated at the mean values of the explanatory variables. For categori-cal explanatory variables with a value of zero or one, the marginal probability was calculated as the difference arising from n(Xi,βi) for Xi = 0 and Xi = 1 for the discrete variable (Mazuze, 2004 and Tambi et al., 1999). The marginal prob-ability was used to explain the likelihoods towards access to formal credit.
With the Heckman selection equation, the same exogenous variables as in the Probit model were specified (see Table 1). This is so in order to be able to ascertain socio-economic factors that influence household credit use intensi-ty. Therefore, the dependent variable was the formal credit use intensity in-dex which was developed from summing up selected indicators as attributes of households in accessing the formal credit. The selected indicators were given weight as scores and later summed and averaged to give intensity scores (see Annex 2).
The empirical model for the Heckman selection equation was therefore specified as follows:
CI= β0+ β1EDUC + β2GEND + β3LSTOC + β4LEAD + β5AGE + β6BANS +
β7ACRE + β8FREC + β9NCRE + β10VASS + β11ICOM + β12EXTI + B13TECH +
β14HHS + 僆a ………. (2)
Where,
CI = formal credit use intensity index
βi = Coefficients 僆a= Error term
In the assessment of the impact of access to formal credit on the adoption of agricultural technologies, again using the direct elicitation approach, sam-pled households were categorized into credit constrained and non-credit constrained. An estimation of the impact of access to credit on the adoption of agricultural technologies between categories of household was done while accounting for selection bias. The impact of access to credit was esti-mated using a switching regression model.
The switching regression model accounts for the fact that each household has a non-zero probability of being credit constrained in each period, the
probability varies depending on household characteristics, and only one re-alization of these probabilities is observed in each period. Consistent esti-mates parameters can be obtained by following a two-step Heckman proce-dure of estimating credit constraint equation as a Probit and estimating other two equations separately, while correcting for the selection bias by including the inverse Mills ratio from Probit as regressor in the two equations.
In this study, it was hypothesized that some socio-economic factors have significant effect on farm household access to formal credit; these socio-eco-nomic characteristics influence the adoption of agriculture technologies dif-ferently between households with access to formal credit and those without access to formal credit. The analysis in this study was carried out in two lev-els i.e. the first level was the determination of factors that influence farm household access to formal credit and the second level was the isolation of factors that influence adoption of farming technologies among credit access constrained and non-credit access constrained households. The detailed de-scription of the steps followed is as given in annex 3.
The model specification for the reduced forms regression is as follows:
At = β0+ β1EDUC + β2SGEND + β3EXTI + β4ACRE + β5NCRE + β6HHS +
β7LSTOC + β8VASS + β9ICOM + β10FCUI + β11AGE + 僆t ………. (3) AI = Agricultural technology adoption intensity
βi = Coefficients 僆a= Error term
Independent variables specified in the model are presented in Table 2. Some diagnostic tests were performed in order to examine the problems of autocorrelation, multicollinearity and heteroscedasticity. The use of the Durbin-Watson statistic test and the MLE method in most cases indicated the absence of these problems. The goodness-of-fit of the probit model was measured by the McFadden with likelihood ratio statistics as the basis of in-ference (Hawassi, 2006) with a chosen significance level of 10 percent proba-bility level. Similarly the goodness-of-fit of the linear regression model was measured by adjusted R2(Maddala, 1988 and Gujarati, 1988) with a chosen significance level of 5 percent confidence level. Furthermore, inspection of the signs of the estimated parameters was made in order to confirm if they conform to the priori expectation. The inspections were also made on the values of the standard errors of the variables included in the model and to check whether the empirical model was correctly predicted. On the basis of these criteria, the empirical models used in this study were found to be ap-propriate in determining the main factors that significantly influence access
to formal credit and technology adoption between the regimes of households (credit constrained and non-credit constrained).
Further analysis was done in order to measure the credit access and out-reach. The proportion of farming households that had accessed credit in the formal credit markets were used as a measure of credit access, while the Principal Component Analysis (PCA), which is a multivariate technique, was used to measure poverty outreach (depth outreach). The PCA was used as an econometric instrument by the IFPRI in developing the poverty assess-ment tool in the late 1990s (Dufhues, 2007). The main objective of PCA is to reduce the dimension of observations so that different correlated variables are aggregated into fewer uncorrelated principal components, which can be seen as indices (Dufhues and Buchenrieder, 2005 and Fraser and Kazi, 2004). With this technique, most of the information contained in the data is repre-sented in the new indices. Basically, this technique is viewed as “data reduc-tion technique”, since the set of original m variables is reduced to n principal components (PC), with n«m. This smaller number of components can then be used for interpretation purposes or further data analysis. The procedure
car-4 The technology adoption intensity index was obtained by summing up and later
averag-ing the weighted scores of adoption of desired farmaverag-ing technologies; three main farmaverag-ing lines enterprises were selected (see Annex 4).
Table 2. Variables for the switching regression model on the adoption of agricultural technology4
Variable name Abbreviation Specification A priori sign Variable category
Keeping livestock LSTOC Proxy Positive Physical capital
Landholding size ACRE Number Negative Physical capital
Value of productive assets VASS Tshs Positive Physical capital Household cash income ICOM Tshs Positive Physical capital Number of credit received NCRE Number Positive Physical capital School years of hh head EDUC Number Positive Human capital Extension contacts intensity EXTI Index Positive Human capital
Household size HHS Number Negative Human capital
Farms household Credit
use intensity FCUI Index Positive or negative Human capital
Age of household head AGE Years Negative Social capital
ried out by the analysis is to calculate new uncorrelated principal compo-nents by linear combinations of the original, correlated variables. This is done by deriving (standardized) weights for each indicator. In algebraic terms this means that:
PC1 = W11 ν1+ w12 ν2+ ……….+ w1m νm PC2 = W21 ν1+ w22 ν2+ ……….+ w2m νm PCm= Wm1 ν1+ wm2 ν2+ ……….+ wmm νm
Where w is the calculated weight and νis the variable. Applied to pover-ty assessment, the PCA determines a subset of indicators that measures the relative poverty level of a household. In the end, a single indicator for each household is created, reflecting the household poverty status in relation to all other household of the sample (Fraser and Kazi, 2004). With the weights of the PCiand the respective indicators, the poverty index is calculated for each household. Relative comparisons can be drawn by ordering the house-holds according to their poverty index and sorting them into three groups of equal size. The lowest group incorporates the poorest households, while the middle group and the upper group embrace the poor and the less poor households. The advantage of PCA is that it creates a single indicator that is easy to use for analysis, while at the same time this single indicator is not limited to the monetary aspect addressed by household expenditures as the conventional method of (income) poverty.
The PCA technique allows to take the multiple dimensions of poverty in-to account and in-to integrate qualitative variables with quantitative ones. The indicators can be divided into three categories:
1. Means to achieve welfare, which includes indicators that reflect the earn-ing capacities of a household. They are subdivided into human capital, social capital and ownership of assets.
2. Basic needs, which include indicators such as food consumption and shelter.
3. Other aspect of welfare which include indicators such as having leader-ship role, access to extension networks and market access.
6. RESULTS AND DISCUSSION
6.1 Credit constraints in formal credit markets
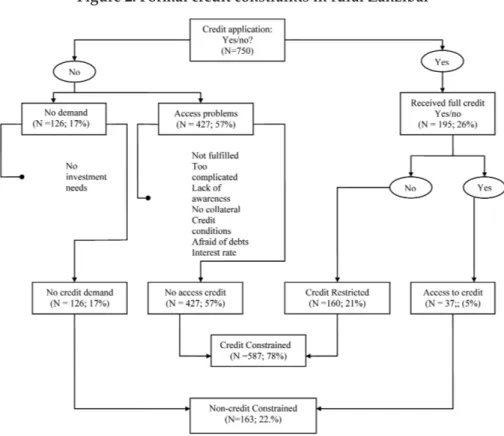
The number of households who were credit constrained in the formal credit markets among the whole sample of households were 587 (78%) and
the remaining 163 (22%) were therefore non-credit constrained (see Figure 2). Of those households who were non-credit constrained, only 5% indicated to have obtained credit as they requested and the remaining 17% indicated to have no investment needs that needed credit support. Of those who were found credit constrained, 22% were quantity constrained and 56% had access problems caused by factors such as inability to satisfy credit requirements, lack of awareness on availability of credit, high interest rates and fear to be in debts.
Figure 2. Formal credit constraints in rural Zanzibar
6.2 Socio-economic characteristics of sampled households by access to credit
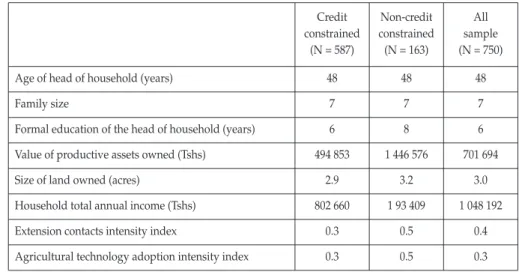
Table 3 shows that the average family size of the sampled households is 7 persons. This is the same for credit constrained and non-credit con-strained households. The average age of sampled household heads is 48
years. Again, this is the same for credit constrained and non-credit con-strained households. The average number of years of formal schooling for the whole sample is 6 years. Non-credit constrained households had on av-erage two years more of formal schooling than the credit constrained house-holds.
The average value of productive assets owned by the sampled house-holds is Tshs 701 694 (US Dollar 540)5. The non-credit constrained house-holds on average had productive assets valued three times more than that of credit constrained households. The average annual income of the sampled households is Tshs 1 048 192 (US Dollar 806), while the average annual in-come of non-credit constrained households is two times more than the aver-age annual income of credit constrained households. The extension contacts intensity index (see Annex 5) is greater for the non-credit constrained house-holds than for credit constrained househouse-holds (0.5 versus 0.3). Likewise, the agricultural technology adoption intensity index of non-credit constrained households was greater than that of credit constrained households (0.5 ver-sus 0.3).
Table 3. Socio-economic characteristics of sampled households by credit access status
Source: Own survey, 2006
5US Dollar 1 = Tanzania Shilling (Tshs) 1,300.
Credit Non-credit All constrained constrained sample
(N = 587) (N = 163) (N = 750)
Age of head of household (years) 48 48 48
Family size 7 7 7
Formal education of the head of household (years) 6 8 6 Value of productive assets owned (Tshs) 494 853 1 446 576 701 694
Size of land owned (acres) 2.9 3.2 3.0
Household total annual income (Tshs) 802 660 1 93 409 1 048 192
Extension contacts intensity index 0.3 0.5 0.4
6.3 Depth outreach of the formal financial sector
Outreach simply means the number of clients served. However, Meyer (2002) noted that outreach is a multidimensional concept and that, in order to measure outreach, we need to look into different dimensions. These di-mensions include the number of persons served by financial institutions, the number of women served and the number of financial services provided. Similarly, Navajas et al. (2000) indicate that there are six aspects of measuring outreach: depth, worth of users, cost to users, breadth, length and scope. Depth outreach refers to the value society attaches to the net gain from the use of the micro credit by a given borrower (Navajas et al. 2000). This meas-ure is used to identify poor clients. Therefore in order to establish the depth outreach of the formal financial sector in the study areas, the Composite In-dicator of Multidimensional Poverty was developed to capture the non-in-come dimension of poverty in Zanzibar.
As mentioned in several studies on the limitations of income and expen-diture as a measure of identification of the poor (Siddhisena and Jayathilaka, 2006), the study analyzed several other socio-economic dimensions includ-ing income in the identification of poor households usinclud-ing the sample data. The number of variables such as house status (type of wall, type of roofing material, floor type), income level, size of land owned, value of productive assets owned, owing livestock, leadership status, level of education and fam-ily size were initially used and significant factors were taken into account us-ing the Principal Component based Factor Analysis.
The variables were weighted and rescaled with the Eigen (more than one) value and accordingly the poverty levels of sampled households were iden-tified. The results of the Principal Component based Factor using SPSS are presented in Table 4 and Figure 5. Since the three Eigen values (greater than 1) explained 56% of the variability, three factors (F1 = Means to achieve the welfare; F2 = Basic needs; F3 = Other aspects of welfare) provide sufficient explanation of the eight variables listed (Table 5)6. The composite indicators were developed using the mean value of the three factors, multiplying them by the corresponding Eigen values.
6 The variables included in the factors:
F1 = Ownership of productive assets, including land, household size, income, level of edu-cation, owning livestock
F2 = House status (Type of wall, Type of roofing material, Type of floor, Type of latrine F3 = social status i.e leadership role.
Table 4. Eigen Values (24) and Factor Scores (25) of the Factor Analysis
Table 5. Rotate Component Matrix
Note:
ACREAGE = Size of landholding (expressed in acres), EDUC = Level of education, FAMILY_S = Number of people in the household, ASSEE = Value of productive assets/farm equipment, INCOME = Average an-nual household income, HOUSE_ST = The status of the house (which is an aggregate of the Type of wall, Type of roofing materials, Type of floor and Type of latrine), LEAD_S = Household leadership role in the community), LIVESTOCK = Estimated market value of livestock owned by the household.
Source: Own survey, 2006
Eigen Value Percentage of Variance Cumulative %
2.288 28.596 28.596 1.136 14.197 42.792 1.061 13.263 56.055 0.850 10.624 66.679 0.819 10.232 76.911 0.741 9.264 86.175 0.644 8.050 94.225 0.462 5.775 100.000
Rotated Component Matrixa
1 2 3 ACREAGE 0.122 0.664 0.229 EDUC 0.481 0.039 0.522 FAMILY_S -0.022 0.818 -0.017 ASSEE 0.775 0.213 -0.044 INCOME 0.754 -0.024 0.085 HOUSE_ST 0.611 -0.005 0.149 LEAD_S 0.003 -0.122 -0.834 LIVESTOC -0.480 -0.396 0.290
Extraction Method: Principal Component Analysis. Rotation Method: Varimax with Kaiser
Normalization
Figure 5. Poverty index distribution among sampled household heads
Based on these composite indicators for the sampled households, the variability of household poverty was measured and households were classi-fied accordingly into three categories: poorest, poor and less poor (see Table 6).
As revealed from the classification 34% of the sampled households were categorized as poorest, while 24% were classified as poor and 42% as less poor. From Table 6 it is clear that better-off households are over-represented with respect to those who have accessed credit in the formal financial sector and that poor and poorest households are under-represented. As indicated in Table 6, only 10% of the households belonging to the poorest group have accessed credit in formal credit markets. The percentage of the poor house-hold heads that had accessed formal credit is slightly higher than that of more poor households, while the proportion of less poor households who had accessed credit in formal credit markets is five times larger than that of poor household heads.
With these results, the poorest households in the sample are clearly un-der-proportionately served by the formal financial sector. This finding is also confirmed by Mohamed (2003), who indicated that the poorest have not
ben-efited from the reforms of the financial sector, and continue to be marginized by the formal financial sector. The report of Bank of Tanzania (2007), al-so confirms that the depth outreach of micro-financial institutions (MFIs) is shallow. It can therefore be concluded that despite ongoing financial reforms and the liberalization of the financial sector in Zanzibar, the breadth and depth of formal financial institutions is still low and the poorest households in rural areas are severely disadvantaged.
6.4 Determinants of formal credit constraint condition
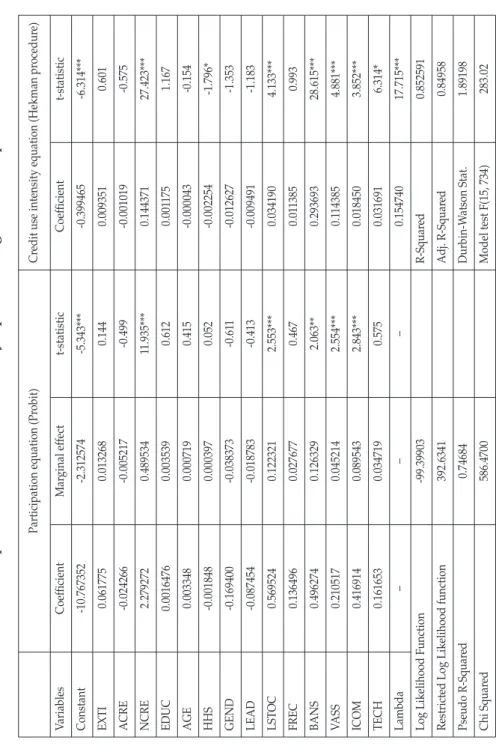
The model for the estimation of the determinants of formal credit constraint condition in the formal credit markets included fourteen different explanatory variables (regressors). The Maximum Likelihood Method was used for esti-mating variable coefficients and marginal effects of regressors on the probabili-ty household being non-credit constrained in the formal credit markets. The re-sults of the binomial probit model for the determinants of credit constraint condition are presented in Table 7. As can be seen from Table 7, the specified probit model fits very well the data as measured by McFadden (R2). The high value of McFadden (74.7%) suggests a good predictive ability of the model im-plying that the variables included in the model explain about 74.7% of the variation in the dependent variable. Furthermore, the Chi-square statistic shows the model is highly significant at (P≤0.01), indicating that all variables included in the model are jointly different from zero. The model has also very high predictions (89.6%). All these confirm that there is a relationship between the dependent variable and explanatory variables included in the model.
The variables included in the model were Extension contacts intensity (EXTI), Landholding size (ACRE), Number of formal credit received (NCRE), Years of formal education of household head (EDUC), Age of the head of household (AGE), Household size (HHS), Sex of the respondent (GEND), Household head leadership status (LEAD), Keeping livestock
Credit access status Poorest Poor Less poor Total
Credit constrained households 41 (240) 27(157) 32(190) 100(587) Non-credit constrained households 10(16) 15(24) 75 (123) 100(163)
Total 34(256) 24(181) 42(313) 100(750)
Table 6. Outreach of formal credit markets by poverty groups
(LSTOC), Keeping financial records (FREC), Having bank account (BANS), Value of productive assets (VASS), Household head annual income (ICOM), and Agricultural technology adoption intensity (TECH).
With the exception of LEAD all variables included in the model possess the hypothesized direction of influence on the probability for farm house-hold heads to have access to credit (being non-credit constrained) in the for-mal credit markets. Except for landholding size (ACRE), household size (HHS), sex of respondent (GEND) and household head leadership status (LEAD) all variables have a positive influence on the probability that farm households have an access to formal credit.
In this model, the coefficients of five out of fourteen explanatory vari-ables are statistically significant at various levels of probability. The results show a positive and statistically significant coefficient for number of credit received by household heads (NCRE) at (P≤0.01), indicating that increased number of loans received by farm household increases the probability of household heads to access credit in the formal credit markets. The coefficient of the variable livestock keeping (LSTOC) being positive and statistically sig-nificant at (P≤0.01) suggests that keeping livestock increases the probability of a household head being non-credit constrained. Similar finding was ob-tained by Ellis and Mdoe (2002). In rural economy, keeping livestock, partic-ularly cattle, is associated with a relative wealth of the household. Relatively wealthier households can afford to keep livestock (cattle) and this explains their high probability of being non-credit constrained.
The positive and statistically significant coefficient of having bank ac-count (BANS) at (P≤0.05) implies that having a bank account increases the probability of a farm household being non-credit constrained. Having a bank account is regarded as an important factor for establishing contacts with bank officials and for getting information on credit. Bank savings may also be used as security for loans and therefore may increase bank account hold-ers’ chances of accessing formal credit.
The value of productive assets (VASS) had also a positive and statistically significant coefficient at (P≤0.01), implying that increasing the value of pro-ductive assets owned by households is likely to increase the probability of farm household head being non-credit constrained in the formal credit mar-kets. Total income, as a proxy for welfare status, also confirms that increasing the household total income reduces the probability of a household being credit constrained. The variables total income was statistically significant at (P≤0.01). The interpretation of this finding is that a better household situation affects the decision of the lender to ration the loan or that the household has less demand for loan because of the households’ own equity capital
accumu-lated through past income earnings. The lender also considers the welfare sta-tus of a client or potential client before signing a contract to provide the loan.
The marginal effects, measured by marginal probabilities in Table 7, indi-cate the effect that an additional unit of a specified variable may have on the probability of household head being non-credit access constrained in the for-mal credit markets. However, the marginal probability computed for contin-uous variables is not comparable with those computed for dichotomous variables. As indicated in Table 7, the one unit increase in value of produc-tive assets (VASS) increases the probability of household head becoming non-credit constrained by 0.0452 percent. Similarly, one unit increase in the level of household head income (ICOM) increases the probability of becom-ing non-credit constrained by 0.0895 percent.
The number of times that a household has received formal credit (NCRE) seems to have the greater influence in explaining the increase in the proba-bility of accessing credit in the formal credit markets in the study areas. This is so because the one unit increase in the number of times that a household has accessed formal credit increases the farm household heads’ probability of being non-credit constrained by 0.4895 percent.
In a situation of dichotomous variable, such as the case with keeping live-stock and having a bank account, the results could be interpreted in the sense that the marginal probability of farm household towards accessing for-mal credit with respect to keeping livestock and having bank account are 0.1223 and 0.1263, respectively.
Further analysis of factors hypothesized to influence farm household ac-cess to credit in the formal credit markets were carried out using the OLS re-gression model. This was done specifically to see if these factors have similar effects on the intensity of formal credit use. Table 7 presents coefficients of determinants of farm households’ intensity use of formal credit. The good-ness of fit of the model is high as measured using adjusted coefficient of de-termination (Adjusted R2). The coefficient of determination (R2) for the cred-it use intenscred-ity equations, estimated using Heckman’s procedure is 0.85, sug-gesting that the variables included in the model explain 85% of the varia-tions in the dependent variable. The F-value is highly significant at (P≤0.01), indicating that the explanatory variables were statistically significant in ex-plaining variation in the dependent variable.
As indicated in Table 7, seven coefficients out of fourteen were found to be significant at various probability levels. Except for household head lead-ership status (LEAD) all coefficients had the expected signs. The coefficient for the number of credit received was positive and statistically significant at (P≤0.01), indicating that the increase in the number of credit received
in-creases the intensity of formal credit use by 0.14%. The coefficient for family size is negative and significant at (P≤0.1), meaning that the increase in the size of the household decreases the intensity of formal credit use by 0.002%.
Keeping livestock has a positive and significant coefficient at (P≤0.01) sug-gesting that keeping livestock increases farm household intensity of formal credit use by 0.03%. Livestock keeping has more economic incentives and is relatively less risky than crop farming under rain-fed conditions. Besides, there has been high concentration of credit for livestock activities and this ex-plains why keeping livestock may induce increased use of formal credit. Simi-larly, having a bank account was also found statistically significant at (P≤0.01), indicating that having bank account increases the intensity of formal credit use by 0.29%. This finding is not surprising taking into account that having a bank account is taken by most lenders as one of the conditions for loan dis-bursement. Besides, having a bank account implies household integration into the formal financial system and this may remove households’ barriers to ac-cess formal credit, which may be caused by lack of awareness, fear of formal organizations and lack of collateral. Bank savings can as well be used as secu-rity for receiving loans from formal credit markets. All these have the poten-tial of increasing the intensity of formal credit use by households.
The value of productive assets was also found with positive and statisti-cally significant coefficient at (P≤0.01), implying that increase in value of productive assets has the potential for increasing the intensity of the use of formal credit by 0.11%. Value of productive assets may be used by lenders as collateral or security for the loan. Households with greater value of produc-tive assets therefore stand a better chance to get formal credit and hence their use of formal credit. Likewise, the household total income was found statistically significant at (P≤0.01), suggesting that an increase in household total income increases the intensity of formal credit use by 0.02%.
The intensity in the adoption of agricultural technologies in the house-hold was also found to be statistically significant at (P≤0.1). The positive sign of its coefficient implies that increase in technology adoption intensity in-creases the use of formal credit by 0.03%. As already explained, applying im-proved technological packages, farmers need capital and in the absence of own funds, a household may resort to the use of credit. So in case of creased technological advancement, farmers may as well increase their in-tensity in the use of formal credit.
In the model, the coefficient of the inverse Mill’s ratio variable (lambda), obtained from the probit equation, was also found to be statistically signifi-cant, which means that its inclusion in the model was necessary to avoid sample selection bias.
T
a
ble 7. Probit equation and credit use intensity equation using Heckman’
s procedure
Participation equation (Pr
obit)
Cr
edit use intensity equation (Hekman pr
ocedur e) V ariables Coef ficient Mar ginal ef fect t-statistic Coef ficient t-statistic Constant -10.767352 -2.312574 -5.343*** -0.399465 -6.314*** EXTI 0.061775 0.013268 0.144 0.009351 0.601 ACRE -0.024266 -0.005217 -0.499 -0.001019 -0.575 NCRE 2.279272 0.489534 11.935*** 0.144371 27.423*** EDUC 0.0016476 0.003539 0.612 0.001 175 1.167 AGE 0.003348 0.000719 0.415 -0.000043 -0.154 HHS -0.001848 0.000397 0.052 -0.002254 -1.796* GEND -0.169400 -0.038373 -0.61 1 -0.012627 -1.353 LEAD -0.087454 -0.018783 -0.413 -0.009491 -1.183 LST OC 0.569524 0.122321 2.553*** 0.034190 4.133*** FREC 0.136496 0.027677 0.467 0.01 1385 0.993 BANS 0.496274 0.126329 2.063** 0.293693 28.615*** V ASS 0.210517 0.045214 2.554*** 0.1 14385 4.881*** ICOM 0.416914 0.089543 2.843*** 0.018450 3.852*** TECH 0.161653 0.034719 0.575 0.031691 6.314* Lambda – – – 0.154740 17.715***
Log Likelihood Function
-99.39903
R-Squar
ed
0.852591
Restricted Log Likelihood function
392.6341 Adj. R-Squar ed 0.84958 Pseudo R-Squar ed 0.74684 Durbin-W atson Stat. 1.89198 Chi Squar ed 586.4700 Model test F(15, 734) 283.02
Hosmer -Lemeshow Chi-squar ed 23.07320 Log-l 730.61 Degr ee of fr eedom 14 Restricted (b=0) log-l 12.6542 McFadden 0.74684 Thr eshold V alue for Pr edicting (Y=1) 0.5
Households with access to cr
edit
163
Households with no access to cr
edit
587
Total sampled households
750 Per centage of Right Pr ediction (%) 89.571 Pr ediction failur e (%) 10.429 TECH =
Intensity of adoption of agricultural technologies (index)
EXTI
=
E
xtension contacts intensity (index)
ACRE
=
Size of land owned by household (acr
es)
NCRE
=
Number of cr
edit r
eceived by household head
EDUC
=
L
evel of formal education attained by household head
AGE
=
Age of the head of household (years)
HHS
=
Household size (number of people in the household)
GEND
=
D
ummy variable for gender (1 = male, 0 = otherwise)
LEAD
=
L
eadership of hh head (1= leader
, 0 = otherwise)
LST
OC
=
Whether keeping livestock or no? (1 =
Y
es, 0 = otherwise)
FREC
=
D
ummy for keeping financial r
ecor ds (1 = Keep r ecor ds, 0 = otherwise) BANS = D
ummy variable for having bank account (1= have bank account, 0 = otherwise)
V
ASS
=
Total value of pr
oductive assets owned by household (T
shs)
ICOM
=
A
verage household annual income (T
shs)
Note:
6.5 Agricultural Technology Adoption –
Credit constrained and non-credit constrained households
The results from cross tabulation analysis show the existence of a close re-lationship between agricultural technology adoption intensity and access to credit. Statistically, the relationship was found to be significant at (P≤0.01). These findings indicate that technology adoption may create demands for loans and this may influence the credit constraint condition of a household. This being the case, the hypothesis that state that there is no difference be-tween credit constrained households and non-credit constrained households with regard to technology adoption intensity is rejected. Figure 6 illustrates the association between levels of agricultural technology adoption and ac-cess to credit.
Figure 6. The degree of household agricultural technology adoption intensity by credit access
The Reduced form coefficient estimates of second stage switching regres-sion models for agricultural technology adoption are shown in Table 8. De-spite the model’s goodness of fit being low (low adjusted R2) in both regimes (credit constrained and non-credit constrained), the F-value in both regimes
is highly significant indicating that all variables included in the model are jointly different from zero. This is quiet acceptable for the kind of study of this nature (See Nuryartono et al., 2005). In the estimation, the coefficient of lamda was found statistically significant in both regressions, suggesting that the sample did suffer from sample selection bias and that direct estimation of the model by OLS would have yielded biased estimates.
Extension contacts intensity did significantly influence the adoption of agricultural technologies for the non-credit constrained households, but it was not important for credit constrained households. The coefficient of exten-sion contacts intensity for the non-credit constrained households was signifi-cant at 1% probability level and the sign of the coefficient was positive, im-plying that increasing extension contacts may influence technology adoption for non-credit constrained households. Extension contacts did not have sig-nificant effect on technology adoption for the credit constrained households. This indicates that for extension services to be effective in terms of enhancing agricultural technology adoption, farm households need to be non-credit con-strained. The number of formal loans received by the household head signifi-cantly influenced the adoption of agricultural technologies for the credit con-strained households. The positive coefficient of the variable number of credit accessed suggests that any additional loans that credit constrained house-holds have received has a significant effect on the adoption of agricultural technologies. However, increasing the number of credit to non-credit con-strained households may have an impact on agricultural technology adoption but not in the same way as it does with credit constrained households.
Household size was found to be statistically significant for the non-credit constrained households and not for the credit constrained households. The negative sign of the coefficient indicates that as household size increases, the agricultural technology adoption intensity for non-credit constrained de-creases. There being no effect for the credit constrained households indicates that household size is not an important factor for technology adoption once the farm household is credit constrained. The value of productive assets and household income were also found to be important factors for technology adoption among non-credit constrained households. This implies that one unit increase in value of productive assets owned by household and one unit increase in income level of the household have the corresponding effect of increasing the intensity of technology adoption for the credit constrained households. From the results presented in Table 8, it can also be noted that the coefficient for lamda in all regression equations was significant. This sug-gests that the sample did suffer from sample selection bias and that direct es-timation of the model by OLS would have yielded biased estimates.
Table 8. Estimated coefficient for agricultural technology adoption distinguished between credit constrained
and non-credit constrained households
Note: ***, **, and * are significant at 1, 5, and 10 percent level respectively
Credit constrained Non-credit constrained
Variables Coefficient Std Error Coefficient Std Error
Constant -0.479278 0.590587 -0.270771 0.203945 EXTI 0.025933 0.184575 0.146199 0.035793*** ACRE -0.008833 0.022542 0.001224 0.003676 NCRE 3.270460 1.466647** 0.020307 0.0116594* EDUC 0.000054 0.011365 0.000964 0.002407 AGE 0.0021154 0.003347 -0.00021 0.002407 HHS -0.001326 0.015224 -0.007144 0.003216** GEND 0.079750 0.117640 -0.005761 0.0235330 LSTOC -0.006177 0.103256 -0.014084 0.017672 VASS 0.0179471 0.037841 0.036474 0.009984*** ICOM 0.056883 0.053074 0.019153 0.015572 FCUI 0.618740 0.458456 0.023223 0.050372 Lamda -1.972086 0.828743** -0.005755 0.018483 Adjusted R2- 0.29784 0.39021 F 21.71*** 9.64*** No. of observations 587 163
EXTI = Extension contacts intensity (index) ACRE = Size of land owned by household (acres) NCRE = Number of credit received by household head EDUC = Level of formal education attained by household head AGE = Age of the head of the household (years)
HHS = Household size (number of people in the household) GEND = Dummy variable for gender (1 = male, 0 = otherwise) LSTOC = Whether keeping livestock or no? (1 = Yes, 0 = otherwise) VASS = Total value of productive assets owned by household (Tshs) ICOM = Average household annual income (Tshs)
7. SUMMARY, CONCLUSION AND RECOMMENDATIONS 7.1 Summary of the study
This study was carried out to establish the extent of access to credit among smallholder farmers in Zanzibar and determine factors that influence farm household credit constraint condition in formal credit markets. In addi-tion, the study aimed at assessing the effect of access to credit on the adop-tion of agricultural technologies. The assumpadop-tion was that farm households’ access to credit is influenced by socio-economic factors and that increased access to credit positively affects the adoption of agricultural technologies among credit constrained households.
Both primary and secondary data were used in the study. The review of the existing literature provided much of the secondary information, while the primary data were obtained from interviews of key informants and the household survey. The checklist questions were used to interview key in-formants from banking institutions, relevant government departments, Sav-ings and Credit Cooperatives (SACCOS) and Micro-finance NGOs. Data from the survey were collected from interviewing 750 households using structured questionnaires. A combination of sampling techniques was used and the primary data were collected in five districts (3 on Unguja and 2 on Pemba).
The study used both descriptive statistics and econometric models to an-alyze the data. The probit model and Hekman’s selection equation were used to determine factors that influence sampled households credit con-straint condition in the formal credit markets. In order to determine the im-pact of access to credit on the adoption of agricultural technology the Switching regression model (SRM) was employed while correcting for possi-ble sample selection. With the switching regression model, the first step used the probit model to determine the relationship between farm household heads’ credit constraint condition and a number of socio-economic and cred-it variables. The second stage followed was the estimation of farming tech-nologies adoption function between credit constrained and non-credit con-strained households using reduced forms equations.
The results from the study indicate that there is limited access of formal credit in the surveyed areas and that the majority of smallholder farmers are credit constrained in the formal credit markets. The study also revealed that a significant proportion of farm households in the areas covered by the survey had no credit demands in the formal credit markets. Socio-economic characteristics of the heads of households such as household size, having a
bank account, value of productive assets owned by household, level of in-come of the head of the household, keeping livestock and the number of times a household has received formal credit, were found to be important determinants of farm household credit constraint condition in the formal credit markets. The results show that an increasing number of credit that a farm household receives from the formal credit markets increases their probability of being non-credit constrained. This could be due to the fact that many micro-financial institutions use a graduation mechanism in ex-tending loans to small borrowers: they start with small loans and gradually increase the size of subsequent loans upon fulfilling the loan repayment ob-ligations.
The household size was found to have a negative influence on farm household access to credit in the formal credit markets. These results were expected since the larger family size, despite having potential for labor sup-ply, implies a high dependency ratio for the household. In African culture the head of the household has the responsibility of taking care of all mem-bers in the family. The high dependency ratio contributes to the degree of household poverty and hence limits household head to access formal credit. Also, the results indicate that increase in the value of productive assets owned and level of income increases the probability of farm households of becoming non-credit constrained in the formal credit markets. In addition, the results indicate that the probability of being non-credit constrained is higher for farm households who have a bank account. The positive sign of the coefficient of variable agricultural technology adoption intensity sug-gest the positive influence of agricultural technology adoption on credit ac-cess of smallholder farmers in the formal credit markets. The possible expla-nation for this finding is that an increase in technology adoption results in an increase in production and productivity and hence an increase in the farm’s income. Increased income increases farm household socio-economic leverage which enhances their chances to access credit in the formal credit markets.
The results from the SRM show that the number of times a farm house-hold has received formal credit influences technology adoption among credit constrained and non-credit constrained households. However, the ef-fect is more for the credit constrained than for the non-credit constrained households. This suggests a need for targeting credit interventions. Increas-ing the number of credit would be more effective in influencIncreas-ing the adop-tion of agricultural technology when households are credit constrained. Ex-tension contacts intensity has however a positive influence on agricultural technology adoption among non-credit constrained households and not for