1582 IEEE PHOTONICS TECHNOLOGY LETTERS, VOL. 21, NO. 21, NOVEMBER 1, 2009
Assessing the Noise Statistics in Common Optical
Transmission Systems
E. Ciaramella, Member, IEEE, L. Banchi, A. Di Mauro, G. Contestabile, and M. Presi
Abstract—We experimentally investigate the probability density
function (pdf) of sampled bits in common intensity-modulated direct-detection systems in linear and nonlinear regime, both single-channel and wavelength-division-multiplexed. To this aim, we use a recirculating fiber loop and selectively obtain the sample pdf for the various bits in a given sequence, which al-lows separating the intersymbol interference (ISI) effects. Our measurements confirm a recent theoretical simplified model, suggesting that, under the above conditions, a generalized analytic form is a good approximation of the true pdf, provided that a pattern-dependent effective noise density and noiseless signal value are assumed: all the pdfs estimated from the experimental data are indeed well fitted by this analytic form. Moreover, when nonlinear effects become dominating, the analytic form is still fitting properly the data histograms, showing, however, that the effective noise density increases. In the above regime, we clearly observe that ISI also affects the increase of the effective noise density.
Index Terms—Bit-error ratio (BER), optical fiber
communica-tion, optical noise.
I. INTRODUCTION
H
IGH-CAPACITY optical transmission systems are de-signed by estimating the system performance in terms of bit error ratio (BER), from numerical simulations run in various possible link configurations: as these rely on a limited number of samples, suitable means to extract from these a reliable BER estimation are critically useful [1]. This could be accomplished by knowing the analytical form for the probability density func-tion (pdf) of bit samples in intensity-modulated direct-detecfunc-tion systems, but this is still a debated topic. A proper approximation of the pdf is known only for the linear regime [2], [3], which was also experimentally verified [4].A more general approximation, also valid in the nonlinear regime, was still lacking until recently a novel simplified ap-proach has been presented, which expresses the pdf separating intersymbol interference (ISI) effects and noise effects [5]. Be-cause of ISI, the overall pdf of marks (spaces) is written as a weighted sum of individual pattern pdf [6] and then a common, generalized, and quite simple form is assumed for the pattern pdfs, having two free parameters for each pattern. As an ex-ample, if 3-bit patterns are enough to describe the ISI effect, the
Manuscript received May 26, 2009; revised July 27, 2009. First published September 25, 2009; current version published October 09, 2009. This work was supported in part by Ericsson under a grant.
The authors are with Scuola Superiore Sant’Anna, Pisa 56127, Italy (e-mail: [email protected]).
Color versions of one or more of the figures in this letter are available online at http://ieeexplore.ieee.org.
Digital Object Identifier 10.1109/LPT.2009.2030505
pdfs of 0’s and 1’s ( and , respectively) are obtained as the sum of four functions , where index is the value of the sampled bit and are those of its nearest neighbors (all either 0 or 1) [5], [6]. We highlight that the are then simply given by a two-parameters expression
(1) where is a modified Bessel function and accounts for op-tical and electrical filtering. These pdfs only differ because of the and values, which are the signal noiseless value and the noise effective power (NEP) of the sampled bit: they are the two most critical parameters and include all propagation ef-fects, i.e., both linear and nonlinear. We highlight that both of them do not just depend on the central bit value , as often assumed, but usually depend on the full pattern.
We present here the first experimental verification of this model, therefore an extension of the experimental results pre-sented in [4] to realistic transmission conditions. We introduce an ad hoc setup, based on a recirculating fiber loop, which is designed to isolate the ISI effects, so that each contribution to the final pdf can be effectively isolated. An excellent match between theory and experiment is found in many different realistic conditions. The obtained pattern pdfs agree well with the theoretical assumption, even in the nonlinear regime [at least for BER down to , i.e., far above the working range of common forward error correction (FEC)]. As predicted in [5], in the nonlinear case, the NEP values increases differently in each bit pattern.
II. EXPERIMENT
In order to investigate the individual pattern statistics in a long fiber line, a recirculating fiber loop is used [7], where we continuously collect statistical data about one selected bit out of a given sequence.
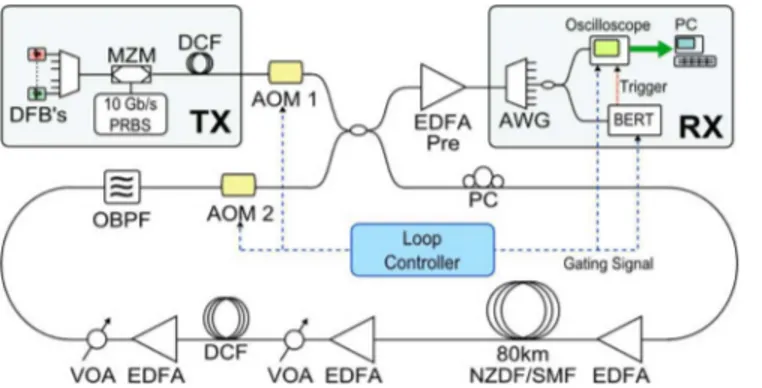
We present the setup in Fig. 1, where only the wavelength-division-multiplexed (WDM) case is reported, for clarity. Optical 10-Gb/s nonreturn-to-zero (NRZ) signals are pro-duced by external intensity modulation at 10 Gb/s [pseudo-random binary sequence (PRBS)] and decorrelated by a short dispersion-compensating fiber (DCF). They are inserted in the loop by means of an acoustooptic modulator (AOM1) and a coupler. The loop includes an erbium-doped fiber amplifier (EDFA), 80-km-long fiber, two other EDFAs with a DCF in the middle, a wide optical filter [(OBPF) 8-nm bandwidth] to
CIARAMELLA et al.: ASSESSING THE NOISE STATISTICS IN COMMON OPTICAL TRANSMISSION SYSTEMS 1583
Fig. 1. Experimental setup (WDM case).
avoid gain peaking, and a final AOM2. The extracted signal is sent to the final preamplifier, after which an arrayed waveguide grating (AWG) selects the channel under test. The output signal is then further split and sent both to a sampling oscilloscope and to a BER tester (BERT). The oscilloscope is equipped with an OC-192 postdetection Bessel filter. In order to collect the sample statistics, a specific technique is used. Both the BERT and the sampling oscilloscope are gated by the loop AOMs controller so that only data from the desired lap are collected. The BERT extracts from the output signal (at the given lap) the pattern sync signal, which triggers the oscilloscope sampler on the first bit of the sequence, thus enabling to visualize any section of the received pattern instead of the eye diagram. Data from the oscilloscope are then stored onto a common personal computer (PC). Data acquisition is performed over long time windows, allowing us to collect a large number of samples to numerically evaluate the pdfs at values as low as . We use the loop setup to test the sample pdf in a wide range of conditions, either single-channel and WDM, with different power levels and fiber types (either nonzero dispersion fiber (NZDF) ps/nm/km, or single-mode fiber (SMF) ps/nm/km, in both cases 80 km long) and using either single channel and WDM signals. At each lap, a DCF com-pensates around 95% (85%) of the SMF (NZDF) chromatic dispersion. A variable optical attenuator (VOA) is used to set a power level at DCF input that makes nonlinear effects in this fiber negligible.
In our measurements, we set the system to operate with a BER value (for optimum threshold) that is in the most interesting re-gion of FEC operation. The BER value is, therefore, lower than , so that it can still be corrected by FEC, and it is also higher than (so that differences in the estimation methods may have a higher impact).
In all these cases, we find an excellent agreement with the conclusions derived by numerical simulations in [5]. In the fol-lowing, we present some of the most significant experiments. As an example, Fig. 2 illustrates some results obtained transmitting a single channel over 720-km SMF (a) and NZDF (b), in the strong nonlinear regime ( dBm). In both cases, we report a section of the bit sequence to which the pdfs correspond and, in the upper part, some of the experimentally estimated pdfs, obtained by processing after collecting 2 samples (for each bit). Arrows and circles indicate the bits in the sequence to which the pdfs correspond. In these insets, the blue dots indicate
Fig. 2. Single-channel transmission over 720 km with 10.5-dBm signal power: traces of a 16-bit section of the signal filling the loop and examples of the ex-perimentally measured statistics on three bits (insets). Fiber type is (a) SMF and (b) NZDF.
the experimentally obtained pdf and the red continuous curves show the theoretical pdfs. This last is plotted using the and values obtained by fitting (1) to the data. In all cases, the agreement between fitting and data is very good, down to probability density, i.e., far below the usual FEC system limit. This clearly shows that the assumed approximation for the is reliable down to quite low probability values (on the order of
). As indicated in [5], if this agreement is firmly assessed, the two pdf parameters could be easily obtained by simulations or experiments, with a very limited number of samples.
In order to have a further insight, the WDM case must be in-vestigated, mostly to test the effect of cross-phase modulation. We thus injected WDM signals into the loop. Because of the complexity of the setup, we limited our analysis to 4 10 Gb/s channels with 100-GHz spacing. Since nonlinear interchannel effects are mostly effective on low dispersion fibers, we used 1040 km of NZDF (13 laps), which, thanks to the high compen-sation ratio, should produce substantial cross-phase modulation. A significant example was obtained considering the 111 pattern, relative to one of the central channels and we report it in Fig. 3. Again we see a good agreement between the ex-perimental pdf and fitting curves, even in the strong nonlinear regime.
In order to better describe the system, and also account for nonlinear effects, we introduce a parameter that may be roughly
1584 IEEE PHOTONICS TECHNOLOGY LETTERS, VOL. 21, NO. 21, NOVEMBER 1, 2009
Fig. 3. PDF for the central mark in a 111 sequence, after WDM transmission over 720-km NZDF (experimental: blue dots; theoretical: red continuous curve). PDF taken in the strong nonlinear regime (20-dBm input power).
Fig. 4. Normalized NEP versus input power for two marks (center of 111 and 010 patterns) and two zeros (center of 101 and 000), in WDM transmission over 1040-km NZDF.
viewed as the inverse of the optical signal-to-noise ratio [5], but it is defined for a specific bit: this parameter is the effective noise density of the bit, normalized by the mean signal power (average over all patterns). When the fitting values are plotted versus the overall power at the input of the NZDF, we see the expected trend: after initial improvement due to linearly reduced noise effects, the normalized noise further grows up because of the nonlinear effects.
We observe here that the effective noise density is signifi-cantly different for each bit in the sequence, particularly in the nonlinear regime. The marks are clearly more affected by the nonlinearity than the zeros, as it may be expected. However, it is also apparent that when at least three consecutive 1’s are
transmitted, the central bit is far more affected by the nonlin-earity than either the side 1’s or the isolated 1’s. In order to de-scribe better this effect, we report in Fig. 4 the measured values of the parameter for the pdfs of four different bits in the sequence, namely a pair of ones and a pair of zeros, either having two 1’s or two 0’s as nearest neighbors (thus they are at the center of the patterns 111, 010, 101, 000, respectively). We see from Fig. 4 that, in the nonlinear regime, the effective noise density in can be more than 2 dB higher than in , as well as more than 4 dB higher for the 0’s pdfs.
III. CONCLUSION
We used an ad hoc loop setup, allowing us to experimentally investigate the pdf of each sampled bit in a sequence. In various conditions (NZDF and SMF, single-channel and WDM), the ex-perimental pdf is very close to the approximation presented in [5].
As additional confirmation, the effective noise density ex-tracted from the data was found quite different on different parts of the sequence, confirming that noise effects are interplaying with ISI. This is particularly apparent when nonlinear effects become stronger: in that case, their impact on the effective noise density can be far different for each bit, critically depending on its own value and that of the close bits.
These results confirm the validity of the approximation pre-sented in [5] (at least in the range of interest for common FEC): this can allow more effective system design, as the main pdf pa-rameters can be obtained from a limited number of simulations (see [5]). Furthermore, a better insight on the signal statistics can help the system designers to devise novel solutions to counteract for noise effects, particularly in the nonlinear regime (either in terms of signal coding or in terms of electronic processing).
REFERENCES
[1] M. Jeruchim, “Techniques for estimating the bit error rate in the simu-lation of digital communication systems,” IEEE J. Sel. Areas Commun., vol. 2, no. 1, pp. 153–170, Jan. 1984.
[2] D. Marcuse, “Derivation of analytical expression for the bit error proba-bility in lightwave systems with optical amplifiers,” J. Lightw. Technol., vol. 8, no. 12, pp. 1816–1823, Dec. 1990.
[3] P. A. Humblet and M. Azizoglu, “On the bit error rate of lightwave systems with optical amplifiers,” J. Lightw. Technol., vol. 9, no. 11, pp. 1576–1582, Nov. 1991.
[4] B. Chan and J. Conradi, “On the non-Gaussian noise in erbium doped fiber amplifiers,” J. Lightw. Technol., vol. 15, no. 4, pp. 680–687, Apr. 1997.
[5] E. Ciaramella, “Effective approach to estimate optical system perfor-mance from numerical simulations,” IEEE Photon. Technol. Lett., vol. 20, no. 20, pp. 1703–1705, Oct. 15, 2008.
[6] C. J. Anderson and L. A. Lyle, “Technique for evaluating system per-formance using Q in numerical simulations exhibiting intersymbol in-terference,” Electron. Lett., vol. 30, pp. 71–72, 1994.
[7] N. Bergano, F. W. Kerfoot, and C. R. Davidson, “Margin measure-ments in optical amplifier systems,” IEEE Photon. Technol. Lett., vol. 5, no. 3, pp. 304–306, Mar. 1993.