PAPER
Cite this: DOI: 10.1039/c4lc00221k
Received 20th February 2014, Accepted 16th April 2014 DOI: 10.1039/c4lc00221k www.rsc.org/loc
An impedance-based flow microcytometer for
single cell morphology discrimination
†
M. Shaker,
‡*
acL. Colella,
‡*
aF. Caselli,
bP. Bisegna
band P. Renaud
aCell shape is a fundamental biological feature, providing specific information about physiological or pathological cellular conditions. Most of the state-of-the-art microfluidic cytometers, however, only allow simple cell analysis, including viability studies, cell counting and sorting. In this work, we present a non-invasive, label-free device capable of single cell morphology discrimination in continuous flow. The device is based on the principle of liquid electrodes, fabricated in a cross configuration around a sensing zone. This arrangement allows measurement of cell impedance along orthogonal orientations and extraction of an index describing cell shape anisotropy. By adding prior to the sensing volume a series of lateral liquid electrodes, the particle stream was focused toward the channel midline and each cell was oriented in a specific direction before shape sensing. We demonstrate the proof of concept by performing spherical and elongated particle discrimination. As an application, we show that the shape changes experienced during cell division can be monitored and characterized. In particular, budding yeasts at different stages of the mitotic cycle were identified by extracting their anisotropy index.
Introduction
Single-cell analysis has been increasingly recognized as the key technology for monitoring of cellular functions, which typically are not accessible from bulk measurements at the population level. A number of single cell analysis methods have been established.1Conventional tools, such as imaging flow cytometry and fluorescence activated cell sorting (FACS), are based on complex methods requiring several cell prepara-tion steps and fluorescent labelling.
In the last decade, single cell analysis has been of interest for major technological advances thanks to the introduction of microfluidic systems based on impedance measurements.2 Impedance is a simple but powerful tool for label-free detec-tion and analysis of single cell dielectric properties, such as membrane capacitance and cytoplasm conductivity. Chip-based cytometers, with lower size and costs, require smaller quanti-ties of materials and have higher analysis rate and throughput
compared to standard benchtop instruments. Moreover, in miniaturized devices, the sensing volumes match the dimen-sions of a single cell, allowing high sensitivity measurements.
In recent years, several microflow cytometry devices have been reported in the literature. In general, micromachined cytometers are constituted by a glass or plastic substrate, on top of which microelectrodes and microchannels are patterned by photolithography techniques.
Two different microelectrode geometries are the most described and used for single-cell analysis. The conventional configuration is based on the integration of microelectrodes at the top and the bottom of the microchannel in which the sample under analysis is injected.3–5Several devices based on this technology have been presented for various applications. White blood cell differentiation and lymphocyte counting in human whole blood have been performed.6,7
Demierre and co-workers have developed a second approach, known as “liquid electrodes”.8,9 This novel device is based on the use of planar electrodes fabricated on the bottom of dead-end chambers placed on the side of the main flowing channel. The application of coplanar microelectrodes sim-plifies the fabrication process and reduces the costs. Although it allows good spatial resolution and increases the measure-ment range, it slightly decreases the sensitivity with respect to the top–bottom electrodes.10 The efficiency of the liquid electrode chip has been proven for label-free detection and sorting of viable and dead cells and infected red blood cells and for synchronization of cell cultures.11–13
aLaboratoire de Microsystemes (LMIS4), Institute of Microengineering, École
Polytechnique Fédérale de Lausanne (EPFL), Station 17, CH-1015 Lausanne, Switzerland. E-mail: [email protected], [email protected]
bDepartment of Civil Engineering and Computer Science, University of Rome
‘Tor Vergata’, 00133 Rome, Italy
cDepartment of Mechanical Engineering, National University of Singapore,
Singapore 117576, Singapore
† Electronic supplementary information (ESI) available. See DOI: 10.1039/ c4lc00221k
‡ These authors contributed equally in this work.
Published on 30 May 2014. Downloaded by ECOLE POLYTECHNIC FED DE LAUSANNE on 02/06/2014 07:52:28.
View Article Online
Recently, the importance of adding the capability of moni-toring cell morphology in addition to standard parameters, such as volume, viability and opacity, has been highlighted.14 Cell shape is strictly related to physiological or pathological cellular conditions. For example, in Sickle-Cell Anaemia (SCA), erythrocytes assume an abnormal, rigid, sickle shape because of the presence of mutated haemoglobin. This abnormal haemoglobin polymerisation leads to cell rigidity and vaso-occlusion and it is central to the pathophysiology of this disease.15In malaria, infected red blood cells swell changing their shape from biconcave to spherical.16
Cell shape changes are particularly important during cell division, or mitosis. During mitotic replication, one cell divides into two or more identical daughter cells. This replication pro-cess involves a cyclical sequence of biological events during which the genetic material is duplicated (during metaphase and anaphase) and segregated (telophase), and the cell undergoes specific volume and morphological changes.
Moreover, shape evaluation of bacteria enables classifica-tion of bacteria based on their shape and can be used for bacterial filamentation analysis. In addition, shape-sensitive flow cytometry can be used for cell deformability measure-ment by analysing cell shape changes in hydrodynamic shear deformation devices to assay cell mechanical properties and to determine the cell state.17
In this work, we show the first integrated microdevice capa-ble of morphology-based cell sensing. A novel configuration of liquid electrodes was designed to perform two-dimensional impedance sensing of single cells. In a preliminary phase, the efficiency of the device was demonstrated by performing spherical and ellipsoidal particle discrimination. The particles were first focused and oriented by dielectrophoretic focusing and electro-orientation. Then two couples of liquid electrodes, placed in a cross configuration around a sensing volume, were used to record the particle-induced current modification along the longitudinal and perpendicular directions. Compar-ing the current signals, an anisotropy index was obtained which describes the spatial distribution of the particle and therefore its morphology.
After demonstrating the proof of concept with model particles, we then used the device to assay the cell cycle pro-gression of budding yeasts. The unicellular budding yeast (Saccharomyces cerevisiae) was chosen for this application since it is a well-known biological model for eukaryotic cell biochemistry and it is robust and shows a characteristic shape during division. Indeed, yeasts grow by budding. The original mother cell gives rise to a spherical daughter cell composed of entirely new material. Mitotic division is initiated when the cell reaches a critical size and enters a pre-synthesis steady state (G1). Then the S-phase starts and DNA synthesis and chromosome replication occur. After the steady phase G2, the cell enters the M-phase during which the chromosomes are separated and divides into two cells.18–20 The bud size is related to the specific phase of division. Cells in the early stage (S) present a bud about 3 μm in diameter, while the mother cells are about 7 μm in diameter. The bud volume
grows during metaphase (G2 and M). In telophase, the bud reaches the same dimensions as that of the mother cells and finally separates forming a new cell.
In this work, cell shape changes were monitored and correlated to a specific phase of mitotic division. Heteroge-neous populations of budding yeasts were analysed and spherical, early-stage division and grown-up yeasts have been distinguished.
Materials and methods
Microfluidic chip design and the working principle
The chip design is based on a modified geometry of liquid electrodes, the working principle of which is described in detail in previous publications.8,9 Briefly, liquid electrodes are planar electrodes fabricated on the bottom of dead-end chambers on the side of the main channel. The insulator guides the field lines in the liquid flowing into the main channel and determines the electric field distribution inside the microstructure. In this work, a novel arrangement is pro-posed to achieve shape sensing. Four liquid electrodes were fabricated in a cross configuration and they were coupled to record two current signals along two directions: longitudinal and perpendicular to the particle flow.
Representations of the device and its working principle are reported in Fig. 1 (also see the ESI,† Fig. S1). Two AC sig-nals were applied to electrode 1 and electrode 3, and the resulting drain currents, denoted by Ixand Iy, were measured
Fig. 1 (a) A picture of the microdevice for single cell shape-based discrimination with details of the focusing/orientation unit and the shape sensing unit. (b) A schematic representation of the device and the working principle. Focusing and orientation are achieved by apply-ing a transverse electric field to the liquid electrodes on the side of the main channel. The particles are repulsed in the midline (y = 0) and focused at the equilibrium position by nDEP. At the same time, they are oriented by induced polarization. In the sensing region, particles are interrogated along two different directions by using two couples of liquid electrodes in a cross configuration. The longitudinal (Sx) and transverse (Sy) current signals are recorded simultaneously.
on electrodes 2 and 4, respectively. At low frequency, a cell passing through the sensing zone creates a barrier to the current flow and induces a current decrease with respect to the basal values, denoted by I0,x and I0,y. To quantify
the effect of the cell shape on the electric signal, we define c (longitudinal current signal) and Sy(transverse current signal)
as Sx= (Ix− I0,x)/I0,x and Sy= (Iy− I0,y)/I0,y. Sxand Syare the
relative variation of the recorded currents along two different directions, respectively: parallel and perpendicular to the par-ticle flow. They were acquired simultaneously and the values were measured when the cell is at the center of the electrode cross (x = 0, y = 0) and compared to obtain the anisotropy index (AI) defined as:
AI = (Sx/Sy)at (x,y)=0 (1)
For spherical cells, this value is expected to be equal to 1. In contrast, ellipsoidal particles will exhibit an AI less than or greater than 1 depending on their shape and their orienta-tion in the sensing region.
The main requirement that guarantees significance and repeatability of the shape sensing is that each cell maintains the same position in the yz plane and the same orientation while passing through the sensing volume. For this purpose, a focusing/orientation region is added prior to the electrode cross, offering the possibility to achieve dielectrophoretic focusing and electro-orientation. This volume is composed of 13 pairs of facing liquid electrodes fabricated along the main channel, as shown in Fig. 1b.
The conjunction of focusing and electro-orientation can be explained by considering the force and the torque acting on an induced dipole moment in a non-uniform electric field which are, respectively, given by the following expressions:21,22
F
¯ = ( p¯·∇)Ē (2) T
¯ = p¯× Ē (3) The net force is due to the electric field gradient, whereas the torque is given by the vector product of the dipole moment, p
¯, and the electric field,Ē. In this specific case of study, the dipole moment is equal to:
p
¯ = 4πVεm*(ω) fCMĒ (4)
where fCMis the Clausius–Mossotti factor, which is given by:
f n CM p m m p m
* * * [ * * ] (5)andεm* and εp* are the complex permittivity of the medium
and the particle, respectively,ω is the angular frequency and n is the depolarization factor.
The net force acting on the particle in a non-uniform electri field is known as the dielectrophoretic (DEP) force and is extensively described in a previous publication.9 It is
proportional to the fCM. If in a certain frequency range
the particle is more polarizable than the medium, Re( fCM) is
positive and therefore the particle is attracted to the region of high field density (pDEP, positive dielectrophoresis). In contrast, particles less polarizable than the medium show negative Re( fCM), and they are repulsed from the
high electric field region; this regime is known as negative dielectrophoresis (nDEP). In this work, nDEP was used to focus the particles toward the midline channel (i.e. y = 0) where the low field region is located (Fig. 2, top view).
Eqn (3) explains the electro-orientation phenomenon. The external electric field exerts a torque on the non-spherical particle that is related to the different spatial com-ponents of the induced dipole moment, depending on the Clausius–Mossotti factors and the depolarization factors n along x, y and z:
p¯ = ( pxpypz) = 4πVεm*(ω)( fCM,xEx, fCM,yEy, fCM,zEz) (6)
where V is the particle volume.
A spherical particle presenting three identical axes will experience no net torque. In contrast, an ellipsoidal particle will show a preferred orientation direction, which can be evaluated by considering the largest torque component or by
Fig. 2 Simulation of the electric field in the DEP focusing/orientation section performed using COMSOL Multiphysics version 4.3a. The AC/DC> Electric Currents (ec) module is used to simulate a 3D system with a domain consisting of 4 pairs of liquid electrodes, which have a dimension of 40μm and are placed on the bottom of lateral channels. The main channel is 40μm wide, 20 μm high and 440 μm long; the lateral channels, 40μm wide, are 40 μm apart from each other. The entire volume is filled with PBS (σ = 1.6 S m−1andεr= 80). The electric field is simulated at an applied potential of 8 V to the opposite electrode across the main channel. Apart from the electrodes, all boundaries were electrically insulated. (Top view) In the focusing/orientation region, an opposite electric potential between the facing liquid electrodes allows particle focusing in the channel midline where the electric field lines are less dense (DEP focusing effect). Non-spherical particles are oriented by electro-orientation with the longest axis parallel to the electric field and perpendicular to the flow direction. (Side view) The liquid electrodes maintain a homogenous electric field distribution in the vertical direction along the channel and in the center of the sensing region.
looking at the maximum fCMcomponent along x, y, z. For a
given frequency, there is a unique stable orientation. In the case of an ellipsoidal particle suspended in a medium, with frequency independent dielectric properties, the longest axis is always oriented parallel to the field. In this work, the elec-tric field was applied between the facing liquid electrodes (Fig. 2), so that the resulting field lines are perpendicular to the flow direction, and the ellipsoidal particles aligned consequently.
The use of liquid electrodes allows the control of the verti-cal position. As shown in Fig. 2 (side view), the distribution of the field lines is constant in the vertical plane along the channel in the focusing/orientation region and in the center of the sensing cross. The perturbation of the cells to the field lines creates an additional nDEP effect, which forces the cells to assume and maintain a vertical equilibrium position at z = h/2, where h is the channel height, (see the ESI,† Fig. S2). Fabrication
The production of the microfluidic device is based on two-masks fabrication. The detailed process is described else-where9 and briefly reported here. The fabrication starts with the deposition of a metal layer on a 4′′ float glass wafer. This layer consists of 20 nm of titanium acting as the adhesion layer and 200 nm of platinum as the active material. The electrodes were structured in this double layer by a lift-off process. The fluidic network was fabricated on top of the electrodes by photolithography of a 20 μm thick SU8 layer. The microfabrication of the microfluidic platform ends with the dicing of the wafer into sixteen single devices.
A single chip contains microchannels, which are open on the top. The fluidic network was then sealed using a PDMS (polydimethylsiloxane) element and a plastic block. All of the elements were bonded together in a sandwich-like structure by exerting mechanical pressure. The handling of fluids in the microchannels was performed using an external syringe pump system (Mirus EVO Nanopump, Cellix Limited). The PDMS block and the chip were treated with oxygen plasma (0.1 s, 100 W, 0.6 mbar) prior to use to make them tempo-rarily hydrophilic.
Experimental setup
The microfluidic device was mounted on a board providing connections to the external instrumentation, which comprises two main blocks for the focusing/orientation and sensing regions. The electric field controlling the DEP focusing and electro-orientation was obtained by applying a potential difference to the opposite metal electrodes. A function generator was used to create the original signal, which passes through a dedi-cated printed circuit board composed of two symmetrical electronic circuits containing an operation amplifier and an inverter. This setup provides a ±4 V voltage (40 kHz) applied to the opposite electrode across the main channel.
The impedance analyser HF2IS (Zurich Instruments) was used to acquire the shape-related signals Sx and Sy. Two
independent channels were used to monitor the two current signals independently. A transimpedance amplifier (HF2TA, Zurich Instruments) was also used. A low voltage of 100 mV was applied to the sensing electrodes to avoid cell damage during the morphology sensing. Frequencies of 427 kHz and 533 kHz were used, respectively, for channel 1 and channel 2 (corre-sponding to Sxand Sy). The filter bandwidth was set to 1 kHz,
meaning that one cell each 10 ms can be analysed.
When the system was ready, the cells were loaded into the reservoir and the external syringe pump was connected to the inlet of the microchannel. The sample was driven through the microchannels typically at 90 nl s−1. As the sample flows within the sensing zone, the data are saved in the PC. The microfluidic device was placed on the XYZ translation stage of an inverted microscope and a computer-controlled camera was mounted on the microscope to allow image/video recording.
Yeast culture and sample preparation
Yeast cells (Saccharomyces cerevisiae) were obtained in a local grocery. For the proof of concept and calibration measure-ments, SU8 rods (length 20μm and width 5 μm) and spherical polystyrene beads (8 μm in diameter, Duke Scientific) were suspended in Phosphate Buffered Saline (PBS,σ = 1.6 S m−1 and εr = 80) and injected into the microdevice. For division
stage monitoring, the yeast cells were cultured at 23 °C in YPD liquid medium for 4 hours to obtain budding yeasts. The medium was supplemented with 0.1% w/w BSA (Bovine Serum Albumin) to reduce sticking to the channel walls.
Data analysis
Longitudinal and transverse current signal amplitudes were recorded in real-time by the software ziControl of the HF2IS (Zurich Instruments). The data were then post-processed by using a MATLAB script to extract the signals' main features and calculate the anisotropy index. First, the raw data were subjected to a filtering algorithm for noise cancelation. Then, the local maximum and minimum in longitudinal and trans-verse signals, respectively, were detected. They were obtained when the cell was at the center location of the measurement cross, (see section “Morphology discrimination capability: proof of concept”). The corresponding values of Sx and Sy
were calculated by extracting their magnitude with respect to the current signal baseline (I0,x and I0,y). The anisotropy
index was calculated as:
AI = (Sx/Sy)at (x,y)=0 (7)
Results and discussion
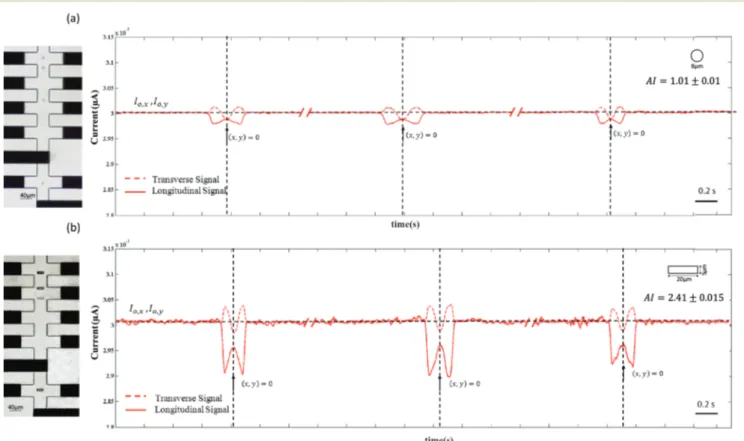
Morphology discrimination capability: proof of concept A preliminary test was performed to validate the cell shape discrimination capabilities of the proposed device. For this purpose, spherical polystyrene beads (8μm in diameter) and rods (length 20μm and diameter 5 μm) were compared.
A low frequency signal (40 kHz) of 4 Vpp was applied
between the facing liquid electrodes in the focusing/orienta-tion volume. These signals focus the particles towards the channel midline by lateral negative dielectrophoresis, as pre-viously described. Moreover, a torque acts on the rods that are oriented with their longest axis parallel to the electric field lines and perpendicular to the flow (Fig. 3b). Mor-phology sensing was achieved by applying two AC signals (533 kHz and 427 kHz and an amplitude equal to 100 mVpp) to
the excitation electrodes of the two channels. The resulting current signals Ixand Iywere simultaneously recorded using a phase
sensitive demodulator and amplified (see the ESI,† Fig. S1). The typical longitudinal and transverse current signals for spherical beads and rod shaped particles are shown in Fig. 3a and b. Both signals present the same qualitative behaviour, which can be generally explained by consider-ing the electrical hindrance effect of an insulatconsider-ing particle immersed in an electric field and the resulting current varia-tion. As the particle enters the sensing zone, the longitudinal current signal, Ix, decreases because of the hindrance of
the particle. The maximum change occurs at the entrance of the cross and creates a local minimum in the signal. A local maximum is achieved when the particle is at the center of the cross (x, y = 0) where the sensing volume is higher and the effect of the particle on the channel impedance is weaker.
The main effect on the transverse current signal Iyis
mini-mum at the cross center, where the electrical impedance of the particle causes the maximum hindrance effect on the electric field distribution. As a consequence of the electrode connection configuration, part of the current applied to electrode 1 was recorded by the transverse electrodes 3 and 4. This results in the increase of Iywhen the particle enters the
sensing region (see the ESI,† Fig. S3). At the center of the sensing zone, (x, y = 0), the local minimum of the transverse current signal and the local maximum of the longitudinal current signal are coincident for spherical particles; due to the longitudinal and transverse symmetry of the sensing region, an identical current reduction in both longitudinal and trans-verse current signals is expected for a spherical object. In con-trast, a mismatch is visible between these two signals for the rods. A non-spherical particle induces anisotropic variation of the current field lines, and therefore, a difference between the longitudinal and transverse current signals is observed. The shape of the signals conveys qualitative information on the object morphology, which can be quantified by extracting the anisotropy index (AI) by comparing the longitudinal and the transverse signals at x = 0. Different AI values describe parti-cles with different morphologies (see the ESI,† Fig. S4).
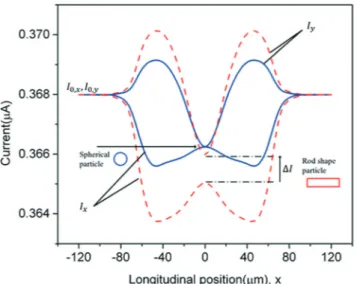
Fig. 4 shows the simulated current signals of a sphere particle and a rod shape particle flowing through the sensing
Fig. 3 (a) Longitudinal and transverse current signals of (a) 5μm spherical beads and (b) rod shaped particles (diameter: 5 μm, length: 20 μm) flowing with the main axis perpendicular to the flow. For the beads, the local maximum and minimum peaks of longitudinal and transverse signals, occurring at the sensing position (x, y = 0), are equal in magnitude due to their spherical shape. Observing the rod signals, there is a difference between the longitudinal and transverse peaks: the magnitudes of longitudinal signal changes are greater than those of the transverse signals due to their particular rod shape and orientation in the sensing zone.
volume (COMSOL Multiphysics). These results confirm the experimental observation previously reported in Fig. 3. Moreover, the numerical simulations establish that the anisotropy index is rather insensitive to the object volume, while the magnitude of the signals varies proportionally to it. The volume independency makes this device extremely robust and applicable to morphology analysis of generic cell populations. It provides significant results about the AI distribution even if the original population shows an inter-nal physiological heterogeneity. A comprehensive theoreti-cal characterization of the device is published elsewhere.23
System calibration with spherical particles and cells
Several experiments were performed using spherical polysty-rene beads and yeast cells to calibrate the device and to define a specific experimental and data analysis protocol for AI extraction.
As described in the previous section, the particles were focused by nDEP and then transverse and longitudinal cur-rent signals were recorded when the particle passed through the sensing position (x = 0, y = 0, z = h/2).
Samples of about 100 particles were analysed. The particle velocity is equal to 1 mm s−1. The results are reported in Fig. 5. The histograms show the number of analysed particles and their corresponding anisotropy index distribution. The AI can be described by a normal distribution centered around 0.98 ± 0.063 and 1.01 ± 0.058 for spherical beads and yeast cells, respectively. The standard deviation, although quite low, could be due either to the transverse off-centering of a few particles or to the electrical noise in the system. Indeed, during the experiments, cell debris or small contaminations could affect the focusing position and deviate the particles from the channel midline.
Discrimination of the budding yeasts' division stage
To demonstrate the morphology discrimination capability of the microcytometer, mitotic division of budding yeasts was monitored. Budding yeasts divide by forming a bud, which increases in size according to the cycle stage and finally forms a new independent daughter cell.
The dividing yeast sample was prepared by suspending the cells in YPD at 23 °C. At this temperature, yeasts need about 4 hours to start and complete one cell cycle. Therefore, experiments were performed 2 and 4 hours after the suspen-sion of cells. Optical observation shows that after 2 h the
Fig. 4 Simulation of transverse and longitudinal signals for a spherical particle and a rod shaped particle. The theoretical signals confirm the behaviour of the experimental ones. For a sphere, the minimum and maximum peaks of transverse and longitudinal current signals are equal in magnitude; a difference between the two peaks is observed for a rod shaped particle.
Fig. 5 Histogram of the anisotropy index, AI, of (a) beads and (b) yeast cells. Both beads and yeasts are spherical particles and the AI is described by a normal distribution centered at 0.98 and 1.01 for the beads and yeasts, respectively. The standard deviation is equal to 0.063 and 0.059 for the beads and yeasts, respectively.
sample contains mostly early stage division yeasts (bud diameter: 3μm), whereas after 4 h the sample is mostly composed of grown-up buds (bud diameter of around 7μm).
In the first section of the device, yeasts were focused toward the midline and oriented with the long axis perpen-dicular to the flow direction. In the sensing area, transverse and longitudinal current signals were simultaneously mea-sured, while transit of the cells was recorded in a video. To facilitate cell observation, the tests were performed at a relatively low flow speed, equivalent to a cell velocity of 250μm s−1. A statistical analysis was performed to extract the AI values of the obtained signals. Moreover, the videos were analysed to correlate each recorded signal to the correspond-ing bud stage.
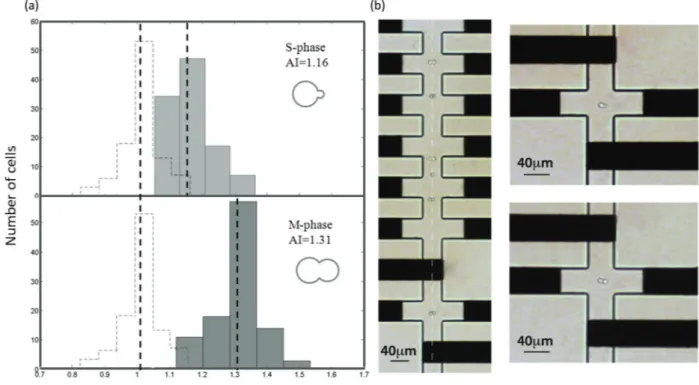
Two data distributions were obtained. The first set describes the anisotropy index of cells in the S-phase of the division cycle, which presents a small bud with a relative diameter between 0 and 0.3 (the relative radius is defined as the ratio between the daughter cell radius and the mother cell radius). The second data series includes all of the signals corresponding to the cells with relatively large budded cells which progressed to the M-phase, presenting a bud with a relative diameter greater than 0.7.
The results are shown graphically in Fig. 6, where the indi-vidual histograms of the two cell cycle stages are depicted
and compared with the distribution of spherical yeasts. As shown in the figure, the anisotropy index clearly depends on the bud size and therefore on the division stage. The AI of spherical yeast cells in the pre-division phase (G1), unbudded cells, is 1.01. The AI of cells entering the S-phase and initiat-ing bud formation is equal to 1.16, whereas cells in the late M-phase showing a grown-up bud present an AI of 1.31.
These results demonstrate that the extraction of the cell anisotropy index allows quantification of the relative size of the mother and daughter cells and therefore, the determina-tion of the budding yeasts' cycle stage. As can be seen in Fig. 6, the early-stage and grown-up distributions are clearly separated. However, they partially overlap and they are char-acterized by a standard deviation equal to 0.07, slightly higher than the one relevant to the spherical particles. The main source affecting the variance distribution is the physio-logical asynchrony of cell divisions. The bud formation does not occur at the same time for all the cells. For example, opti-cal observation of the 2 h-old sample shows that, although a large cell percentage is constituted by early stage buds, few spherical yeast cells are present as well as elongated single yeasts that are not yet forming the bud but they are entering the S-phase. Some experimental problems, such as cell off-centering can also contribute to the distribution, as previously explained.
Fig. 6 Histogram of the anisotropy index of S-phase cells and M-phase cells; the histogram of non-dividing cells, AI = 1.01, is also plotted with a dashed line, which allows comparison of data from different cell stages. (a) For dividing yeasts, the AI is greater than 1, indicating the particle anisotropy and the presence of buds. The bud dimensions increase according to the division stage. During the S-phase of the cell cycle, bud sizes are about 3μm in diameter, and the resulting AI is equal to 1.16. This value increases to 1.31 for the larger bud, M-phase cells, showing a daughter cell equal in size to the mother cell (about 7μm in diameter). The distribution is clearly separated, expect for partial overlapping due to the distri-bution standard deviation (0.07). (b) A picture of the M-phase cell population flowing in the device during shape sensing (left) and details of the early-stage and grown-up dividing yeast cells at the center of the cross-shaped electrodes (right). The orientation and the focusing of the cells can be observed.
Conclusions
In the last years, several microfabricated flow-cytometers have been presented in the literature which have been used for cell counting, sorting and impedance-based analyses. These devices allow label-free, fast and low cost monitoring of the cells' physiological and pathological state, and their efficiency has been extensively demonstrated. Although the importance of providing information about cell morphology has been recently discussed, conventional microelectrode-based cytometers lack the shape-discrimination capability.
In this work, we present a micromachined cytometer able to perform cell shape sensing. The device is based on the modi-fied liquid electrode geometry to interrogate cells in different spatial directions and to obtain an index describing the particle anisotropy (anisotropy index). This configuration was chosen since it allows fabrication simplification as well as high sensi-tivity at low frequency and easy experimental manipulations.
Two couples of liquid electrode were built in a cross con-figuration in a sensing zone and used to record the cell-induced variation of transverse and longitudinal current sig-nals. The analysed cells were focused and oriented before reaching the shape-sensing zone. By using several couples of facing liquid electrodes distributed along the main channel prior to the sensing volume, nDEP and electro-orientation were achieved simultaneously.
We demonstrated the efficiency of the device by discrimi-nating the division stage of budding yeasts. The bud size is strictly correlated to the mitotic cell cycle. In a mixed popu-lation, spherical yeasts, cells in the S-phase and cells in the M-phase can be easily distinguished by extracting the corre-sponding anisotropy index. The achievable analysis rate is several tens of cells each second, maintaining constant verti-cal and horizontal focusing and orientation.
The efficiency of the device and the validity of the experimen-tal results were confirmed by theoretical analysis of the device.23 This innovative system represents a significant step for-ward in the state-of-the-art microcytometers' development. Morphology sensing in parallel with viability monitoring and counting significantly enhances the discrimination capabili-ties of modern cytometers. We foresee several applications of the presented device. For example, morphology discrimina-tion has a fundamental importance in haematology and blood cell analysis, since the erythrocyte shape is strongly affected by pathological conditions. Moreover, cell division monitor-ing is a second interestmonitor-ing application scenario. Eukaryotic cell mitosis is in fact the subject of intense investigations and, at the moment, simple, label-free non-invasive methods for cell division monitoring are not extensively available.
Acknowledgements
We wish to thank Dr. Thomas Braschler and David Bonzon from Microsystem Laboratory 4 (LMIS4, EPFL) for the discussion and the help in preparing and optimizing the electronic mea-surement setup. Thanks are due to Dr. Greg Elliot from the
Nano Research Group (Southampton University) for providing us the SU8 rods and to the Maerkl group (EPFL) for the YPD medium.
This work was partially supported by the FP7 DIMID project, “Development of Innovative Microfluidic Impedance-based Devices” (FP7-SME-2011-1: Research for SMEs, GA 286692), funded by the European Community.
Moreover, M. Shaker gratefully acknowledges the National University of Singapore and the Singapore International Graduate Award (SINGA) for financial support.
Notes and references
1 H. M. Shapiro, Practical Flow Cytometry, John Wiley & Sons, Inc, Hokoken, New Jersey, 2003.
2 K. C. Cheung, M. Di Berardino, G. Schade-Kampmann, M. Hebeisen, A. Pierzchalski, J. Bocsi, A. Mittag and A. Tárnok, Cytometry, Part A, 2010, 77, 648–666.
3 S. Gawad, L. Schild and P. Renaud, Lab Chip, 2001, 1, 76–82. 4 S. Gawad, K. Cheung, U. Seger, A. Bertsch and P. Renaud,
Lab Chip, 2004, 4, 241–251.
5 H. Morgan, T. Sun, D. Holmes, S. Gawad and N. G. Green, J. Phys. D: Appl. Phys., 2007, 40, 61–70.
6 D. Holmes and H. Morgan, Anal. Chem., 2010, 82, 1455–1461. 7 D. Holmes, D. Pettigrew, C. H. Reccius, J. D. Gwyer, C. Van Berkel, J. Holloway, D. E. Davies and H. Morgan, Lab Chip, 2009, 9, 2881–2889.
8 N. Demierre, T. Braschler, P. Linderholm, U. Seger, H. Van Lintel and P. Renaud, Lab Chip, 2007, 7, 355–365.
9 N. Demierre, T. Braschler, R. Muller and P. Renaud, Sens. Actuators, B, 2008, 132, 388–396.
10 G. Mernier, E. Duqi and P. Renaud, Lab Chip, 2012, 12, 4344–4349. 11 G. Mernier, N. Piacentini, R. Tornay, N. Buffi and P. Renaud,
Procedia Chem., 2009, 1, 385–388.
12 E. M. Nascimento, N. Nogueira, T. Silva, T. Braschler, N. Demierre, P. Renaud and A. G. Oliva, Bioelectrochemistry, 2008, 73, 123–128. 13 A. Valero, T. Braschler, A. Rauch, N. Demierre, Y. Barral and
P. Renaud, Lab Chip, 2011, 11, 1754–1760.
14 F. Caselli, P. Bisegna and F. Maceri, J. Microelectromech. Syst., 2010, 19, 1029–1040.
15 D. C. Rees, T. N. Williams and M. T. Gladwin, Lancet, 2010, 376, 2018–2031.
16 A. F. Cowman and B. S. Crabb, Cell, 2006, 124, 755–766. 17 D. Gossett, H. Tse, S. Lee, A. Clark and D. Di Carlo,
Deformability cytometry: high-throughput, continuous measurement of cell mechanical properties in extensional flow, Groningen, Netherlands, 2010.
18 I. Herskowitz, Microbiol. Rev., 1988, 52, 536–553. 19 L. H. Hartwell, Bacteriol. Rev., 1974, 38, 164–198.
20 K. Kaizu, S. Ghosh, Y. Matsuoka, H. Moriya, Y. Shimizu-Yoshida and H. Kitano, Mol. Syst. Biol., 2010, 6.
21 G. Schwarz, M. Saito and H. P. Schwan, J. Chem. Phys., 1965, 43, 3562–3569.
22 R. D. Miller and T. B. Jones, Biophys. J., 1993, 64, 1588–1595. 23 F. Caselli, M. Shaker, L. Collela, P. Renaud and P. Bisegna, J. Microelectromech. Syst., 2014, DOI: 10.1109/JMEMS.2014.2325979.