BOTEC
ANALYSIS
A multi-disciplinary study into the drivers of smoking cessation in Australia
Editors and authors: Alberto Aziani, Carlotta Carbone, Serena Favarin, Samuele Corradini
ISBN: 978-88-99719-23-4
Suggested citation: Aziani Alberto, Carlotta Carbone, Serena Favarin, Samule Corradini (eds.), 2020, A
multi-disciplinary study into the drivers of smoking cessation in Australia. Milan: Transcrime – Università Cattolica del Sacro Cuore and BOTEC Analysis.
© BOTEC Analysis 2020 All rights reserved
No part of this publication may be reproduced, stored in a retrieval system or transmitted in any form or by any means electronic, mechanical, photocopying, recording or otherwise, without the prior written permission of the authors.
A multi-disciplinary study into the drivers of smoking cessation in Australia was prepared under contract with BOTEC Analysis within the framework project A multi-disciplinary investigation into the drivers for smoking cessation in five countries with ANDS markets funded by the Foundation for a Smoke Free World. Grant principals: James E. Prieger, Professor at Pepperdine School of Public Policy and senior researcher at BOTEC Analysis and Samuel C. Hampsher, Managing Director at BOTEC Analysis.
Preface
Smoking is one of the main risk factors for health. Tobacco consumption contributes to a variety of non-communicable diseases, including cancer, heart disease, stroke, chronic respiratory diseases, and diabetes. The WHO (2019) estimates that tobacco consumption is the leading cause of death for smokers; about one in every two smokers dies from smoking-related causes every year. Approximately eight million people a year die from diseases associated with smoking. In response to this, over the past four decades, numerous countries have introduced successful tobacco control policies, which have resulted in longer and healthier lives for their population. Since 2000, Australia, United Kingdom, Sweden and Canada have reduced their smoking prevalence by more than 40%, while Colombia, Norway, and Iceland have done so by more than 50%. Despite this, smoking persists, even in those countries where policies have been implemented, and especially among more disadvantaged social groups. Moreover, smoking reduction policies in other countries have hitherto not been as successful. Indeed, smoking rates in Egypt, Oman, Morocco, and Croatia have steadily increased from 2000 onwards.
The relatively long history of smoking cessation policies allows for a better understanding of what works, what does not, why, and how. Today, policy-makers seeking to further reduce the morbidity and mortality associated with tobacco smoking can learn from the experiences of countries that have succeeded in reducing smoking. However, the social, cultural, and regulatory complexity of smoking habits prevents any straightforward replication of successful policies within a different context, a different country, and a different period. Simply put, no law exists in a vacuum; rather, manifold factors simultaneously determine the success or otherwise of any policy. Yet, sound scientific research and reasoning do allow for the construction and verification of hypotheses and theories about how to replicate cessation elsewhere. Above all, the development of this knowledge will be of particular value for those nations that do not have successful histories of tobacco control; these are very often developing nations in which the vast majority of the world’s smokers currently reside (World Health Organization, 2019).
Australia constitutes an ideal case-study through which to achieve this aim. This is because Australia is recognized as a leading country in tobacco control worldwide, due to its long history of tobacco control policies having lowered smoking prevalence over the years. This success was achieved via the combination of strict anti-tobacco regulations and strong social sensitization through enduring anti-smoking campaigns. At the same time, Australia represents a paradoxical situation, insofar as people have easier access to nicotine through traditional tobacco products than they do via the use of Electronic Nicotine Delivery Systems (ENDS), despite the latter being significantly less harmful to health than the former. These features, combined with the abundance of empirical studies on the country, allow for a sound and comprehensive policy analysis.
Adopting a rational approach to the analysis of policy experiences is critical for providing concrete guidance on how to reduce smoking. In this respect, policy-makers have to walk a delicate line that involves carrying out careful study prior to the enactment of new laws, alongside displaying evidence-based regulatory flexibility in implementing and enforcing these laws. The potential consequences from cutting funding to anti-smoking media campaigns, banning certain products, or increasing taxes, should be weighed
carefully to best serve the public interest for both current citizens and future generations. In the field of smoking policy, too often positions become polarized along ideological lines instead of being based on empirical evidence. Ordinarily, there is the argument between, on the one hand, the abstinence approach— from those who want nicotine to be completely banned because of the damage smoking poses to health— and, on the other, the harm reduction approach—from those who recognize the fact that some people still smoke despite all the adopted measures. The need to move beyond ideological positions and adopt a more pragmatic approach is particularly pertinent with respect to ENDS, which lie at the core of the present study.
Table of contents
List of Abbreviations ... i
List of tables ... ii
List of figures ... iii
Executive Summary ... 1
Background ... 1
Current study ... 2
Key messages ... 3
Effectiveness of Australia’s smoking-related policies ... 3
General lessons learned from the Australian case study ... 4
Emerging Policy Implications ... 5
I.
Introduction ... 8
II.
Timeline ... 11
III.
Methodology ... 14
A. Trend analysis of selected drivers ... 14
B. Structured literature review ... 16
C. Media coverage analysis ... 18
IV.
National Profile ... 24
A. History of tobacco in Australia ... 24
B. Trends in tobacco consumption in Australia ... 30
C. Regulatory authorities in Australia ... 41
1. The Department of Health of the Commonwealth ... 41
2. The Ministerial Drug and Alcohol Forum (MDAF) ... 42
3. Australian Taxation Office (ATO) ... 42
4. Australian Border Force (ABF) ... 43
5. Australian Competition and Consumer Commission (ACCC) ... 43
6. WHO Framework Convention on Tobacco Control ... 44
D. Tobacco control and related policies in Australia ... 44
1. Smoke-free environments ... 44
2. Plain pack legislation ... 46
3. Health warnings ... 47
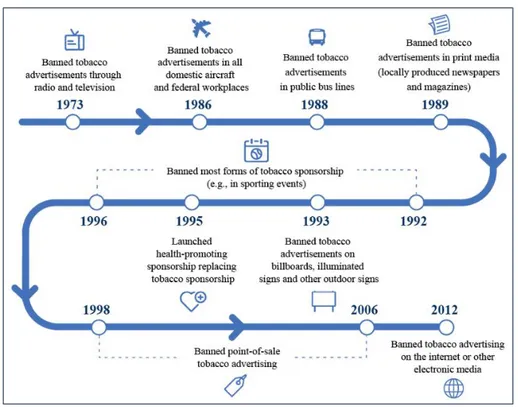
4. Advertising bans ... 49
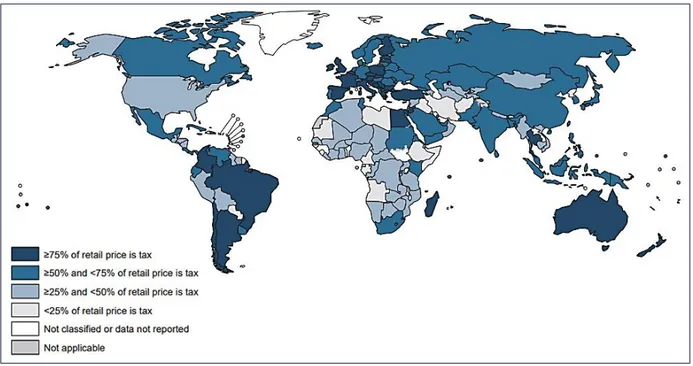
5. Taxation ... 52
6. Alternative Nicotine Delivery Systems regulation ... 54
7. Illicit tobacco regulation ... 56
8. Other policies... 57
10. Anti-smoking media campaigns ... 57
E. Role of Health Services in providing cessation support ... 58
V.
Literature Review ... 61
VI.
Descriptive Statistics ... 64
A. Consumption ... 64
B. Consumption by gender ... 66
C. Consumption by age group ... 68
D. Consumption by income ... 70
E. Consumption by ethnic group ... 72
F. Consumption by region ... 74
G. E-Cigarette use ... 77
H. E-Cigarette use by gender and age group ... 79
I. Cessation ... 81
J. Cessation by gender ... 85
K. Cessation by age group ... 87
L. Cessation by income ... 88
M. Cessation by region ... 90
VII.
Analysis and Findings ... 92
A. Conceptual framework ... 92
B. Trend analysis on selected drivers ... 94
1. Taxation and prices ... 94
2. Anti-smoking campaigns ... 97
3. Smoking cessation medications ... 98
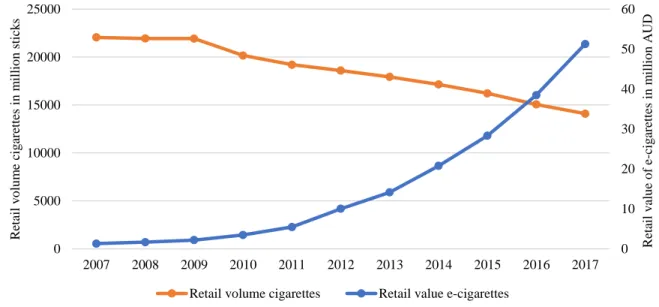
4. E-cigarettes and other ANDS ... 99
C. Structured literature review ... 101
1. Macro-level factors ... 101
2. Meso-level factors ... 109
3. Micro-level factors ... 110
4. Individual-level factors ... 111
D. Media coverage analysis ... 115
1. Tobacco and ANDS/ANNDS related issues ... 116
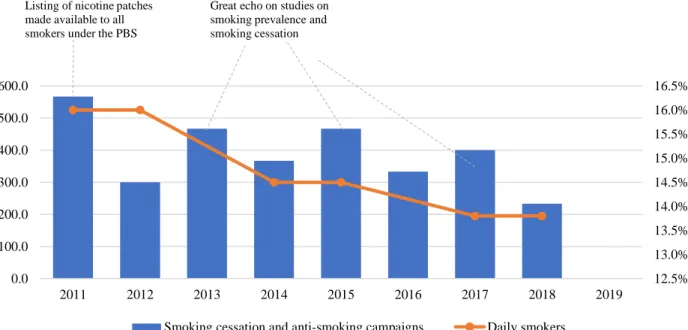
2. Smoking cessation and anti-smoking campaigns ... 118
3. Tobacco control laws ... 119
4. Health issues ... 120
5. Vaping products ... 122
VIII.
Emerging policy implications ... 125
B. Conduct regular and frequent anti-anti-smoking campaigns ... 125
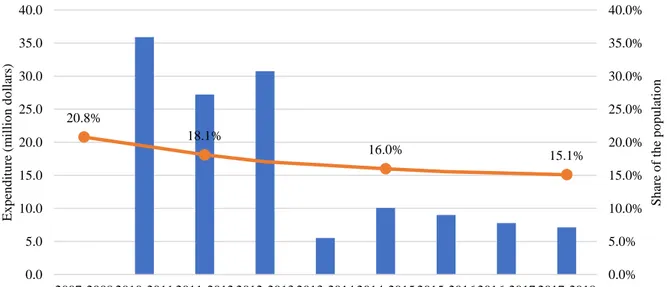
C. Evaluate the short-term and long-term effects of policies ... 126
D. Renew policies that are losing their effectiveness ... 127
E. Design anti-smoking campaigns to better target the most vulnerable populations ... 127
F. Relax regulation of ANDS ... 128
IX.
Conclusions ... 130
References ... 133
Authors’ bios ... 166
Annexes ... 167
Annex 1 – Timelines ... 167
Annex 2 – Query used to extract studies from PubMed ... 178
Annex 3 – References of the studies included in the structured literature review ... 179
Annex 4 – Summary of the studies included in the structured literature review ... 184
Annex 5 – Queries used to extract media news ... 251
Annex 6 – Distribution of the overall population and selected sample for each topic (media
coverage analysis) ... 253
Annex 7 – Description of Key Data Sources ... 257
A. Official public statistics ... 257
1. Australian Institute of Health and Welfare ... 257
2. Australian Bureau of Statistics ... 258
3. Australian Government Department of Finance ... 259
4. Australian Government Department of Health ... 259
5. World Health Organization ... 260
B. Peer reviewed literature ... 260
1. PubMed ... 260
C. Media repositories ... 260
1. LexisNexis ... 261
D. Market research data providers ... 261
i
List of Abbreviations
ABF Australian Border Force ABS Australian Bureau of Statistics
ACCC Australian Competition and Consumer Commission AIHW Australian Institute of Health and Welfare
ANDS Alternative Nicotine Delivery Systems ANNDS Alternative Non-Nicotine Delivery Systems AUD Australian Dollars
ENDS Electronic Nicotine Delivery Systems ENNDS Electronic Non-Nicotine Delivery Systems GHO Global Health Observatory
ITTF Illicit Tobacco Taskforce
MDAF Ministerial Drug and Alcohol Forum NDSHS National Drug Strategy Household Survey NGO Non-Governmental Organization
NHS National Health Survey NRT Nicotine Replacement Therapy NSW New South Wales
POS Point-Of-Sale
PBS Pharmaceutical Benefits Scheme SES Socio Economic Status
TISP Tobacco Industry Stabilization Plan VAT Value-Added Tax
ii
List of tables
Table 1. Variables used in the trend analysis ... 15
Table 2. Included and excluded studies ... 17
Table 3. Characteristics of the included studies ... 17
Table 4. Overall and stratified samples for each topic, 2011-2020 ... 19
Table 5. Classification process for the categories of each topic ... 20
Table 6. Results of the classification process for each topic, 2011-2020 ... 21
Table 7. Estimates of the related articles for the overall population, 2011-2020 ... 22
Table 8. Key dates in the history of tobacco and anti-tobacco in Australia... 167
Table 9. Main anti-smoking mass media campaigns in Australia, 1972-2019 ... 175
Table 10. Query used to extract media news for the topics “Tobacco product and ANDS/ANNDS related issues”, “Negative, positive, and neutral views about vaping products” and “Smoking cessation and anti-smoking campaigns” ... 251
Table 11. Query used to extract media news for the topic “Health problems associated with combusted tobacco and ANDS/ANNDS”... 251
iii
List of figures
Figure 1. Prevalence of regular smokers (aged 18 years or older) in Australia, 1980-2018 (available estimates) ... 12 Figure 2. Pituri plant ... 25 Figure 3. Prevalence of current tobacco smokers aged 15 years or older, 2018 ... 31 Figure 4. Prevalence of current smokers, daily smokers, ex-smokers and people who have never smoked aged 14 years or older in Australia, 1991-2016 (available years) ... 32 Figure 5. Prevalence of current smokers and daily smokers aged 15 years or older in Australia, 2014-2015 and 2017-2018 ... 32 Figure 6. Prevalence of daily smokers aged 18 years or older in Australia, 1995-2018 (available years) ... 33 Figure 7. Prevalence of daily smokers and people who have never smoked aged 14 years or older by gender in Australia, 2001-2016 (available years) ... 34 Figure 8. Average number of cigarettes smoked per week by smokers aged 14 years or older in Australia, 2001-2016 (available years) ... 35 Figure 9. Sales of manufactured cigarettes and all tobacco products in tons in Australia, 1920-2010 (available years) ... 36 Figure 10. Australian cigarette market: retail volume (million sticks) and value (millions AUD), 2003-2022 (forecasts from 2018 expressed in dots) ... 36 Figure 11. Australian cigarette market: legal and illegal volume sales (million sticks) in Australia, 2002-2019 ... 37 Figure 12. Consumption of licit and illicit tobacco products (million kg) in Australia, 2007-2018 (selected years) ... 38 Figure 13. Prevalence of current smokers of unbranded tobacco aged 14 years or older in Australia, 2007-2016 (available years) ... 39 Figure 14. Percentage of sales of tobacco in different forms by weight in Australia, 1925-2005 (available years) ... 40 Figure 15. Prevalence of current smokers per type of product smoked in Australia, 2001-2010
(available years) ... 40 Figure 16. Smoke-free environment regulation across the world, 2018 ... 45 Figure 17. Diffusion and characteristics of health warning labels about the dangers of tobacco across the globe, 2018 ... 48 Figure 18. Bans on advertising, promotion and sponsorship of tobacco products across the globe, 2018... 50 Figure 19 Progress made by Australia in banning tobacco advertising ... 51 Figure 20. Tobacco tax policy across the globe, 2018 ... 52 Figure 21. Value of excises and custom duties: AUD per cigarettes sticks weighting less than 0.8 grams, 2000-2019 ... 54 Figure 22. Percentage of population aged 15 years or older who are daily smokers in selected OECD countries, last available year estimates between 2016 and 2018 ... 65 Figure 23. Prevalence of daily smokers aged 14 years or older by gender in Australia, 2001-2016 (available years) ... 67 Figure 24. Average number of cigarettes smoked per week by male and female smokers aged 14 years or older in Australia, 2001-2016 (available years) ... 68
iv
Figure 25. Prevalence of daily smokers by age groups and gender in Australia, 2017-2018 ... 69 Figure 26. Prevalence of daily smokers by age groups in Australia, 2001-2016 (available years) ... 69 Figure 27. Prevalence of daily smokers by age groups in Australia, 2014-2015 and 2017-2018 (last available years) ... 70 Figure 28. Prevalence of daily smokers aged 14 years or older by socio-economic status of the district where they live, 2010-2016 (available years) ... 71 Figure 29. Prevalence of daily smokers aged 14 years or older by occupational status in Australia, 2010-2016 (available years) ... 72 Figure 30. Prevalence of daily smokers aged 14 years or older by indigenous status in Australia, 2010-2016 (available years) ... 73 Figure 31. Prevalence of daily smokers of Aboriginal and Torres Strait Islander population by age groups and gender in Australia, 2018-2019 ... 74 Figure 32. Prevalence of daily smokers aged 18 years or older by Australian states and territories, 2017-2018 ... 75 Figure 33. Decrease in the prevalence of daily smokers aged 18 years or older by states and
territories, years 2001-2017/18 (on the left) and 2014/15-2017/18 (on the right) ... 76 Figure 34. Prevalence of daily smokers aged 18 years or older, 2001-2017/2018 (available years) ... 77 Figure 35. Lifetime use of e-cigarettes by smoker status for population aged 14 years or older, 2013-2016 (percent) ... 78 Figure 36. Reasons for using e-cigarettes among current e-cigarette users, 2016 (percent) ... 79 Figure 37. Lifetime use of e-cigarettes by gender for the population aged 14 years or older, 2013 and 2016 (percent) ... 80 Figure 38. Lifetime use of e-cigarettes by gender and age, 2016 (percent) ... 80 Figure 39. Lifetime use of e-cigarettes by smoker status and age, 2016 (per cent) ... 81 Figure 40. Prevalence of smokers, ex-smokers and never smokers aged 18 years or older, 1989-2018 (available estimates) ... 82 Figure 41. Prevalence of smokers, ex-smokers and never smokers aged 14 years or older, 1991-2016 (available estimates) ... 83 Figure 42. Changes in smoking behavior for smokers 14 years or older, 2007 to 2016 (available estimates) ... 83 Figure 43. Factors that motivated changes in smoking behavior, smokers aged 14 years or older who reported a change in behavior, 2007-2016 ... 84 Figure 44. Prevalence of ex-smokers aged 18 years or older by gender, 1989-2018 (available
estimates) ... 85 Figure 45. Prevalence of ex-smokers aged 14 years or older by gender, 2001-2016 (available
estimates) ... 86 Figure 46. Changes to smoking behavior for smokers aged 14 years or older by gender, 2007-2016 (available estimates) ... 86 Figure 47. Prevalence of ex-smokers by age groups, 2001-2016 (available estimates) ... 87 Figure 48. Prevalence of ex-smokers by age groups, 2014-2015 and 2017-2018 (last available
estimates) ... 88 Figure 49. Prevalence of people who have never smoked by age groups, 2011-2016 (available
estimates) ... 88 Figure 50. Prevalence of ex-smokers aged 14 years or older by socio-economic status of the district where they live, 2010-2016 (available estimates) ... 89 Figure 51. Prevalence of ex-smokers and smokers 14 years or older by labor status, 2016... 90 Figure 52. Prevalence of ex-smokers, daily smokers, current smokers, and people who have never smoked 18 years or older, 2017-2018 ... 91
v
Figure 53. Prevalence of ex-smokers aged 14 years or older by jurisdiction, 2010-2016 (available estimates) ... 91 Figure 54. Conceptual framework ... 94 Figure 55. Prevalence of daily smokers aged 18 years or older and excise and customs duty per cigarette stick, 2001-2018 (available estimates) ... 95 Figure 56. Price of a 20-cigarette pack of the most sold brand (AUD) and illicit trade volume in million sticks, 2008-2018 (available estimates) ... 96 Figure 57. Federal government expenditure on anti-smoking advertising campaigns (million dollars) and prevalence of current smokers aged 18 years or older, 2007/08-2017/18 (available estimates) ... 97 Figure 58. Number of prescriptions for anti-smoking medications and retail volume of licit tobacco, 2004/05-2017/18 (available estimates) ... 98 Figure 59. Number of prescriptions for anti-smoking medications and prevalence of ex-smokers aged 18 years or older, 2004/05-2017/18 (available estimates) ... 99 Figure 60. Retail volume of cigarette market in million sticks and retail value of e-cigarette market in million AUD, 2007-2017 (available estimates) ... 100 Figure 61. Percentage of lifetime e-cigarette users and prevalence of current smokers aged 14 years or older, 2013-2016 (available estimates) ... 100 Figure 62. Estimated number of articles on tobacco and ANDS/ANNDS related issues (2011-2019) and prevalence of daily smokers (2011/12-2017-18) ... 118 Figure 63. Estimated number of articles on smoking cessation and anti-smoking campaigns (2011-2019) and prevalence of daily smokers (2011/12-2017-18) ... 119 Figure 64. Estimated number of articles on tobacco control laws (2011-2019) and prevalence of daily smokers (2011/12-2017-18) ... 120 Figure 65. Estimated number of articles on health problems associated with smoking and using ANDS/ANNDS (2011-2019) and prevalence of daily smokers (2011/12-2017-18) ... 121 Figure 66. Estimated number of articles on health problems associated with smoking and using ANDS/ANNDS (2011-2019) and the drug thought to cause the most deaths according to Australians (2007 – 2016) ... 122 Figure 67. Number of articles on vaping products (2011-2019) and prevalence of daily smokers (2011/12-2017/18) ... 123 Figure 68. Number of articles on vaping products by attitude and year, 2011-2019 ... 124 Figure 69. Number of articles in the overall population (red) and in the stratified sample (blue) for the topic “Tobacco and ANDS/ANNDS related issues” ... 253 Figure 70. Number of articles in the overall population (red) and in the stratified sample (blue) for the topic “Smoking cessation and anti-smoking campaigns” ... 254 Figure 71. Number of articles in the overall population (red) and in the stratified sample (blue) for the topic “Health problems associated with combusted tobacco and ANDS/ANNDS” ... 255 Figure 72. Number of articles in the overall population (red) and in the stratified sample (blue) for the topic “Tobacco control laws” ... 256
1
Executive Summary
Alberto Aziani
This report presents the Australian case study, which has been developed within the framework project A multi-disciplinary investigation into the drivers for smoking cessation in five nations with ANDS markets. The aim of the project is to identify the historic drivers of smoking cessation in Australia, Canada, Japan, South Korea, and the United Kingdom, with an especial focus on the role of public policies and Alternative Nicotine Delivery Systems (ANDS). The following sections provide an overview of the background and aim of the case-study, as well as the methodology that was used, key messages and policy implications.
Background
In recent decades, the Australian government has adopted increasingly more stringent anti-smoking policies. These strict laws also apply to ANDS. Overall, the Australian approach to tobacco control has led to a significant reduction in smoking. However, the effectiveness of some of these policies appears to have diminished recently, and there are now requests being raised for amendments.1
Australia stands out for its strict smoking policies
Originating in the 1970s, in response to the increasing smoking rates among Australians, the government has adopted a multifaceted anti-smoking strategy. In 2011, Australia was the first country in the world to adopt plain packaging. Since 2012, health warnings occupy 75% of the front and 90% of the back of cigarette packs. Tobacco excise taxes increased by 25% in 2010 and from 2013 they have surged by an additional 12.5% per year. By the end of 2020, the price of a 25-cigarette premium pack is estimated to reach almost 50 AUD. Australia bans smoking in most of its enclosed public places.
Australian smoking prevalence is low in comparison to most other countries
20% of adults in the world smoke tobacco. In Australia, between 1995 and 2017-18, the prevalence of daily smokers (18+) decreased by 42.0% (from 23.8% to 13.8%), the prevalence of ex-smokers (18+) increased by 6.6% (from 27.4% to 29.2%), while the percentage of the population (18+) who never smoked increased by 13.9% (from 48.9% to 55.7%). Between 2001 and 2016, the average number of cigarettes smoked per week reduced, from 109.5 to 93.6. The overall volume of consumed tobacco products also contracted.
1 All data presented in the Executive Summary refer to individuals aged 14 years old and over, unless otherwise
2
The use of ANDS—including e-cigarettes—is severely limited in Australia E-cigarettes and other electronic devices are not officially approved as smoking cessation aids. Australia has banned both the sale and use of e-cigarettes containing nicotine, heat-not-burn products, and other smokeless products. Although illegal, Australian vapers appear to have easy access to e-liquids containing nicotine. Australians can legally import liquid containing nicotine for therapeutic reasons only if it is prescribed by a qualified medical practitioner. E-cigarettes that do not contain nicotine can be freely possessed and sold.
Nonetheless, the use of e-cigarettes is growing in Australia
The retail value of the market in vapor products increased by 85% from 2014 to 2016 (last available estimates). In 2016, the daily prevalence of e-cigarette-use was 0.5% among the whole Australian population, 1.5% among smokers, and 0.8% among ex-smokers. The primary reason for using e-cigarettes is to quit smoking. 98% of smokers (12+) had already smoked combustible e-cigarettes before trying e-cigarettes.
Recently, Australian anti-smoking policies have lost momentum
Smoking reduction has slowed down in recent years, while smoking prevalence has actually increased across certain age groups. After decades of progress, since 2013 further decline in deaths from smoking has stalled. Since 2012-13, federal expenditure on anti-smoking campaigns has been contracting. From 2015, mass media attention on tobacco-related issues has decreased and remains low. Consumption of illicit tobacco products has increased over the last decade.
Important discrepancies persist in the smoking habits of different social groups
Less affluent Australians smoke more than their richer counterparts, people at the margins of the labor market smoke more than those in better employment, while Indigenous people smoke more than non-Indigenous ones. In 2017-2018, smoking rates in Northern Territory, Tasmania and Queensland—the Australian states and territories characterized by the highest percentage of Indigenous people on the total population—remained higher than the national average.
Current study
Starting from these premises, the current study aims to identify the historical drivers of smoking cessation in Australia, specifically by understanding the effectiveness of their smoking cessation policies and investigating the potential role of ANDS in smoking reduction and cessation.
The study adopts a multidisciplinary approach to the analysis of smoking cessation
This study combines insights, theories and empirical evidence from social sciences, economics, and health sciences. This permits the analysis of smoking cessation through a range of lenses, which, in turn, enables us to provide more comprehensive results and policy recommendations.
3
The study proposes a multilevel analysis of the drivers and barriers of smoking cessation The study investigates the role of both drivers and barriers at different levels: macro (e.g., policies, anti-smoking campaigns), meso (e.g., neighborhood, school), micro drivers (e.g., family, friends), and individual (e.g., beliefs, personal preferences).
The study adopts a multi-methodological approach
The trend analysis of selected drivers allows for the exploration of their impact on smoking cessation over time. The extensive media coverage analysis of thousands of newspapers’ articles pertaining to tobacco products, ANDS, and smoking cessation policies provides insights into the role of the media in shaping and reporting smoking-related issues over the years. The structured literature review, based on the extensive availability of sound empirical studies, summarizes extant empirical evidence on the most effective historical drivers of smoking cessation in Australia.
Key messages
The results of this study enable the identification of what has worked and what proved to be less effective in driving smoking cessation in Australia. These findings are expedient for designing new effective tobacco control policies to further reduce smoking prevalence.
Effectiveness of Australia’s smoking-related policies
Overall, the main macro-level tobacco control policies have been jointly successful in reducing tobacco consumption among the general population
Albeit with specific distinctions and caveats, smoke-free environments, taxation, and advertisement bans collectively contributed to the de-normalization of smoking, and, in turn, sustained both smoking prevention and cessation. In particular, increased taxation had a strong impact on smoking rates among the general population. However, the adopted taxation policy was not effective in reducing the discrepancy in the smoking prevalence of high- and low- income populations. In fact, it likely caused an increase in illicit consumption.
Smoking cessation services and aids are not very effective in helping smokers to quit
The results from empirical studies question the effectiveness of smoking cessation services and aids in inducing actual smoking cessation. However, pharmacotherapies have been found to be more successful when combined with counselling (e.g., quitlines).
Negative emotions associated with health warnings are often not enough to stimulate behavior change
Studies examining the specific impact of health warnings have yielded mixed results. That said, most of them show that health warnings are not effective in prompting cessation. Similarly, available studies suggest that plain packaging does not induce smokers to quit. Notwithstanding these findings, plain packaging has contributed to de-normalizing smoking, thus discouraging uptake and reducing smoking prevalence in Australia, especially in the years immediately following its introduction.
4
Policies at different levels have proven to be only partially successful in targeting the most vulnerable groups, for whom smoking persists the most The smoking prevalence among Indigenous people and low-income populations remains more than twice that of the non-Indigenous people and high-income populations. Studies show that radio anti-smoking campaigns are less effective in getting the message to the Indigenous population. This is due, at least in part, to the prolonged social marginalization and disadvantage experienced by this population. Smoking remains much more socially acceptable within the most vulnerable groups, which testifies to the fact that it is not yet de-normalized.
Available statistics suggest that e-cigarettes have potential as a smoking cessation tool
From 2007 to 2016, both the percentage of smokers who attempted to quit and those who reduced their daily intake of tobacco increased by 13.1% (from 25.2% to 28.5%) and 17.4% (from 31.6% to 37.1%), respectively. The simultaneous increase in the use of e-cigarettes may have contributed to this change in smoking behavior.
Available data appear to refute gateway theory
E-cigarettes may provide a mechanism for cessation for a category of smokers for whom motivation alone is insufficient, without acting as a potential gateway into tobacco consumption for non-smokers. Indeed, 98% of smokers aged 12 years or older reported having smoked combustible cigarettes prior to e-cigarettes.
Severe restrictions on e-liquids containing nicotine does not prevent vapers from obtaining them illegally
Vapers can easily obtain nicotine e-liquids via illicit channels, particularly over the internet or under-the-counter from tobacconists. In 2013, 43% of current Australian e-cigarette users reported vaping with nicotine, while a further 21% did not know if the e-liquid they were using contained nicotine or not. Moreover, in 2013, 70% of the e-liquids sampled by the NSW Health Ministry contained high-levels of nicotine even though the label did not list nicotine as an ingredient.
General lessons learned from the Australian case study
Manifold multilevel and interconnected factors impact the effectiveness of smoking cessation policies in Australia
Smoking cessation is simultaneously affected by multiple factors (barriers and drivers) at the macro, meso, micro and individual level. The complexity of the interconnections between these various factors suggests that it may be difficult to identify single drivers as being responsible for both smoking cessation—at the individual level—and the reduction in smoking prevalence—at the societal level. Rather, smoking is influenced by a combination of different factors interacting together.
5
Many tobacco control policies have different short-term and long-term effects. Tobacco control policies that reduce the opportunities to smoke (e.g., smoke-free environments) tend to have effects that last longer than those aiming at arousing immediate negative emotions around smoking (e.g., health warnings). The former makes it difficult to preserve smoking habits, while the latter are more likely to induce temporal emotional changes and only eventually behavioral changes. Policies that induce more long-term effects contribute more to the de-normalization of smoking habits.Tobacco control policies can have direct and indirect effects
Free-smoking environments tend to have a direct effect on the volume of cigarettes consumed, but only an indirect effect on smoking cessation. However, the indirect effect can show evidence of smoking cessation over the years. Consequently, a public consumption ban might make it less likely for future generations of pub-goers to start smoking. On the contrary, liberalizing the use of e-cigarettes might directly affect smoking reduction and cessation, but it can also indirectly generate health issues in the event that non-smokers begin to use them. Indeed, while ANDS almost certainly have a less detrimental impact on health than traditional tobacco products, complete abstinence is a safer option.
Factors facilitating the intention to quit, in and of themselves, may not lead to successful cessation
Factors associated with the intention to quit (e.g., being confident in one’s capabilities, being aware of the effects of smoking on one’s health) do not necessarily facilitate smoking cessation. Other factors may reinforce anti-smoking beliefs and the intention to quit, thus inducing successful quit attempts. For example, an increase in the price of tobacco may provide an additional motivation to quit. Over the last decade, affordability has played a major role in encouraging people to quit.
Anti-smoking campaigns are most cost-effective if they are regular and well-funded
More intense and expensive anti-smoking campaigns are more cost-effective than less intense and cheaper campaigns. Low-intensive or fragmented campaigns have little to no significant effect, and, in fact, can even be counterproductive. This is especially true for low-income and Indigenous populations. A cost-effectiveness analysis carried out in 2008 showed that, out of a total cost of about 10 million USD for an anti-smoking campaign funded in 1997 by the Australian government, the predicted health care cost savings exceeded 730 million USD.
Emerging Policy Implications
The findings emerging from the performed analysis can be useful for designing new effective tobacco control policies to further reduce Australian tobacco consumption.
Adopt integrated approaches
Given that smoking cessation is simultaneously affected by multiple factors, policies should also adopt an integrated approach. Tax increases should always be combined with sensitization campaigns, smoking cessation services, and enforcement efforts against illegal markets. Policies capable of inducing the intention to quit (e.g., health warnings) should be combined with the provision of
6
instruments that actually help people to quit (e.g., smoking cessation aids, ANDS). Moreover, to reduce smoking among disadvantaged sectors of the population, it would be beneficial to frame tobacco control within broader programs aimed at improve living conditions, social integration, and population health.Conduct regular and frequent anti-smoking campaigns
It is preferable to concentrate one’s efforts into well-funded ambitious campaigns and to strengthen the level of coordination between different institutions and stakeholders so as to maximize their impact.
Evaluate policies by paying specific attention to their timing and lifespan
Given that the effectiveness of tobacco control policies changes over time, it is important to evaluate policies in terms of their short- and long-term effects. The effectiveness of policies should be assessed over time because evaluations made immediately after the adoption of a specific regulation may measure effects that do not persist. Similarly, leaving too much time to pass can impede the identification of the potentially significant effects engendered by a policy after its introduction.
Renew policies that are losing their effectiveness
Policies that produce short-term effects should be reconfigured when their effects begin to wane. Specifically, health warnings, media anti-smoking campaigns, and smoking cessation services’ modalities must be regularly updated to maximize their impact.
Design better customized anti-smoking campaigns that directly target the most vulnerable populations
Anti-smoking campaigns aimed towards the maximum smoking reduction in the general population might not be effective in reaching marginalized communities and vulnerable subjects. In Australia, anti-smoking campaigns and effective communication strategies should be implemented to directly approach Indigenous people and low-income populations. Above all, it is critical to raise awareness of the existence of quit-smoking services and to improve access to them for the most disadvantaged sections of the population.
Relax regulation of ANDS
Despite the legal restrictions, Australians nevertheless continue to use nicotine e-liquids and, indeed, many liquids on the Australian market contain high-levels of nicotine. People who change their smoking behavior, but still are unable to quit, might therefore benefit from having access to certified devices and nicotine e-liquids to assist them to stop smoking. Hence, by penalizing most ANDS over combustible tobacco products, the government and health institutions may in fact unintentionally be promoting a falsehood that combustible tobacco is less harmful than smokeless alternatives. An extended set of recognized ANDS would better meet the preferences of those who want to quit smoking but are unable to do so. Indeed, quitting smoking is the primary reason cited by Australians for beginning to use e-cigarettes in the first place. In this respect, then, the gateway theory does not appear to ring true, insofar as 98% of smokers aged 12 years or older reported having smoked combustible
7
cigarettes prior to using e-cigarettes. However, to protect young individuals from using ANDS before beginning to smoke, the government should seek to regulate e-cigarettes in the same way that they do tobacco products. Finally, if legalized, ANDS should be adequately taxed to both remove the barriers to cessation for those who want to quit and to discourage smokers from switching to illicit tobacco products.8
I.
Introduction
Alberto Aziani
A combination of strict anti-tobacco regulations, effective anti-tobacco policies, and strong sensitization through anti-smoking campaigns has led to a marked decrease in smoking prevalence in Australia over the years. Since 1945, the smoking prevalence has decreased by more than 70% in the country. In 1945, almost three out of four adult men (72%), and more than one in every four adult women (26%), were regular smokers (Woodward, 1984). In 2017-18, the estimated percentage of adult daily smokers was 13.8%. This is a low figure in comparison to other countries in the world (Australian Bureau of Statistics, 2018).
Since 1945, there has been a constant downward trend in tobacco consumption, with the exception of a reversed tendency around the 1970s. Between 1969 and 1976 smoking prevalence increased by 4.1%. Two main explanations have been advanced for the increase in tobacco consumption in the early 1970s. First, the widespread diffusion of television in the late 1950s, which began to broadcast advertisements for cigarettes that reached billions of viewers and families across Australia. Second, the social and cultural revolution of the 1960s that rejected the conservative values of the old generation, such as the importance placed on one’s future health and economic security. During this period, many women also took up smoking as a statement of independence and equality (Scollo & Winstanley, 2019b). Subsequently, beginning in the 1980s, both male and female smoking prevalence began to decrease and has continued to do so to this day. As part of their new initiative to boost preventive health outcomes, the goal of the Australian federal government is to cut the smoking rate to less than 10% by 2025 (Department of Health, 2019).
Today, Australia is recognized as a leading country in tobacco control worldwide (Marmor & Lieberman, 2004; Wilensly, 2002; World Health Organization, 2019). In the 1970s, tobacco control efforts were instituted in response to the increasing smoking rates among the Australian population. Since then, the government has progressively strengthened smoking and advertising bans, raised tobacco taxes, promoted anti-smoking campaigns, and imposed severe restrictions on the content, packaging, and importation of tobacco (World Health Organization, 2019). Indeed, Australia was the first country in the world to adopt plain packaging legislation in 2011, followed by the UK in 2014, Ireland and France in 2015, and Hungary, New Zealand and Norway in 2016 (World Health Organization, 2018). From 2012 onwards health warnings occupy 75% of the front and 90% of the back of cigarette packs. Australia also has one of the highest prices for tobacco products in the world (World Health Organization, 2019). In 2018, the price of a 25-cigarette packet from one of the most popular cigarette brands was 33.65 AUD (NSW Retail Traders’ Association, 2018). As a result of its taxation policy, by the end of 2020 the price of a 25-cigarette premium pack will reach almost 50 AUD (Wilkie & Piotrowski, 2020). Australia also has some of the strictest regulations on smoke-free environments in the world. With very few exceptions, smoking is banned in almost all public places across the entire country.
The primary goal of Australian tobacco control policy over the years has been to encourage smokers to quit and dissuade those who have never smoked from beginning. Generally speaking, the Australian federal government has not supported policies aimed at reducing tobacco-related harm by encouraging
9
smokers to obtain nicotine in less harmful forms (Hall et al., 2019). For this reason, e-cigarettes are highly regulated in Australia and the use of nicotine in these devices is prohibited. The sale and use of e-cigarettes containing nicotine, heat-not-burn products, and other smokeless products (e.g., snuff, paste, powder or chewing tobacco) are all banned in Australia. The Therapeutic Goods Administration (TGA) has thus far not authorized the use of any e-cigarette or other electronic device as an official smoking cessation aid. De jure, Electronic Non-Nicotine Delivery Systems (ENNDS) are the only devices that Australians can freely buy and use, since it is illegal to use, sell or buy nicotine for use in e-cigarettes in the country. Individual consumers may legally import liquid containing nicotine for personal use, if they have a prescription from an Australian medical doctor and are in compliance with the state or territory’s poison laws (Therapeutic Goods Administration, 2019); nonetheless, doctors, who are trained in traditional quitting methods, such as the use of medications and counselling, tend to not provide their patients with these prescriptions (Mendelsohn, 2019).In reality, vapers can easily obtain nicotine e-liquids through illicit channels, particularly via the internet from the neighboring jurisdiction of New Zealand, where e-liquids containing nicotine are legal, as well as under-the-counter from tobacconists (Karp, 2019). Analysis of vaping solutions by Australian health departments has confirmed that many illegally contain nicotine. In 2013, 43% of current Australian e-cigarette users reported vaping with nicotine, while a further 21% did not know if the e-liquid they were using contained nicotine or not (Fraser et al., 2015; NSW Health, 2013b). According to the NSW Ministry of Health, 70% of the e-liquids sampled for their scientific tests contained high-levels of nicotine even though the label did not include it as an ingredient (NSW Health, 2013a).
Australian statistics on the use of vaping products are scarce compared to both other countries and smoking-related statistics. Therefore, it is difficult to analyze in detail changes in e-cigarette consumption by Australians over the years. Despite this, it is clear that, from the mid-2000s when e-cigarettes were first introduced in the Australian market, their use has grown. In 2016, the daily prevalence of e-cigarette-use among Australians aged 14 years or older was 0.5%, while smokers aged 14 years or older who used e-cigarettes daily, weekly or less than weekly in 2016 represented 4.4% (Australian Institute of Health and Welfare, 2017). In 2016, the estimated prevalence in the lifetime use of e-cigarettes among Australians aged 14 years or older was 31.0% for smokers, 4.9% for non-smokers, and 8.8% for the general population. The marked increase in the use of e-cigarettes is also confirmed by the expansion in the value of the market for these products (Euromonitor International, 2018).
Quitting and reducing smoking are the primary reasons cited for using cigarettes by current e-cigarette users, along with being one of the principal reasons cited by all types of users. In 2016, 46.7% of Australian current e-cigarettes users declared that they used the devices in an attempt to quit smoking; 36.0% cited using them to cut down on the number of cigarettes they smoked; 31.2% used them to prevent going back to smoking regular cigarettes; while 42.2% of them believed that e-cigarettes were less harmful than regular cigarettes (Australian Institute of Health and Welfare, 2017). In 2016, 98% of smokers aged 12 years or older had already smoked combustible cigarettes prior to trying e-cigarettes. These figures in Australia appear to confirm the findings of empirical studies from several other countries: the main reasons for using e-cigarettes are to quit smoking and to use a product that is less harmful than cigarettes (Pepper & Brewer, 2014).
10
The skepticism towards the use of e-cigarettes stems primarily from the possibility that these devices will serve as facilitators for smoking among young people (e.g., Soneji et al., 2017), and lead to the subsequent uptake of traditional cigarette smoking among non-smokers (e.g., Bell & Keane, 2012; Flouris & Oikonomou, 2010; McKee & Capewell, 2015). However, several studies have argued that this is unlikely the case (e.g., Hallingberg et al., 2020; Kristjansson et al., 2019; Watkins et al., 2018). In Australia, e-cigarette users are in favor of vaping products being regulated, provided these regulations do not impede their ability to obtain devices and refill solutions, which they view as integral to them continuing to abstain from smoking (Fraser et al., 2015).The effectiveness of the Australian government in reducing smoking rates over the years, in conjunction with the strict ban on smokeless devices, makes Australia a relatively unique case to study to assess the dynamics of smoking cessation. Several lessons can be learned from the Australian context that might inform tobacco control policy in other contexts, while new directions can also be foreseen for the future of smoking habits in the country. Bearing in mind that countries differ in their histories, cultures, legal and regulatory frameworks, enforcement capacities, healthcare systems, gender norms, political environment, and economic priorities, the results from the Australian case can still inform the design of future policies, both within those countries that already have a low-level of tobacco consumption and those that are at the embryonic stage of their smoking reduction policies.
The aim of the present study is to understand what the historical drivers of smoking cessation are in Australia and to suggest steps forward for policies to further reduce smoking in the next future. Given the growing number of studies at the international level analyzing the potential effects of e-cigarettes on quitting (e.g., Beard et al., 2020; Farsalinos & Niaura, 2020; Jackson et al., 2019; Kalkhoran et al., 2019), this study also explores their potential role in driving smokers to quit in the Australian context. To achieve this aim, the study discusses and frames smoking cessation drivers within Australia’s history, culture and social structure, as well as it economic and regulatory framework, media activity and healthcare system. In doing so, this study provides an evaluation of the effectiveness of the drivers of smoking cessation, assesses the extent to which their impact varies across populations and territories and, based on this, draws policy implications.
11
II.
Timeline
The evolution of smoking cessation in Australia
Serena Favarin
From the end of World War II the present day, smoking prevalence has consistently declined in Australia.2 In 1945, according to Woodward’s estimates (1984), 72% of men and 26% of women smoked. Male smoking prevalence has never again reached its 1945 levels. Conversely, female smoking prevalence reached its peak during the 1970s, when many women took up smoking as a means through which to challenge gender stereotypes and assert their independence (Scollo & Winstanley, 2019b). During that decade, around 31% of women smoked (D. R. Smith & Leggat, 2008). Hence, over the course of the 1960s and 1970s, health organization lobbyists asked the government to reinforce health warnings, as well as promoting campaigns to raise awareness over the deleterious health effects from smoking. Especially from the 1970s onwards, the government began to strengthen its tobacco control framework, introducing new laws to decrease smoking prevalence and launching campaigns and educational programs to encourage quitting. The policies adopted in those years contributed towards the de-normalization of smoking, which, in turn, reduced the percentage of smokers to 13.8% according to the most recent estimates in 2017-18 (Australian Bureau of Statistics, 2018).
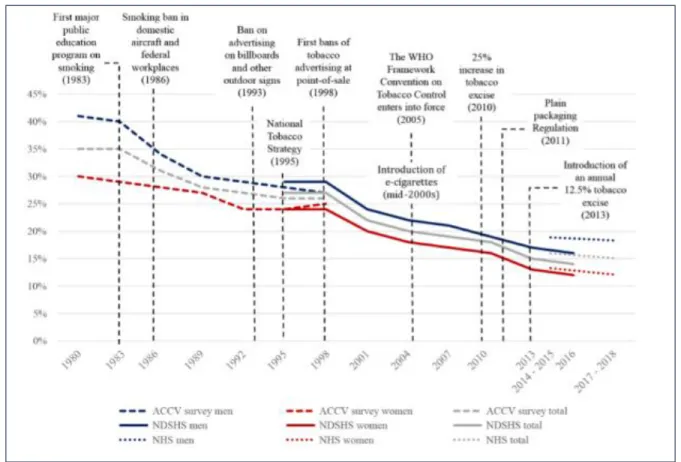
Figure 1 shows the decline in smoking rates in Australia between 1980 and 2018.3 There are four main shifts in the time series: 1983, 1989, 1998 and 2010. From 1983 to 1989, there was a rapid and ongoing decline in smoking prevalence in Australia, primarily stemming from the fact that a high percentage of men had quit smoking. Moreover, in 1983, the Australian government introduced its first major public education program on smoking, which may also have impacted upon the smoking rate in subsequent years. Scientific research in the 1980s on the deleterious health effects of secondhand and passive smoking (e.g., Hirayama, 1981; National Health and Medical Research Council, 1986) encouraged the Commonwealth to adopt smoke-free policies in workplaces and public spaces (Borland et al., 1997; M. H. Winstanley & Woodward, 1992). The government also made progress in terms of developing health services specifically dedicated to smokers. In 1985, the first quitlines (telephone counselling services) were established in Victoria to assist Australians in stopping smoking (Anderson & Zhu, 2007; Pierce et al., 1986). Two years later, the first health promotion body in the world (Victorian Health Promotion Foundation) was established via funds from tobacco taxes. All these policy measures are likely to have contributed to reducing smoking prevalence in Australia, especially in the 1980s, and specifically among men.
The second notable shift in the series is 1989: from them to 1992, a high percentage of women quit smoking, which, in turn, strongly influenced the general trend in smoking cessation. Then, until 2016, the
2 There are no estimates of smoking prevalence in Australia before 1945 (Greenhalgh, Bayly, et al., 2019).
3 Due to data availability, it was not possible to show smoking rates prior to the 1980s in the graph. Although there
are some estimates of smoking prevalence before 1980, in most of the cases data are available only for the overall population or by gender, but not for both.
12
trends in smoking prevalence were highly similar for Australian men and women. The third breakpoint is 1998, which was the year when the government introduced the first bans on advertising tobacco at point-of-sales (POS). The marked decline recorded between 1998 and 2001 is probably also due, in part, to other factors, such as additional extensions to the tobacco advertising ban in 1993 and the launch of the National Tobacco Strategy in 1995. The fourth and last breakpoint in the series is 2010, a year in which there was a 25% increase placed on tobacco excise. Conversely, from 2013 to 2016, instead, smoking rates decreased more slowly, and even increased among certain age groups. This was also the case for the last available estimates, which also displayed a small decline in smoking prevalence (-4.6%) between 2014-2015 and 2017-2018.4 As discussed at length in section VII, while tobacco control laws undoubtedly contributed to a reduction in smoking rates over the years, the effect of these laws has diminished in recent years.Figure 1. Prevalence of regular smokers (aged 18 years or older) in Australia, 1980-2018
(available estimates)
Note: Smokers are represented as a percentage of the Australian population aged 18 years and over. Estimates are presented for the general, male, and female populations. ACCV data include those describing themselves as ‘current smokers’ with no frequency specified; Australian Institute of Health and Welfare data (NDSHS survey) include those reporting smoking ‘daily’ or ‘at least weekly’; Australian Bureau of Statistics (NHS survey) data include those reporting smoking ‘daily’ or ‘occasionally’. ACCV data and AIHW data include persons smoking any combination
4 The difference between ABS and AIWH estimates referred to most recent years mainly depends on the different
methodological choices adopted to carry out the surveys. Since estimates have been calculated on slightly different populations and on different years, comparisons should be made with caution.
13
of cigarettes, pipes, or cigars; ABS data include persons smoking manufactured cigarettes, roll-your-own cigarettes, cigars, and pipes. ACCV data are weighted to 2001 census population data and standardized by age and sex; AIHW data and ABS data are weighted to the Australian population appropriate for each survey year and is not standardized.
Source: authors’ elaboration of Australian Institute of Health and Welfare (2017), Australian Bureau of Statistics (2015, 2018) and Anti-Cancer Council Victoria data. Historical data from 1980 and 2016 were retrieved by Greenhalgh et al. (2019), who cited the Centre for Behavioural Research in Cancer as the source of the information.
The changes in slope shown in Figure 1 reflect the historical evolution of the Australian tobacco control framework and public debate on smoking. Because the data from these sources are collected only every three years, the chart exaggerates the effect of behavioral change, which is more graduated in reality than it appears here. However, as ever, correlation is not the same as causation. There are simply too many possible influences on smoking behavior to suggest that any of these specific drivers were causally responsible for the decline in smoking prevalence.
14
III. Methodology
On how to evaluate the impact of drivers and barriers on smoking habits
Serena Favarin and Carlotta Carbone
This study adopts a multi-methodological approach. It relies on three methods: Trend analysis of selected drivers
Structured literature review Media coverage analysis
The trend analysis explores the association between selected factors (e.g., tobacco taxes) and smoking prevalence, cessation or tobacco consumption over time. The structured literature review thoroughly summarizes the results from previous empirical studies on the historical drivers of smoking cessation in Australia. The media coverage analysis is a specific in-depth analysis that describes changes in the extent of Australian media coverage of smoking-related issues over time. The data sources that were used for these three analyses are reported in Annex 7.5
A.
Trend analysis of selected drivers
The goal of this analysis is to combine data on smoking prevalence, cessation and tobacco consumption with relevant macro-level drivers that may have influenced smoking habits over time in Australia. The trend analysis is not intended to infer a causal relation of these drivers on smoking habits, but, rather, aims to describe them over time and identify a possible association with the prevalence of smokers, quitters or tobacco consumption. Conversely, the structured literature review presents the results from previous empirical studies on the drivers of smoking cessation at the macro, meso, micro and individual level (see section VII.C).
Table 1 summarizes the variables included in the trend analysis, along with indications of the time coverage, and the source the data were retrieved from.
5 The original methodological framework also comprised interviews with relevant stakeholders and experts on tobacco
and smoking cessation in Australia (e.g., researchers, practitioners in the health sector, campaigners, vaping and tobacco industry representatives, promoters of anti-smoking campaigns). Sixteen stakeholders and experts were contacted but, unfortunately, none of them were able to take part in an interview. To compensate for the potential loss of information caused by these lack of interviews, the scientific contributions published by some of the stakeholders and experts who were contacted to be interviewed were reviewed to gather insights into their perspectives.
15
Table 1. Variables used in the trend analysis
Variable type Variable Time
coverage
Source
Tobacco consumption
Retail volume of tobacco market
2002- 2017 Euromonitor International (2017, 2018)
Tobacco consumption
Illicit trade volume 2008-2018 Euromonitor International (2018) Smoking
prevalence
Prevalence of daily smokers aged 18 years or older
2001-2017/18
Australian Bureau of Statistics (2002, 2006, 2010, 2013, 2015, 2018) Smoking
prevalence
Prevalence of current smokers aged 18 years or older
2007/08-2017/18
Australian Bureau of Statistics (2010, 2013, 2015, 2018)
Smoking cessation
Prevalence of ex-smokers aged 18 years or older
2001-2017/18
Australian Bureau of Statistics (2002, 2006, 2010, 2013, 2015, 2018) Driver Excise and customs duty per
cigarette stick
2001-2018 Australian Bureau of Statistics (2002, 2006, 2010, 2013, 2015, 2018) Australian Taxation Office retrieved from Scollo & Bayly (2019b). Australian Department of
Immigration and Border Protection retrieved from Scollo & Bayly (2019b)
Driver Price of a 20-cigarette pack of the most sold brand
2008-2017/18
World Health Organization (2020) Driver Federal government
expenditure on anti-smoking campaings
2010/11-2017/18
Australian Government Department of Finance (2011, 2012, 2013, 2014, 2015, 2016, 2017, 2018)
Driver Number of prescriptions for anti-smoking medications
2004/05-2017/2018
Pharmaceutical Benefits Scheme retrieved from Greenhalgh et al. (2020)
Driver Retail value of vapour products
2007-2017 Euromonitor International (2017) Driver Percentage of people who have
smoked e-cigarettes in their lifetime aged 14 years or older
2013; 2016 Australian Institute of Health and Welfare (2017)
Although the trend analysis is capable of identifying interesting associations among selected variables over time, it is unable to provide evidence of causal effect. The trend analysis does not establish any causal relation between the analyzed factors, but, rather, identifies potential associations that will be further analyzed in the structured literature review.
16
B.
Structured literature review
A preliminary review of the literature showed that a considerable number of studies have empirically assessed the impact of different categories of factors on smoking cessation in Australia. More specifically, they analyzed the impact of such factors on different variables related to cessation (e.g., intention to quit, attempting to, successfully quitting), focusing on different geographical areas (national, state, regional, municipal), and populations (e.g., pregnant women, Indigenous people, youths, etc.). A structured review of the literature was selected as the preferred method of analysis in light of the abundance and heterogeneity of extant studies on the topic. Moreover, the publicly available data do not permit a longitudinal empirical analysis of all four categories of factors (i.e., macro, meso, micro and individual). The available secondary data were mainly expedient for assessing the impact of macro-related factors. Therefore, it was decided that conducting a structured literature review of existing academic studies would be the best way to proceed. This analysis allowed for the inclusion of the widest range of studies, while, simultaneously, avoiding selecting a restricted range of studies on the topic that were limited to the pre-existing knowledge and biases of the researchers.
The review comprised processing a total of 680 peer-reviewed scientific articles that analyzed data from Australia. Scientific articles were extracted from the PubMed database (N=674) at the beginning of March 2020 through a query (see Annex 2) and integrated with further studies found via manual online searches (N=6). PubMed is a repository for medical journal papers, which is well-known within the scientific community for its high-quality research (see Annex 7). Annex 2 shows the specific query used to extract the scientific articles from this database.
After the extraction, the 674 scientific articles were manually classified to determine those that would be included and excluded from the study. The box below shows the inclusion criteria employed by the research team.
INCLUSION CRITERIA EMPLOYED IN THE STRUCTURED LITERATURE REVIEW 1. Research question: the selected studies had to answer the research question that underpinned the case
study, namely: “What are the historical drivers of smoking cessation in Australia?”. The studies had to address both drivers and barriers of smoking cessation and smoking-related behaviors. Specifically, the following outcomes were considered:
Intention to quit; Attempt to quit;
Smoking cessation, intended as a successful attempt to quit (alternatively defined as continued abstinence);
Smoking prevalence, which was used as a proxy for smoking cessation.
2. Country data source: the selected studies had to be conducted in Australia, irrespective of their
geographical level of disaggregation. Studies that also covered other countries besides Australia were included only if they displayed separate results for Australia.
17
3. Language: the selected studies had to be written in English.4. Quality: the selected studies needed to have undergone a peer-review process.
5. Timeframe: the selected studies needed to have been published between 1980 and March 2020. 6. Type of study: the selected studies had to be empirical. Descriptive studies and systematic reviews
were thus excluded. If pertinent, systematic reviews were stored in order to identify further relevant studies not already extracted from PubMed. The studies included were both quantitative and qualitative to ensure the greatest coverage of literature on the topic. For example, the studies on smoking cessation among the Indigenous population were mostly qualitative. Their inclusion provided greater knowledge on this population.
7. Availability: full texts of the articles had to be available.6
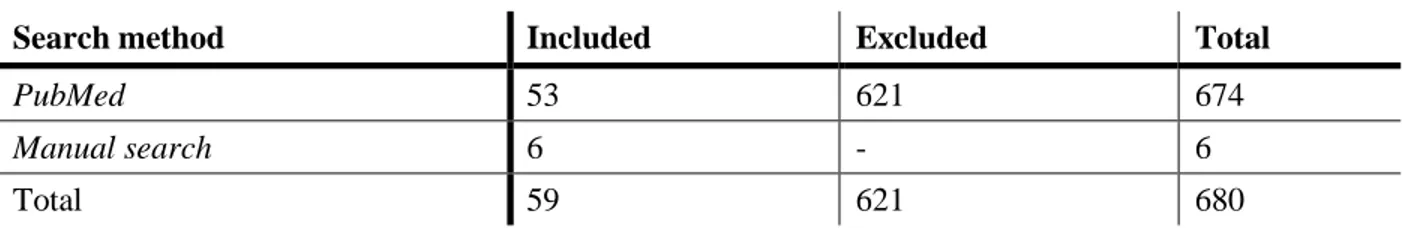
The total number of studies finally included in the analysis was 59 (see Annex 3 for the full list of references). Table 2 below shows the number of studies included and excluded from the study, as well as the search method that was used.
Table 2. Included and excluded studies
Search method Included Excluded Total
PubMed 53 621 674
Manual search 6 - 6
Total 59 621 680
Table 3 shows the main characteristics of the studies included in the review. The final two columns specifically indicate the number and percentage of studies (out of 59) that have a specific characteristic. Note that the specific categories within “time coverage”, “outcome” and “drivers” are not mutually exclusive: for example, a study carried out over the 1980s and 1990s will be counted within both categories (1980s and 1990s). This is the reason why the total sum of studies within the general categories is higher than 59.
Table 3. Characteristics of the included studies
General category Specific category No. studies Rate (%)
Type of study
Quantitative 51 86%
Qualitative 5 9%
Mixed Methods 3 5%
6 Transcrime, which is based in the Catholic University of Milan (Italy), has access to numerous peer-review journals
18
General category Specific category No. studies Rate (%)
Study design
Cross-sectional 17 29%
Serial cross-sectional 12 20%
Prospective study 22 37%
Retrospective study 8 14%
Main type of data Primary 36 61%
Secondary 23 39% Time coverage 80s 5 9% 90s 13 22% 2000s 36 61% 2010s 21 36% Unspecified 6 10% Territory Commonwealth 18 31%
State and territory 26 44%
Regional level 1 2% Municipal 14 24% Sample size >100 49 83% <100 10 17% Outcome variable Intention to quit 12 20% Attempt to quit 8 14% Smoking cessation 31 53% Smoking prevalence 19 32% Drivers Macro 41 70% Meso 11 19% Micro 11 19% Individual 24 41%
The principal limitation of the analyses was that only one repository was accessed to extract the studies. Access to additional repositories would have afforded a broader picture upon the drivers of smoking cessation.
C.
Media coverage analysis
Previous studies conducted at the international level demonstrated that exposure to tobacco-related news can affect smoking behaviors (Niederdeppe et al., 2016; K. C. Smith et al., 2008). The aim of the media coverage analysis is to describe the extent to which Australian media covered tobacco-related issues over time. The analysis relied on both online and offline national, sub-national and local Australian newspapers stored in the Nexis ® Metabase from January 2011 up to 18th March 2020 (see Annex 7 for an