A
A
l
l
m
m
a
a
M
M
a
a
t
t
e
e
r
r
S
S
t
t
u
u
d
d
i
i
o
o
r
r
u
u
m
m
–
–
U
U
n
n
i
i
v
v
e
e
r
r
s
s
i
i
t
t
à
à
d
d
i
i
B
B
o
o
l
l
o
o
g
g
n
n
a
a
DOTTORATO DI RICERCA IN
Elettronica, telecomunicazioni e ingegneria dell’informazione
Ciclo 31
Settore Concorsuale: 09/E3 - ELETTRONICA
Settore Scientifico Disciplinare: ING-INF/01 - ELETTRONICA
TITOLO TESI
Bluetooth Low Energy based proximity detection
and localization in smart communities
Presentata da:
Davide Giovanelli
Coordinatore Dottorato
Supervisore
Prof. Alessandra Costanzo
Dott. Elisabetta Farella
iii
ALMA MATER STUDIORUM – UNIVERSITÀ DI BOLOGNA
Abstract
ICT Center
Fondazione Bruno Kessler Doctor of Philosophy
Bluetooth Low Energy based proximity detection and localization in smart communities
by Davide GIOVANELLI
Internet of things will bring connected devices to a new level of pervasiveness, where any tangible thing of our daily life may embed some electronics. From a sophisticated smartwatch that embeds complex sensing and communication tech-nologies, to the use of a basic electronic component to implement a digital signa-ture, such as RFIDs. All these smart things worn or distributed around us enables multiple functionalities, when they can interact with each other. In this thesis, I describe the design, characterization and validation of a monitoring system based on Internet of Things technologies, for managing groups moving together in a city. Communication and energy efficiency aspects are firstly explored, to identify Blue-tooth Low Energy as a promising protocol enabling scalable and energy efficient networks of things. In the thesis, the protocol has been stressed to demonstrate trade-offs between throughput, energy efficiency, scalability and the possibility to perform multi-hop communication. The potential of the protocol has been exploited within the framework of the CLIMB project. Here, the application requirements and constraints fostered the use of Bluetooth for localization and proximity detection, leading to the investigation of novel strategies to improve accuracy without affect-ing power consumption and ease of use.
v
Contents
Abstract iii
1 Technologies for group management in smart communities 1
1.1 Introduction . . . 1
1.2 Group Monitoring . . . 2
1.2.1 Stack description . . . 4
1.2.2 Applications of group monitoring . . . 4
Children monitoring . . . 4
Museum or guided tours . . . 5
Sports competition . . . 6
Crowd monitoring . . . 7
Smart City . . . 7
Wildlife monitoring . . . 8
1.3 Requirements and challenges . . . 9
1.3.1 Application specific vs generic solution . . . 10
1.4 Case Study and motivation: The CLIMB project . . . 11
1.4.1 Evolution of the walking bus management system. . . 12
1.4.2 Premise and contextualization . . . 14
2 Bluetooth Low Energy Analysis 17 2.1 Introduction . . . 17
2.2 Related work. . . 18
2.3 Overview of the BLE communication protocol . . . 19
2.3.1 Data exchange in BLE . . . 20
2.3.2 BLE for streaming applications . . . 21
2.4 Power consumption model . . . 21
2.5 Implementation . . . 23 2.6 Experimental Results . . . 23 2.6.1 Experimental Setup. . . 23 2.6.2 Results . . . 24 2.7 Discussion . . . 25 2.8 Conclusion . . . 27
3 The MIGNOLO System: Managing Groups with Bluetooth Low Energy 29 3.1 Introduction . . . 29 3.2 Related work. . . 30 3.3 Requirements . . . 31 3.4 System description . . . 31 3.4.1 General overview . . . 31 3.4.2 Network implementation . . . 33 3.5 Experimental Evaluation . . . 34 3.5.1 Experimental Setup. . . 34
vi
3.5.3 Discovery latency and round-trip delay . . . 37
3.5.4 Memory requirements . . . 38
3.5.5 Power consumption . . . 39
3.5.6 Case study: Walking bus. . . 39
3.6 Conclusions . . . 40
4 Exploiting relative RSSI to estimate group shape through cooperative lo-calization: a negative result 41 4.1 Introduction . . . 41
4.2 RSSI based localization . . . 41
4.3 Approaches . . . 42
4.3.1 Linear regression on basic model (Basic-LR) . . . 43
4.3.2 Linear regression on angles augmented model (Angled-LR) . . 43
4.3.3 Neural network on decomposed network basic (Basic-NN) . . . 44
4.3.4 Neural network on decomposed network with angles (Angled-NN). . . 45
4.4 Experiments . . . 46
4.4.1 Setup . . . 46
4.4.2 Used evaluation metrics . . . 47
4.4.3 Results . . . 47
4.5 Discussion and conclusions . . . 49
5 Wake up radio and BLE 53 5.1 Introduction . . . 53
5.2 Related work. . . 54
5.3 Scenario and methods . . . 55
5.4 Bluetooth analysis. . . 57
Discovery time . . . 57
Data exchange. . . 58
5.5 BLE with WuR. . . 59
5.5.1 Connection oriented data exchange . . . 59
5.5.2 Broadcast oriented data exchange . . . 62
5.6 Discussion . . . 63
5.7 Conclusion . . . 63
6 Improving ranging accuracy with ToF over BLE 65 6.1 Introduction . . . 65
6.2 Background . . . 66
6.3 Time of Flight on BLE. . . 68
6.4 Setup . . . 69
6.4.1 Requirements . . . 69
6.4.2 Hardware . . . 69
6.4.3 Implementation . . . 70
6.5 Experimental procedure . . . 71
6.6 Results & Discussion . . . 71
6.6.1 Physical Model . . . 71
6.6.2 Models performance . . . 72
6.6.3 Dependency on the number of packets . . . 74
6.6.4 Dependency on the channel . . . 77
6.6.5 Repeatability of the test . . . 77
vii
7 From raw data to position tracking 81
7.1 Introduction . . . 81 7.2 Localization Algorithm . . . 81 7.2.1 Ranging Step . . . 82 7.2.2 Positioning Step. . . 85 7.3 Experimental Results . . . 86 7.3.1 Experimental Setup. . . 86 7.3.2 Description of results. . . 87 Ranging step . . . 87 Positioning step . . . 90 7.4 Conclusion . . . 90 8 Conclusions 95 8.1 Managing groups of people in smart city . . . 95
8.2 Summary of contributions . . . 96
8.3 Ongoing work . . . 97
8.3.1 From anchor based indoor localization to anchor free outdoor localization . . . 97
8.3.2 The network management. . . 97
8.4 Final remark: what if every person have an RF beacon? . . . 97
ix
List of Figures
2.1 The graphical representation of the BLE stack. . . 19
2.2 Example of BLE duty cycling strategies: in this case the CI is set to 30 ms and only one PPCE is sent. . . 21
2.3 Current absorption of CC2541 sending 4 packets in one CE: 1) startup, 2) pre-processing, 3) pre-RX, 4) RX, 5) RX-TX inter frame, 6) TX, 7) TX-RX inter frame, 8) post-processing, 9) pre-sleep. The phases 4 to 6 are repeated PPCE times, phase 7 is repeated PPCE-1 times, the rest is executed only once. . . 22
2.4 Mean current and Energy per bit with fixed data throughput (64kbit/s). For each CI the relative PPCE values are reported on the top horizon-tal axis. . . 25
2.5 Current consumption as function of Throughput. This is computed using maximum number of PPCE allowed on each module and for minimum number of PPCE (i.e. one PPCE). . . 26
3.1 Member state machine along with the high level events that trigger the state transitions.. . . 33
3.2 Schematic of the communication pattern. Note that this is not drawn to scale. Specifically transmission events have a very short duration. . 34
3.3 Percentage of corrupted packets with respect to the advertise interval (tAI) for 50, 100, 150 and 200 nodes in range. . . 35
3.4 Packet error rate obtained from simulation (blue/circles) and from experimentation (red/triangles) using different numbers of Member nodes. Note: scale varies across figures. . . 36
3.5 Cumulative distribution function (CDF) for a new Member entering in the communication range of the Leader. . . 38
3.6 Results from the case study. The Member awaits the Leader at po-sition 5. The Leader follows the path as indicated by the numbers. Once they meet, the Leader checks in the Member and they continue together. . . 40
4.1 Simple RSSI model. A constant error interval (5dB for shake of sim-plicity) in the RSSI context, becomes an error that is proportional to the distance when it is passed through the logarithmic model. This is a property of the logarithmic model that describes the way signal propagates in the space and it remains valid if the logarithmic model is approximated with a polynomial one. . . 43
x
4.3 Example of the network where the localization algorithms are ap-plied. All the nodes are peers and no reference anchor is present. Red lines depict an example of irregular antenna pattern, arrows represent node orientation with respect to the magnetic north (bearing) and two link angles (angle of departure at the transmitter side, angle of arrival at the receiver side) are named with α. . . . 44
4.4 Schematic view of the Angle-LR algorithm. Angles are actually used only after the Spring energy minimization block is executed once, oth-erwise angles are not available and angle models cannot be applied . . 45
4.5 Schematic view of the Basic-NN algorithm. To use the same NN with any amount of nodes, the network is divided into triangular sub-networks and the NN model is applied on triangles. Once the length of the sides of the triangles are estimated the network is reconstructed. 45
4.6 Schematic view of the Angled-NN algorithm. Angles and position are calculated and the iterative method is executed similarly to Angle-LR algorithm shown before. . . 46
4.7 Node layout used for training the algorithms. Only a subset of links is shown with light gray, during the test the network was actually fully connected (all the nodes are in range of all the others). Nodes’ absolute orientation with respect to the magnetic north is shown with red arrows. . . 48
4.8 Node layout for the test set. It tries to mimic a compact walking bus approaching a loner child. Links are not shown, however during the test the network was fully connected (all the nodes are in range of all the others). . . 49
4.9 How error figures evolve when linear regression on angles augmented model algorithm is iterated. . . 50
4.10 How error figures evolve when the neural network on decomposed network with angles algorithm is iterated. . . 51
5.1 A graphical representation of the BLE Link Layer simulation. Tx events of each advertiser are shown, when no collision occur the packet is considered reliably sent (the behavior of the physical layer is not in-cluded in the simulator), while if events overlap the transmission is considered corrupted. The experiment is considered concluded once that at least one packet for each advertiser is sent with no collisions. The plot is only demonstrative, parameters used for the plot are not those of BLE. . . 55
5.2 The average time to complete the discovery of N beacon nodes. Every trace represent the performance with different N as function of the advertise interval. N increases in the direction of the arrow and it is respectively 5, 100, 200, 300, 400, 500, 600, 700, 800, 900, 1000 beacons.. 57
5.3 The optimal TADV that minimizes the time to complete the discovery
of all the beacons in communication range. It represent the position of the minimum of Figure 5.2 as function of the amount of beacons N. The best fit line is also plotted.. . . 57
xi
5.4 Difference between connectable and non-connectable advertising in terms of current profiles. The three big spikes are the transmissions on three BLE advertising channels. In connectable advertising a small receiving window ’listen’ for incoming connection requests after the transmission on each channel. The device under test is the Nordic nRF52832. . . 58
5.5 Description of the procedures to upload data on beacons: (a) if the beacons are not equipped with the WUR, (b) and (c) if the beacons are equipped with WUR . . . 60
5.6 The average time to establish the BLE connection and to send one data packet to all N beacon. Every trace represent the performance with different N as function of the advertise interval. N increases in the direction of the arrow and it is respectively 5, 100, 200, 300, 400, 500, 600, 700, 800, 900, 1000 beacons. . . 61
6.1 Connection event representation. The One-Way propagation time tOW_ToF
is exaggerated to highlight the details of the measurement. Figure not to scale. . . 69
6.2 Acquired data: RSSI values (a) and Time of flight (b), plotted with respect to nodes distance in the Outdoor LoS condition. The mean value over 1000 ToF samples is reported, error bars are one standard deviation high. The two colors depict the train and test dataset. The fitted model is in red. . . 73
6.3 Cumulative Distribution Function of absolute ranging error for three conbinations of train/test set. . . 75
6.4 RMSE (Root mean squared error) in function of the number of packets averaged for the outdoor LoS (a) and NLoS (b). Note that X axis is log scale. . . 76
6.5 Effect of channel hopping on raw (not averaged) RSSI and ToF data. Each figure contains 1000 data points, then each circle may represent multiple overlapped points. . . 77
7.1 Experimental setup: a CC2650 sensorTag (reference node) is installed on an internal wall. The PCA10056 development board equipped with the nRF52840 module (target node) is connected via USB to a laptop PC that is used to collect and log data. . . 87
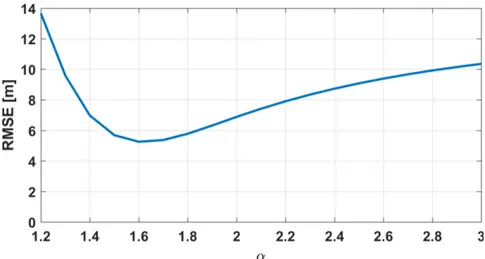
7.2 RSSI ranging RMSE as a function of the tuning parameter α. . . . 88
7.3 Ranging performance comparison between the RSSI-only approach (a) and the proposed KF (b). The blue lines refer to the estimated mean distance values, while the gray uncertainty band is given by the mean values±the corresponding sample standard deviations.. . . 88
7.4 Distance estimated by the KF from anchor 6, when the user follows a random trajectory in the room. . . 89
7.5 Planar position of the target (blue lines) estimated using a numerical unconstrained optimization of (7.10) (a) and the algorithm described at the end of Section 7.2.2 (b), when the user moved over a rectan-gular path (black dotted lines) four times. The black circle markers represent the position of the anchor nodes. . . 92
xiii
List of Tables
2.1 Result of multislave connection test . . . 25
3.1 Matrix of possible Member node’s states . . . 32
4.1 Ranging error values, obtained before the positioning step, i.e. before the spring energy minimization. . . 47
4.2 Ranging error values, obtained before the positioning step, i.e. before the spring energy minimization. . . 49
4.3 Ranging error obtained after the positioning step is iterated several times, for Neural Network the result is not available because there is no trend and it is not possible to find a plausible stop condition (Figure 4.10). . . 49
6.1 Mean and RMSE (root mean squared error) values obtained training and testing the models with various combinations of the data sets. The minimum Mean and RMSE of RSSI and ToF in each column is highlighted in bold. Unit is m. . . 74
7.1 Mean and RMS ranging errors between the target and six anchors over straight-line paths, when the RSSI-only technique and the KF are used. Resolution is 5 cm. . . 89
7.2 Average RMS and mean positioning errors when the target moves re-peatedly over a rectangular path. The reported results refer to dif-ferent solvers of the positioning optimization problem described in Section 7.2.2 and to different weighting matrices (7.8). . . 91
1
Chapter 1
Technologies for group
management in smart communities
1.1
Introduction
In the context of smart cities, an interesting subject of personalized services are groups, for example families, tourists on organized trips, school groups. For this reason, there is a broad branch of research related to the use of identification and tracking technologies to manage groups. Many wireless sensor network applica-tions require the management of group memberships, not only for the pure purpose of organizing the network (node addressing, routing algorithms), but also because the membership itself is the data the application cares about.
I consider the group membership monitoring in general as the problem of managing instances of any kind (also referred as group members) that are grouped following a given rule and that should be managed together by a group manager or by the group members their selves. An example of this are walking buses, where one or more adults are in charge of bringing a bunch of children to school. They follow a predefined path, which is considered safe and convenient, and they walk together joining new children when they meet at the predefined stops. In this example the instances are the children while the group managers are the adults.
This is just a use case that will be further analyzed later, but it is representative of many other applications where we want to know the exact list of (collaborative) at-tendees. We refer to collaborative attendees because for the rest of the thesis we discuss about technologies that require some identifying tag on the user. When the user is collaborative, the tag will be correctly managed and then it will work prop-erly, instead if the user is not collaborative (i.e. he does not want to be identified or tracked) he can easily sabotage the system by just acting on its tag.
Groups are entity that are very common in the communities and in the IoT world: examples are people with a common interest or a common aim (students, athletes, colleagues), animals to be monitored (herd, bird flock), means of transportation (shared bikes, buses), but also goods in a supply chain or in a storehouse.
In the today’s digital domain, the membership of a group can be obtained by em-ploying any technology that provides identification using wireless communication (i.e. radio identification). These technologies require to equip the instance to be identified with a kind of tag. It can be battery-less such as passive RFIDs: given their short range (at most in the order of meters) they typically require explicit ac-tion by the user (i.e. passing the RFID close to the reader to be detected). Less interaction is required if active technologies are used since the range is increased by the means of active circuitry on the tag that is typically powered by a small battery.
2 Chapter 1. Technologies for group management in smart communities Common examples of nowadays low power radio standards are: active RFID, Blue-tooth, Wi-Fi low power, 802.15.4 (or Zigbee), also long-range protocols such as LoRa or Sigfox1, each of them can be considered viable solution, the choice depends on the application requirements.
When managing groups, another key information that is often useful to couple with the membership list is the position of the members. For many applications, such as the walking bus mentioned earlier, it is important not only to know that a member is in the proximity of the manager, but also to have a measure of how far it is, so that an alarm can be triggered once the member is going too far. In partic-ular, most of the time when dealing with (moving) groups, what really matters is the relative distance or the relative position of the members with respect to the man-ager rather than the absolute position (i.e. latitude-longitude coordinates). Even in applications employing static nodes, like environmental monitoring, having the po-sition of sensors is important, both as data source and for maintenance purposes. In fact, if a sensor network collects data about temperature, humidity and atmospheric pressure for whether forecast, it is mandatory also to know the position (absolute position in this case) where the samples have been acquired, otherwise they are use-less for the purpose of the forecasts. Regarding static nodes, positions may be as-signed manually during the network setup. This is reasonable in low-to-mid sized networks, but with larger ones it may become a cumbersome operation. Moreover, by monitoring the position of nodes in static networks, the manager can understand if there are failures or sabotages and geo-reference them.
Nowadays, global navigation satellite systems (such as GPS or Galileo) can provide absolute localization on most of the earth surface; however, it is not always a viable solution because of three main reasons:
• Accuracy: typical accuracy of satellite-based positioning system ranges from less than one to 30 meters [19], which is fine for many applications, but for those relying on the relative distance, errors accumulate, and they might be no more acceptable. There are ways for reducing the error to the centimeter level [14], however cost and energy consumption grows; and in large network de-ployments the single node cost plays a fundamental role for obvious reasons. • Coverage: the satellites provide a good coverage of the earth surface,
how-ever when the open sky is not visible (i.e. inside natural or urban canyons, or indoor) satellites’ signals may be too weak or inaccurate to provide good position estimation.
• Consumption: typical consumption of commercial GPS receiver is in the order of tens of mW, which can be considered low power, but not ultra-low power that is the target for IoT sensor nodes.
For these reasons it worths studying alternative ways to obtain node location, and one of this is by exploiting radio signals that are already available for enabling wire-less communication.
1.2
Group Monitoring
In general, what it is expected from a group monitoring system is to handle every-thing that concerns the list of members and the logs of events regarding the group.
1LoRa and Sigfox are two protocols optimized for transmitting small chucks of informations (in
1.2. Group Monitoring 3 More specifically, such a system should automatically detect and identify the mem-bers of the group that are in the proximity of the manager. By using the distance estimation (or localization) it can understand the actual proximity between the man-ager and the members, and if some of them is going out of communication range, the system should trigger an alert informing both the loner member and the manager that they are probably too far away for being part of the same group. The system should also provide a periodic journal (daily, monthly, one-off, depending on the application) reporting timestamped events such as:
• Member in range: a member is detected in the proximity of the group, but it is still not part of it.
• Member join: a new member formally joined the group. • Member leave: a member left the group in a controlled way.
• Alert: a member is going too far away, or a member is no more detected (and it never formally left the group).
• Member location: relative or absolute coordinates of the member.
Having a log of what happened permits an off-line analysis that can be many fold. It may be used for maintenance (battery change/recharge, software updates), for safety, insurance or statistics (the periodic fee for the insurance or for the system concession may be dependent on the use).
Depending on the application, there may be the need of monitoring the group from within it (local monitoring) or from the outside (remote monitoring).
Local monitoring can be effectively used for instance when managing group of chil-dren on the street: given the reactivity required to intervene in case of danger, the application should have low latency in detecting dangerous situations. However, it is clear that a group manager should pay its attention to the children (that must be in line of sight) rather than focusing on the smartphone. Then the proposed system is intended to be as support of and not in place of the physical person, it can tell if somebody is missing with respect to the expected list of participants, but it cannot stop a (nowadays) car if a child is walking in a dangerous zone2.
Remote monitoring instead can be employed when the application is more latency tolerant: remaining in the context of children, remote monitoring may be applied at school. When all are in, the information from all the classrooms can be collected in a central point, where a person or a machine can check the missing ones and eventu-ally informs the parents.
This difference between local and remote monitoring is important to the purpose of stack optimization. However, the same system can integrate both and use the proper one depending on the specific application needs.
Given the nowadays’ level of penetration of technologies like smartphone and inter-net, it is strongly advisable to reuse technologies where possible, otherwise people will hardly accept solutions that require application specific devices in place of their own smartphones: this paradigm is called bring-your-own-device [42]. For this rea-son one of the key features for such a system is to be well integrated into nowadays technological ecosystem.
2 If we consider autonomous cars (that are only at prototype stage at the time of writing) their
sensing system may integrate the technology to detect people using radio frequency identification if available on the person.
4 Chapter 1. Technologies for group management in smart communities
1.2.1 Stack description
Regardless the technology chosen for the implementation, the requirements of group management with position awareness cover the full stack: from the physical layer, which is important to analyze for the purpose of localization, to the cloud services that can be used to synchronize expected attendees list (i.e. the list of service sub-scribers). It is worth highlighting that the data security in IoT applications employ-ing people identification is a crucial point, then it should be carefully addressed at all levels.
The lower layers are in charge of handling radio signals to implement wire-less communication and perform measurements to obtain location information. The communication channel will be used, at least, to send identity information, which is typically encoded in a numeric code called ID. Another kind of data that may be transmitted is sensor data or other high-level information such as position data. Since the target is the IoT, the energy efficiency of the devices is one of the top prior-ity. To accomplish this, low power radio protocols employ aggressive duty cycling technique to turn off the radio peripheral when not in use. In fact, it is known that the radio is one of the most energy hungry component of a wireless sensor node [78], then optimizing the radio operations is the first step toward the energy efficiency of the device. This optimization is typically done at low level to increase the accuracy of the behaviour and the performance of the code.
Mid layers manage the overall system logic: for instance, the device may use sensors to understand the context it is and perform actions in response of a context. In other words, if the device is steady it may lower the position report rate, saving power. Another task of the mid-levels is to manage and store device configurations, providing tools for an easy, convenient and possibly unified interface to access the settings. This seems to be trivial in nowadays systems, but in the view of IoT we will have really huge amount of sensors, if each family of them has a proprietary tool, it may become hard to set up and maintain deployments.
High layersare mostly focused to the application specific behaviours. They han-dle cloud database storage to allow a permanent and easily accessible information and event logging. If needed by the application, upon authorization they provide the mapping between the ID number and the actual identity (name, family name). High levels also include the visualization tools like web-based consoles or smartphone applications and some part of reasoning that is use case dependent. For instance, in the walking bus example, a message may be sent to child’s parents informing them that their son arrived at school. This kind of operations are managed by the higher layers because they are strictly application dependent.
1.2.2 Applications of group monitoring
Some of the possible applications of group monitoring are analyzed here, with par-ticular attention to those that can be in the ecosystem of the smart city and commu-nities. Moreover, the discussion is restricted to group monitoring applied to living beings (humans or animals) since monitoring of things have different needs. Ap-plication specific requirements and challenges are discussed and solutions to main problems are briefly described.
Children monitoring
We already introduced the walking bus application, but it can be generalized as the monitoring of children that move outdoor in one or more organized groups, with
1.2. Group Monitoring 5 various level of autonomy. Monitoring school trip, recess break in the school’s court-yard or outdoor sport (ski school, running, outdoor workouts) belong to the same class of application since all of them have a group of children being monitored by one or more adults that are in charge for their safety.
In this context, it worths highlighting that, in the last decades, childhood in urban ar-eas has changed and the technology can be used to re-establish "the spatial practices of children" [112, 97]. At the same time, there is a scarce adoption of technologies that permit precise position tracking, which are available on the market since last decade (Weenect Kids GPS Child Tracker, Ubisafe, AngelSense Kids GPS Tracker are only few examples). As pointed out by [111], these devices are mainly adopted to relieve the short-term personal anxieties without a real look at the long-term con-sequences on children’s sense of autonomy and independence. On the other hand, non-adopters prefer less intrusive practices, such as curfew or activity boundaries. For this reason, the user interaction with such systems must be carefully addressed to avoid the technology to absorb all the user attention. This consideration regards both the children and the group manager (i.e. the teacher, the parent or the adult in charge of managing the group of children).
From the technical point of view, this class of applications requires a continuous monitoring of the presence of all the children. However, as found in [111], a real time tracking of child position might be counterproductive. Therefore, only impor-tant notification should be given to the group manager: for instance, as already pro-posed, an alert can be risen when someone is moving too far for being effectively supervised by the adults. Since in this kind of monitoring the readiness of the group manager (typically a teacher or a relative) to react is of primary importance, the mon-itoring should be done from within the group. Therefore, the most convenient way to interact with the system is through a device that everybody has in the pocket and can easily being used, like a standard smartphone. Providing smartphones to all the children such as proposed in [84] might not be acceptable for ethical reasons, then we want a technology that is transparent to the child, requiring no direct interaction with the tag. At the same time, adults’ smartphones can have a low latency con-nection with the children’s tags that provide the identification and tracking, and in the meanwhile the smartphone can be connected to the internet to download other kinds of information used by the application.
In the case of school-like applications it is important to compare the actual list of group members with the expected one to obtain the list of absents by difference. A further yet controversial feature is the communication with the parents. If a child is supposed to be part of a walking bus, but it is not detected, a message could be sent to the parents. Such a message may be alarming for them, therefore a double check is recommended to avoid false alerts due to empty batteries or a tag that has been forgotten at home.
Museum or guided tours
Another quite popular application of group monitoring is related to the guided tours both in museum or outdoor areas. In [29] the group monitoring concept is used in the context of guided tours in museums where RFIDs and Wireless Sensor Network are employed as technology enabler. Authors highlight that the group is composed of peers, and, contrary to Children monitoring applications, the guide is the group manager, which is not intended to be a supervisor. She/he will be just a guide, and therefore, the members may be free to step away from the main group for some time if they are interested in something the other members do not care about. Localization
6 Chapter 1. Technologies for group management in smart communities is used to inform the member about the position of the main group in case she/he get lost. Another important requirement is the coexistence of different group in the same area.
The guide becomes an autonomous robot in [23]; in this case a key role is played by the localization techniques (based on a mixture of tactile, infrared, sonar, laser sensors), which is mandatory for ensuring the autonomy of the robot. A simpler ultrasound based system that runs on users’ smartphones is presented in [17] where the focus is the use of personal devices (i.e. smartphones) as electronic guide in or-der to reduce the cost for ad-hoc solutions typically employed in museums. The outdoor scenario is considered in [97], where gamification techniques are applied to digitally augment field trip. The game’s hardware architecture is composed by several different kind of devices (pingers) that are carried by children. This appli-cation might be also included in the Children monitoring class of appliappli-cations. From the point of view of this thesis, the more relevant pingers are those used for location and/or context detection: in fact, for absolute localization the information is ob-tained through the GPS Pinger complemented with Dead Reckoning Pinger, while for relative localization (for detecting the proximity to a point of interest) short range radios (Location Pinger) are preferred. This confirms that the GPS is not the final solution for localization, in particular when the goal is to detect relative proximity rather than the absolute position.
Therefore, in this class of applications, the system with the localization feature can be used for two main purposes: provide a digital guide with description and suggestion based on the position (absolute localization is then a requirement), keep the group membership coupled with members’ location to allow sharing this infor-mation with the other members and/or the human guide. To these purposes having a basic tag for identification and localization is not enough; instead, the system can be implemented with the users’ smartphones in a way that every member can install an application, which will act as interface with the system and, at the same time, the smartphone’s resources are used for the identification and localization.
Moreover, also the museum managers can benefit from such a system, in fact they can have a remote console from where they monitor the number of presences both for statistical and safety reasons. For this purpose, all the museum guests have to be forced to carry a compatible tag or the smartphone with the application running.
Sports competition
For this use case, we distinguish between two kinds of sport competitions: sports played in specific fields (like basketball or rugby) and sports played outdoor (like running or cycling). An example of the former is provided in [53] and in [52] where the WASP system is described: a large radio bandwidth (125 MHz) in the 5 GHz ISM band is used to locate players with respect to a number of reference nodes (an-chors) and with a high sample rate (up to 200 Hz). The architecture requires ad-hoc hardware that is build using commercial low-cost components. Using this system, athletes can be tracked in the play field with respect to the anchors; however, there is no link nor range estimation between athletes (only between athletes and anchors), then the localization can be done only in confined environment (indoor/outdoor fields) and relative group localization is not considered here.
Instead, for those sports where the key information is the position of the athlete with respect to the others, rather than the position with respect to a play field or to a fixed infrastructure, cooperative localization [92] is a more adequate technique. In cooper-ative localization, nodes perform range estimation not only to the anchors, but also
1.2. Group Monitoring 7 to the peer nodes. In the absence of fixed anchors, mobile nodes can still localize themselves with respect to the others. This can be very effective in competitions like cycling or marathons, since many athletes (hundreds) might be moving in group. In this situation, the absolute location of the single participant is not relevant, however, the relative position inside the group can be an important information for the strat-egy.
In this use case, the group members (i.e. athletes) do not like to carry extra weight; then the devices need to be small and they should work without the need of user in-teraction since the monitoring is mainly remote: this means that the system should be as transparent as possible for the athletes. Their assistant or trainers will com-municate only relevant information using other channels (just voice or using radios if they already in place). If this is applied to non-professionals athletes, without a personal training team, the same information can be accessed directly by athletes if they accept to carry a smartphone like device.
Crowd monitoring
In large public events such as concerts or religious events being able to monitor the crowd can be highly valuable for safety reasons. It is not so unusual that large crowds go out of control creating panic, then wounded and even deaths. Of course, a monitoring system will not directly protect event participants, but it may help the organizers to manage the crowd avoiding creating dangerous situations.
In [13] it is highlighted how passive sensing techniques such as those based on cam-eras can detect crowd flow, can count people and estimate the crowd density; how-ever, they fail when accurate mobility patterns need to be analyzed on the long scale. The author indeed identified the Bluetooth Low Energy (BLE) to be a viable technol-ogy to the purpose; in fact, it is cheap, low power and pervasive. In the proposed experiment, where the aim was to detect people mobility, we could say that "the crowd is sensed by the crowd". In fact, both the BLE beacons and the BLE scanners (smartphones equipped with an application that scans for BLE devices) are carried by participants. Contacts between the beacons and the scanners are pushed to an online server together with the GPS location of the contact. Even in such collabo-rative scenario the privacy can be ensured if no association between beacon ID and the person who is carrying it is made during the deployment, the same considera-tion applies to the smartphone app.
It is also important to note that, in this class of applications, it is impractical to tag hundreds of thousands of users: tagging only a relevant subset of them is a choice, using people’s own devices to this purpose is another choice (in [13] a mixture of the two is employed), complementing it with other complementary technique (camera based) is another choice.
Smart City
Being cities and communities made of groups of people, the concepts of group man-agement and localization find several possible applications in the context of Smart Cities and Communities. Smart Cities experts envision applications that are de-scribed as: smart transportation, smart grid, smart health, smart waste collection, authors in [90] define it Smart World. To make a city (or the world) smart, a set of components are required. Probably the three most important are: a network to allow information communication between entities, a processing power to process the available information, and the data sources that generate the information. As
8 Chapter 1. Technologies for group management in smart communities pointed out by the authors, location and time are the most relevant underlying fea-tures of any observation (after the observation itself), and since Smart City appli-cations will be fed with data coming from observations, localization in Smart City must be more pervasive and accurate. In fact, for what concerns the time, technol-ogy already permits to timestamp the data with a very high accuracy and resolution, while for what concerns location this is not always realized.
Wildlife monitoring
Not only groups of humans can be monitored, also animals can, in fact one key tool for zoologist and biologists is to monitor animals’ movements and interaction in their daily routines. For instance, authors in [93] applied a technique similar to the one described in Section1.2.2but using much more constrained devices. In fact, they use a low power contact detection technique (also referred as neighbour discovery) applied to 802.15.4 radios to detect proximity between mid-sized animals (deer, fox). Any contact between animals activates a GPS receiver, coordinates are stored to a memory and the georeferenced contacts are then off-loaded using either fixed nodes in the wood or alternatively, in the absence of the previous, using an on-board mo-dem. Energy consumption is also studied, and a model based on a weighted average is used to help biologist choosing the proper set of parameters to reach the most ap-propriate trade-off between accuracy/resolution and consumption. Much smaller animals are instead considered in [79] where a miniaturized BLE based device tar-gets the collection of small birds’ vocalizations. In this case the main challenge is to compress weight and size to avoid stresses to the animal and hence a change in the behaviour, which is obviously unwanted. To this purpose minimal components are allowed on the device; however, it can still acquire audio from a contact microphone and also, temperature. Even if not explicitly described in the paper, the presence of the short range BLE radio allow to geo-reference acquired data. If these techniques are applied for studying the animals, remote monitoring with offline data analysis may be enough; instead for other animal related application the requirements may be the opposite. When dangerous animals (bears, wolfs) reach villages they can be harmful, by having a system that detects them an automatic bollard may discourage their stay or alternatively a communication may be sent to forest rangers. This is what has been done in the BearFence project [89], where contact detection of bears (based on collar mounted RFID) has been used to localize the animal in a protected area.
It must be noted that an animal cannot be considered a collaborative user and, to detect it, the tag must be deployed on the animal itself. This procedure may be chal-lenging and if only a fraction of the herd is tagged, the effectiveness of the system drops as in the crowd monitoring (Section1.2.2) class of applications.
Some of these applications are already addressed by specific technologies, for instance in the context of sport, position trackers based on GNSS and inertial sensors are already in use. For the purpose of crowd monitoring phone cells data could be analyzed, and some specific wildlife trackers are used by biologist. However, it is very difficult to find a technology with enough flexibility to fulfill the requirements of more than one application.
1.3. Requirements and challenges 9
1.3
Requirements and challenges
Using radio signals to identify and localize things or people is not a new concept. The radar is one of the first devices exploiting the radio signal to localize object by listening to the signal echo reflected by the object itself. However, a technology that can fulfill all the requirements of the previously mentioned use cases have not still emerged. There are many technologies nowadays fulfilling very well a specific set of application requirements; however, a general yet flexible and convenient solution for all cases still does not exists.
Therefore, to choose the technology that better fits the application, it is mandatory to define a set of design parameters, on which the application requirements will be based. The most relevant are:
• Energy efficiency: a typical requirement of an identification device (i.e. the tag) is to guarantee a long battery life in the order of years with reasonably small battery. A bracelet-like device, for example, to be wearable and not cumbersome needs a small-size battery such as those available today, e.g. a 15x10x2.7mm3battery with a capacity of 25 mAh. However, to guarantee that such kind of battery lasts 1 or 2 years, the average consumption should be in the µW order 3. Properly configured Bluetooth Low Energy devices are not
that far from these values [44]. BLE Manufacturers often rate their beacons to last more than one year with a small coin cell battery.
• Range: communication range depends on many factors: transmission power, modulation scheme, antennas gain, receiver sensitivity, carrier frequency and bandwidth, environment and other. For most of the mentioned applications, the required range does not overcome 100 m. Since the data is used locally, a longer communication range is not mandatory. A longer communication range might look always welcome; however, this should be traded-off with power consumption and with scalability. In fact, the easiest way to increase the range is to increase the transmission power, however this leads to higher en-ergy consumption; at the same time a longer communication range will reduce the spatial reuse of spectrum, since communication collisions can happen on a wider area effectively reducing the maximum supported node density. Fur-thermore, the network can be equipped with a gateway connected to internet; this, with the help of cloud services and protocols can make the data available anywhere there is an internet connection.
• Localization accuracy: radio based localization is a well studied topic in par-ticular in the wireless sensor network community. Many signal processing techniques have been proposed [113,69,12,74,91]. However, what really sets the accuracy is the metric that is used for estimating the distance, which can be for instance, RSSI or time-of-flight.
The required localization accuracy for almost all applications mentioned in this chapter is in the order of 1 m (sport applications typically require higher accuracy).
• Reliability: if the radio device is supposed to be used in safety critical applica-tions, the reliability of both the acquired data (sensors, location) and the device itself (it must be rugged) plays a fundamental role. For instance, many of the
3The maximum accepted consumption that satisfies the wanted battery life (given the battery size)
is estimated with: target battery lifecapacity = 25[mAh]
10 Chapter 1. Technologies for group management in smart communities Bluetooth modules on the market are made with commercial grade compo-nents that may fail in critically harsh environments.
• Scalability: if radio identification and tracking is performed on large scale, the technology should be scalable enough to avoid network congestion. It is a common experience to have problems with the cell phone system when there are too many people that use the phone in a small area. In that case a single cell cannot handle all the traffic and some of the user will be put offline. In this regard requirements are application specific; then, an adaptive solution is advisable: when many nodes are in the neighbourhood it should use conser-vative settings such that the network does not get congested, while when the group is small the settings may be tuned to optimize other parameters (such as latency)
• Latency: because of scalability and energy efficiency aspects, the radio cannot transmit all the time; some form of duty cycle has to be applied. This makes the system active only a fraction of the time and then the detection can suffer of latency.
• Security: security of data is another key aspect of a radio identification beacon. If the personal device broadcasts the user identity all the time in clear, an of-fender may sniff the data and understand where the user is or where she/he is not violating basic privacy rights.
• Throughput: links speed is one of the few relaxed requirements, in fact to rec-ognize a device only the ID must be transmitted. The ID length can range up to 128 bit (16 bytes) that is the length used in the definition of UUID given in ISO/IEC 9834-8:2005 that is often used when a unique identifier is required for any reasons. If the full ID is transmitted every 100 ms the required through-put is 1.28 kbps, which can be considered low throughthrough-put (it is less than 1 % of what available on modern wireless communication standards [21]). There are however cases where higher throughput is necessary, in fact if the appli-cation requires multihop contacts detection, any node, together with its local information, will also forward the list of its neighbours, and maybe also the list of the neighbours of its neighbours and so on. This increases the required throughput exponentially with the size of the network, imposing severe limits on the system scalability.
1.3.1 Application specific vs generic solution
Given the wide spectrum of possible applications, a question arises: do we need an application specific device for each of them, or a common solution may be em-ployed? Requirements are similar, then the same technology may apply; unfortu-nately, such technology does not exist yet. An ideal candidate for group manage-ment in IoT application should be flexible from the physical layer up to the cloud to fit the widest range of applications.
A viable solution may be to create a hybrid design, with heterogeneous radio in-terfaces for the different purposes. Anyhow, such hybrid solution might become complex, because different standards (Bluetooth, LoRa, 802.15.4, UWB) will expose proprietary and not compatible interfaces. Moreover, the hybrid solution built with the fusion of multiple standards should manage these standards such that they do not conflict and their use is well defined. In other words, a standard use of standards
1.4. Case Study and motivation: The CLIMB project 11 should be defined. This seems not to be a viable way because concerting different standards to work together while guaranteeing interoperability and compatibility is not convenient. Then for now, system designers are forced to make application specific solutions.
1.4
Case Study and motivation: The CLIMB project
During my three years of PhD school I have tested some of the technologies that are suitable for group management. I tested them within the context of walking buses organized to bring children at school.
The CLIMB project of Fondazione Bruno Kessler aims at promoting the independent mobility of children inside the neighbourhood . To this purpose IoT technologies are used to monitor their way to school. Parents volunteer to supervise the walking bus, which have a time schedule and predefined stops, and the children, instead of reaching the school on board of the parents’ car, they walk to it together. For insur-ance and safety reasons, adult volunteers of the walking bus are requested to write a daily journal to keep track of all the children presence. Usually, this journal was compiled manually, which is not the most appropriate way if at the same time the volunteer has to supervise some tents of children on the road.
For this reason, at Fondazione Bruno Kessler we designed an IT solution employ-ing Bluetooth tags for recognizemploy-ing the children and help the volunteers recognizemploy-ing them through a smartphone application. From the technological prospective, I iden-tified the following high-level functional requirements for the basic group manage-ment:
• Continuous discovery of new group members
• Detection of member leave (relative members localization) while non-functional requirements are:
• Detection latency should be less than 5 s
• Scalability should be guaranteed up to hundreds of nodes (the target will be 150)
• Communication range in the order of hundred meters: it often happens that children form long caravans when walking on the sidewalk, the radio contact to the manager should not be lost in that case.
• Compatibility with personal devices such as smartphones will help the adop-tion
• Low maintenance efforts: being this system management (i.e. the need of man-ually turning on/off devices) or pure maintenance (i.e. the battery life should not be shorter than three months).
Others and more specific technical requirements will be given in the next chapters. The group management system will be also complemented by a game (Kids Go Green, [81]) to improve user engagement, then encourage the adoption and keep the motivation high on the long period. The design, validation and description of this game is out of this thesis’s scope.
12 Chapter 1. Technologies for group management in smart communities in the IoT and smart city ecosystem, providing basic functionalities to walking bus users and at the same time exploring more advanced functionalities offered by the technology.
1.4.1 Evolution of the walking bus management system
The present section is an overview of the thesis. It describes the evolution that the walking bus management system has undergone during the doctorate.
Bluetooth Low Energy (or BLE) has been chosen as the most appropriate technology because of three main reasons:
• Energy Efficiency: manufacturer declare that in its basic use (beacons) devices can last a couple of years when powered by a small battery with capacity in the order of 200mAh
• Pervasiveness: BLE is now supported by almost all personal devices (smart-phones, tablets, pc)
• Communication range: in open field the range of a BLE beacon (with 0 dBm transmission power) overcome 60m, when nodes are carried by children in the backpacks the signal propagation is perturbed, but it is still adequate for the application.
BLE have many interesting features that perfectly fits this sort of applications, how-ever lower layers are not optimized for localization or range estimation. Moreover, latency-scalability trade-offs are not well defined and sometimes device dependent. To the purpose of better characterize and understand the possibilities offered by the BLE devices, several experiments and applied studies that asses the unknown aspect of BLE have been carried on in this thesis.
First assessments have been focused on a basic characterization of throughput and consumption trade-offs during data streaming operations (Chapter2). Even if the use case is a bit different from the group management task, we used the same anal-ysis technique in several other situations.
After this preliminary study, the first version of the group management system (MIGnOLO - ManagIng Groups with bluetOoth LOw energy) has been developed and it is described in Chapter3. Localization on version 1 of MIGnOLO is based only on RSSI and literature on this technique suggest that the accuracy is low [54]. The first attempt to cope with the low accuracy is to approach it with brute force, which means adding more input data to the problem and let a machine learning algorithm to find out patterns of behaviour (Chapter4). From this point of view, version 1 of MIGnOLO was able to collect really a large amount of data, anyway it suffered of two interconnected problems:
MIGnOLO (ManagIng Groups with bluetOoth LOw energy)
• Excessive current consumption: to collect the additional data needed for en-forcing the localization algorithm, the radio duty cycle had been substantially increased, reducing battery life to 3-4 weeks. This is not acceptable for a system that should be transparent to the children and their parents.
• Localization accuracy brought by the brute force approach did not increase sufficiently to justify the battery life reduction.
1.4. Case Study and motivation: The CLIMB project 13 The first version of MIGnOLO have then been updated to the version 2 with reduced functionalities (with respect to the version 1), however it required much lower main-tenance efforts due to the reduced energy consumption. This version employed the simplest form of BLE device: beacons. They periodically broadcast a small packet of information containing (in our case) a numerical ID. This packet can be received by all neighbouring devices just by activating the BLE scanning and without the need of performing any kind of pairing or synchronization. On the other hand, data transfer is not acknowledged and the available throughput is rather low.
Still, some other open challenges remain in this version of MIGnOLO; in fact, scala-bility and latency where assessed only experimentally for a reasonably low amount of beacons (less than 30). This is enough for a single line of walking bus; however, when multiple lines merge during their way or when all the lines meet at school the number of beacons easily overcome 100, then a deeper analysis is needed to ensure system stability.
The focus of the work moved then to the study of the performance of more complex networks involving communication over the BLE advertising mode (Chapter5). For this a BLE Link Layer simulator that aims at detecting packet collisions has been de-veloped, given that colliding packets will be always corrupted at the receiver side. In real world this is not true, in fact, if two packets collide but one has much higher power with respect to the other (this happens when the first node is close to the re-ceiver, while the second is far away), the first one may be properly received while the second remains masked4.
The same simulator, properly adapted, have been used for assessing some energy ef-ficiency techniques that are suitable for the consumption optimization of the version 1 of MIGnOLO. I will show that the technique is effective in Chapter5; however, it requires a new hardware component, a BLE compatible wake-up radio [106,100,94] that at the time of writing is not available on the market.
The last and largest part of the study was addressed at the improvement of localiza-tion techniques to be used on top of BLE. Great effort has been spent to improve RSSI (Received Signal Strength Indicator) ranging and localization. However the drop of performance when passing from ideal testbed to real world deployment was not acceptable. For this reason, the approach has been changed by embedding the time-of-flight as input information into the localization algorithm. Radio signals’ time of flight is known to be a good distance estimator. In fact, it is employed in GNSS (Global Navigation Satellites System) and on many of its terrestrial predecessors. Since the time-of-flight is not available on commercial BLE modules, an ad-hoc soft-ware library has been developed for that purpose. It adds this functionality to the BLE just by using the resources available in the system-on-chip (SoC). This means that no specialized hardware is required and although the library demonstrate the principle only on one family of BLE chips, similar functionalities can be ported on all BLE SoC. The description and characterization of this alternative ranging technique can be found in Chapter6.
Time-of-flight alone is not a breakthrough in BLE based localization since the noise level of raw data is quite high (up to 10 meters) to be directly used; however, the overlying noise is more gaussian with zero mean with respect the error found with
4Note that if a beacon is far away and its packets are always masked by closer beacons, the receiver
will never discover the remote one. We are interested in having the whole list of beacons (i.e. children) then if a node is never discovered it means that the system is not reliable, therefore the simulation results remain valid even if they discard the effects of the physical layer.
14 Chapter 1. Technologies for group management in smart communities RSSI. This means that by applying the proper filtering techniques distance estima-tions can be cleaned out and effectively used for localization and tracking. In Chap-ter7, the description of the filtering and tracking technique for indoor anchor-based applications is provided. With minor changes this technique can be extended to per-form anchor free relative localization.
The final version, i.e. version 3, of the MIGnOLO system will then use time-of-flight measurements to estimate relative members distance. The algorithm that performs the filtering will be embedded in the tag nodes while the group shape will be com-puted in the adult’s smartphone.
At the time of writing, version 3 of MIGnOLO is still in progress, therefore I will present only ideas and proposals for the future work.
1.4.2 Premise and contextualization
The present thesis has been carried out in a constrained context. The CLIMB project started as a relatively confined experimentation (one school, twenty parents, forty children), and in a couple of years more schools joined bringing the number of testers (children and parents) to more than 600 people. It must be clear that the develop-ment of smartphone applications, cloud services, the game, and all the components not mentioned in this thesis has been a work of the Smart Community team of FBK, who worked with me and other colleagues in order to embed the proposed group management solution into the CLIMB smartphone application.
Practical limits in such context are countless:
• At the beginning of the project (2015), only a fraction of our users’ smartphones where equipped with BLE connectivity since Bluetooth was supported only in its previous versions. Even where present, the software support was poor and device dependent, making it very hard for the developers to create a stable and usable application.
• A variety of smartphones platform (Android, iOs, Windows Phone) further complicates the development.
• The environment of the experimentation are mainly the roads of small villages in the neighbours of Trento. In such situation very small attention is given to the experimentation itself since the volunteers, obviously, pay more attention to children rather than the application running in the smartphone, making it difficult to get feedback about encountered problems.
• For technical and privacy issues, it is almost impossible to retrieve a ground truth to be compared with system’s observations.
• Deploying a new feature on the BLE devices requires, in most of the cases, to flash a new firmware on all the devices. This means retrieving all of them, flash one by one and return them to the testers. We found this to be really impractical, then we gave more importance to the stability and the absence of maintenance of the solution, rather than improving the system with more functionalitie. Therefore, some of the methods described in the thesis are tested on smaller testbeds that are easier to control).
• Given the high number of BLE devices that can be found in a typical scenario (hundreds), ensuring the stability it is not easy. For instance, performing a scalability test in a real scenario would require all the hundreds of devices
1.4. Case Study and motivation: The CLIMB project 15 to be together, this is not easy because of cost and feasibility (any parameter change requires all the devices to be reprogrammed).
For these reasons not all the techniques proposed in this thesis are actually in use in the walking bus. Nevertheless, reported results are based on real experiments exe-cuted on real hardware and where possible the test setup tries to mimic what can be found in the walking buses. Simulations are only used to asses Link Layer behaviour in crowded environments (hardly feasible otherwise). The custom simulator devel-oped is firstly validated in Chapter 3.5.2, and then it is refined and expanded in Chapter5.
Note about the IoT acronym: the application scenario of this thesis is the nowa-days ecosystem of heterogeneous devices with communication capability and some form of processing power (this often make them be defined smart things, even though the smartness of something should be weighted considering how the processing power is used). In literature this is often referred with Internet of Things or IoT. During the PhD I head this acronym more times than I can contemplate, and I found that it is used in at least two different scopes.
For people working at network or cloud level, the most important part of IoT is the Internet, and for them IoT refers to the set of tools, rules, protocols and technologies that allow the communication of any kind of data between heterogeneous devices and services, how the data is produced is not of primary importance for the devel-oper.
Instead, for those that work on hardware, or low-level communication (typically wireless) the most important part of IoT are the Things, and how the data is trans-ferred to the end user is not a key point.
It is clear that, in the IoT context, the internet without the things (and vice versa) will be of scarce use, then there is no reason to consider one more important than the other.
In the present thesis the focus is the second scope, the Things, and when mentioned, IoT will be considered from the Things point of view.
17
Chapter 2
Bluetooth Low Energy Analysis
2.1
Introduction
Bluetooth and in particular the Low Energy version emerged in the last years as enabler for many applications. Given its range (from few meters to 100 in optimal conditions) and its energy efficient controller, it has found many applications in par-ticular in the context of wearables. Such devices at least employ some sensors, a radio interface and an MCU that is used both for the management of the overall sys-tem (reading sensors, managing radio interface) and for preprocess data to be sent through the radio.
The most frequent scenario is the use of wearable Body Sensor Networks (BSNs) for the monitoring and analysis of selected features of the human body. Dedicated sig-nal processing techniques extract high level information from sensor data, both in real time and offline, providing useful insights of the user’s state and performance. A common BSN architecture is formed by multiple sensing nodes and one central unit, acting as data collector, processing hub and gateway towards further systems. The sensing nodes usually have a very limited dimension to be comfortably worn on the point of interest, hence they are carefully designed for wearability embedding the very needed sensing and communication technologies [24].
While in the past years there was research and development of custom wearable central units, now smartphones are the standard option in most of cases. This is supported by several reasons: their cheap availability and the possibility for the development of custom applications, the ease of use and the robustness of such so-lutions and their ever growing computational and communication capabilities [7]. Radio interfaces and communication protocols have always been a crucial part of BSNs. Their choice determines the nature of the data that the network will be able to exchange, setting the BSN specifications in term of supported number of nodes and data throughput or latency [26]. Every application has its requirements in terms of throughput, latency, number of nodes, then the flexibility of the protocol is crucial to tune it to the specific application. Moreover, the communication subsystem is usu-ally the most power-consuming one, hence the need for its optimization and energy efficient power management [15,77].
Since the beginning of the development of BSNs, several standard radio protocols have been employed, including Bluetooth, ZigBee, ANT [34], along with ad-hoc pro-posed solutions [22]. With the diffusion and adoption of smartphones, it has become more convenient to rely on standard protocol supported by almost all mobile phones and tablets, eliminating the need for additional hardware. This resulted in a wide adoption of Classic Bluetooth1 for the wearable nodes, even with its limitations in terms of number of devices and high-power consumption.
18 Chapter 2. Bluetooth Low Energy Analysis The development of the Bluetooth 4.0 standard (also called Bluetooth Low Energy or BLE) was directly targeted to increase the energy efficiency and device connectiv-ity of such protocol, with positive impact for wearable devices and BSNs for both consumer and medical applications [5]. However, it is not compatible with previous versions of the standard, having different stack layers and data exchange protocols and its low energy optimized profiles result in a reduced data rate.
In this chapter we start analyzing the BLE protocol from an application point of view, trying to extract an analysis methodology that can be applied also to other scenarios. For doing so we target data streaming applications with high throughput and reli-ability requirements, such as wearable healthcare applications, and we explore the capabilities of this protocol in relation to its tunable parameters. To avoid being too biased by the BLE implementation we will repeat the same analysis on three widely used BLE chips.
We consider a BSN scenario with up to 6 wearable devices connected with a smart-phone and we focus on application-level development. While existing literature relies mainly on simulation and hardware/software customization of the used de-vices, we target real-life scenarios for application development, avoiding the need for hardware or stack development. The chapter discusses the observed results and provides indications if BLE is suitable for an application and guidelines for efficient deployment of BLE based BSNs.
In the following Section 2.2 we introduce the related works and, for the reader’s convenience, we present an overview of the BLE protocol focusing on the top layers of the stack in Section2.3. Power consumption is analyzed and modelled in Section
2.4, while Section2.5describes the implemented BSN. The experimental setup and results are reported in Section2.6and discussed in Section2.7, together with guide-lines for an optimal BLE performance. Finally, the last Section VIII concludes the work.
2.2
Related work
Since the introduction of BLE in 2010, its benefits in terms of connectivity and low power consumption have been exploited in BSNs, with several applications: motion sensing [76,117,66], ECG and biopotential sensing [118,58,107,32], blood pressure measurement [72]. BLE is optimized for low power applications and its power con-sumption has been compared to competing communication protocols (Bluetooth, ZigBee and ANT) [34]. In particular, the comparison with older Bluetooth versions highlights the energy benefits of this widely adopted solution [118,32].
The drawback of the BLE solution is the relatively low data throughput that a device can achieve. In [46], a model for throughput estimation is presented with a calcu-lated maximum throughput of 236.712 kbit/s, but it does not consider the limited hardware resources available on real BLE chips. Furthermore, the calculation is done in master-to-slave direction and a master device usually has significantly less hard-ware/software constraints than a BSN node. In [83], a BLE performance analysis is accomplished and compared with results obtained from other wireless transmission protocols. For BLE they report a maximum experimental link layer throughput of 122.6 kbit/s, but this work did not use the upper BLE stack layers and the achieved throughput considers also the packet overhead, which does not contribute to the application data throughput. In [47] similar theoretical results have been reported with the additions of experimental tests, which highlights that with a real device the