Accurate Performance Estimation
of high-speed Digital Optical Signals
A. Peracchi, L. Banchi, R. Corsini, E. Ciaramella
Scuola Superiore Sant’Anna, Via G. Moruzzi 1, 56124, Pisa, Italy
email: [email protected]
Abstract: A novel technique allows an easy and accurate estimation of the system BER by
collecting the statistical distribution of the analog samples, i.e. before decision. The scheme is confirmed by both simulations and experimental measurements.
OCIS codes: (060.2360) Fiber optics links and subsystems, (060.4510) Optical communications
1. Introduction
Estimating the system performance, i.e. the bit error ratio (BER), is a key function that can be used for performance monitoring. This becomes particularly relevant in transparent networks, where the signal quality is monitored only at the path end, i.e. at the receiver, by means of Forward Error Correction (FEC) [1]: in order to better monitor the network, one must be able to locate of any source of impairment. To this aim, any network node should implement a monitor unit working on the pass-through signals, possibly shared among various channels. The most straightforward and cheapest approach for this unit would be to tap the monitored signal, photodetect it, synchronous sample the analog electrical signal, at the bit center, and further processing the analog samples. One may think to process the samples to get the Q factor [2]: although this is based on the erroneous Gaussian approximation [3], yet it can still provide an effective BER estimation for OOK signals [4]. However, the Q factor requires collecting all the statistical samples over a wide region (e.g. from the average zero to average mark level), which in a real implementation may be unpractical. Secondly it fails whenever intersysmbol interference (ISI) becomes non-negligible [5]. This last issue can effectively addressed in numerical simulations [5], but it prevents applications in the real implementations.
Here we present a novel approach that allows to estimate the system performance by analyzing the statistics of the samples only in a limited region around the optimum threshold ThO. The key point of the presented technique is the finding that, around ThO, the BER(x) curve is confined between two rescaled copies of the probability distribution function (pdf) of the received samples (x). Measuring (x) around ThO is thus enough to estimate BER simply and effectively. Our method is found accurate even in presence of high ISI, by both simulations and experimental measurements. It can be implemented using commercial equipment with limited cost and power consumption..
2. Concept
We demonstrate that , in a reasonable region around ThO, the BER(x) curve is confined between two curves that are rescaled copies of the pdf (x)of the analog samples having amplitude x. (x) is including the two pdf’s
corresponding to both 0 and 1 transmitted bits (p0(x) and p1(x), respectively), i.e. (x)=1/2*(p0(x)+p1(x)). In the region around ThO, these two contributions can be approximated by a descending/ascending exponential (p0(x)c e0 x /0 , p1(x)c e1 x/1). We note that c0, c1, 0, 1, are fitting parameters, i.e. they are not known a priori; although p0(x) and p1(x) are not separately known, we easily obtain these fitting parameters from (x) around ThO as can be seen in Fig.1. Here we graphically represent the approximation (black curve: (x)); red: p0(x); blue: p1(x)); in the logarithmic scale, the two approximations (green and magenta curves) have a linear trend.
We then insert these fitting exponentials into the well-known BER integral [3]; carrying out the integration, by simple mathematics we finally obtain the key approximation for the BER(x) curve. This allows us to derive two simple upper and lower bounds, both based on (x). Namely, we obtain that 0(x)<BER(x)<1(x), if, as common, 0 <1; these bounds are exchanged in the (unlikely) case that 1 <0.
The above expression is the key to estimate BER since 0 and 1 typically have the same order of magnitude. It shows that the BER is up- and low-bounded by two scaled version of the amplitude histogram function (x). 3. Numerical and Experimental Results
The approach was first tested by numerical simulations. We modeled a OOK 10 Gb/s signal with ASE noise and extracted the(x), the BER(x) and the bound curves by Monte Carlo simulations at different OSNR values; we
Tu.6.A.7.pdf 1 7/27/2011 4:26:13 PM
repeated the simulations with some significant ISI, introduced by a variable amount of uncompensated chromatic dispersion. In Fig. 2 we present the effectiveness of the method in a back-to-back simulation (10.5 dB OSNR): in the upper part, we report the pdf of the samples (x) (blue circles), from which we obtain the two scaled curves of 0(x) and 1(x) (red triangles and green squares, respectively). In the same figure we also report the BER vs. threshold (black dots). We find that, around ThO, this BER curve is really comprised between the two above curves,
0(x) and 1(x) which, in the logarithmic scale, look simply as two vertical translations of the original (x). Thus the optimum BER is found indeed in the interval given by the two minima of bound curves.
We then experimentally assessed the effectiveness of the BER estimation. In Fig. 3 we show the experimental setup. A DFB laser was externally modulated by a LiNbO3 modulator driven by a programmable pattern generator (PPG); the transmitter produced a 10 Gbit/s NRZ signal (PRBS, length 231-1). The signal was amplified by an EDFA and noise-loaded by coupling it together with the ASE noise from another EDFA. At the receiver end, the signal was optically filtered, detected by a PIN photodiode (sensitivity -18 dBm), and we acquired on a common PC the analog samples at the eye center (giving the (x) ), taken by a sampling oscilloscope over a long measurement
time; on the other hand, we also measured by a BER tester (BERT) the BER-vs.-threshold curve. We first run the tests by using the well-known noise-loading and then inserted a significant amount of single mode fiber (SMF, up to 110 km) to produce also ISI.
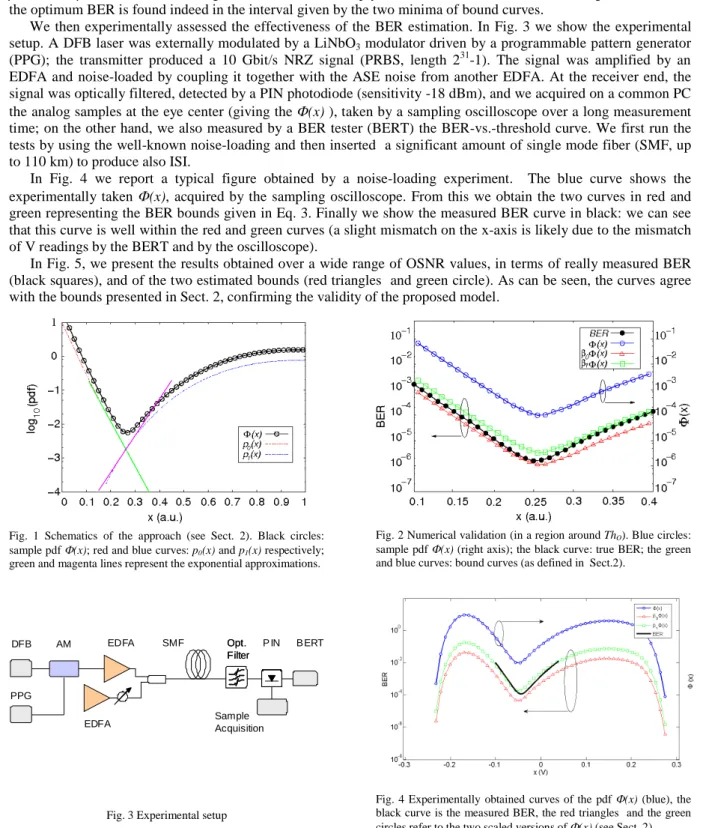
In Fig. 4 we report a typical figure obtained by a noise-loading experiment. The blue curve shows the experimentally taken (x), acquired by the sampling oscilloscope. From this we obtain the two curves in red and
green representing the BER bounds given in Eq. 3. Finally we show the measured BER curve in black: we can see that this curve is well within the red and green curves (a slight mismatch on the x-axis is likely due to the mismatch of V readings by the BERT and by the oscilloscope).
In Fig. 5, we present the results obtained over a wide range of OSNR values, in terms of really measured BER (black squares), and of the two estimated bounds (red triangles and green circle). As can be seen, the curves agree with the bounds presented in Sect. 2, confirming the validity of the proposed model.
Fig. 1 Schematics of the approach (see Sect. 2). Black circles: sample pdf (x); red and blue curves: p0(x) and p1(x) respectively;
green and magenta lines represent the exponential approximations.
PPG DFB P IN EDFA Opt. Filter Opt. Filter B ERT Sample Acquisition SMF EDFA AM
Fig. 3 Experimental setup
Fig. 2 Numerical validation (in a region around ThO). Blue circles:
sample pdf (x) (right axis); the black curve: true BER; the green and blue curves: bound curves (as defined in Sect.2).
Fig. 4 Experimentally obtained curves of the pdf (x) (blue), the black curve is the measured BER, the red triangles and the green circles refer to the two scaled versions of (x) (see Sect. 2).
Tu.6.A.7.pdf 2 7/27/2011 4:26:13 PM
Fig. 5 Experimentally estimated bound curves (green and red, from Sect. 2) together with the directly measured BER values (black) at different noise-loading conditions.
Fig. 6 Experimental BER estimation over 100 km SMF (P=13 dBm). Blue: measured (x); black: measured BER; red and green: bound curves.
Finally, we also checked the effectiveness of the solution when also introducing significant dispersion and nonlinear effects. We placed the SMF before the receiver, switched off the noise loading and increased the output power of the booster before the fiber (up to +13 dBm). The SMF length was chosen in order to have a condition where the dispersion-induced ISI is still significant. In all cases we found good the BER very closely estimated by the region between the two bounds. As an example, we report a typical result in Fig. 6, which was taken for a 105 km-long SMF line and 13 dBm input power. Again, the blue curve is the experimentally obtained (x), from this we
derived the bound curves (green and red). It is to be noted that in this case the two parameters 0 and 1, extracted by (x), are very similar, thus the two bounds almost coincide. According to our method the BER at ThO is thus estimated to be around 3 10-7; on the other side, we experimentally found that it was 1.5 10-7. As can be seen, this is in a very good agreement with the above estimation. For comparison, in the same conditions the Q factor gives an estimated BER of 2 10-4. This clearly indicates that our approach provides far more accurate estimations, particularly in the border-line conditions of optical systems with FEC (BER10-3). Similar results, although not reported because of length constrains, were obtained for other SMF lengths: in all cases, we found that the BER estimation by our method was much more accurate that the one obtained by using the Q factor.
4. Conclusions
A novel approach gives a high accuracy estimation of the BER in a common direct detection signal, without using FEC. We found that the BER(x) curve is bounded by two translated curves of the sample pdf (x). Therefore the
knowledge of the (x) around the optimum threshold is enough to get a reliable BER estimation. After numerical
checks, we tested the technique experimentally and found that it gives accurate estimations, even in presence of strong ISI, or highly nonlinear effects. Although tested at 10 Gbit/s the technique is independent on the bit rate, and can be easily extended to work with other modulation formats and/or coherent receivers. It could can be used to enforce effective performance monitoring in real systems, with limited hardware complexity.
References
[1] C. Kilper, R. Bach, D. J. Blumenthal, D. Einstein, T. Landolsi, L. Ostar, M. Preiss, andA. E. Willner, “Optical Performance Monitoring“, JLT, 27, 22, 1 (2004)
[2] N. Bergano. F.W. Kerfoot , C.R. Davidson, “Margin measurements in Optical Amplifier Systems”, IEEE Photonics Technol. Lett., March 1993, 5, (3)
[3] D. Marcuse, “Derivation of analytical expression for the Bit Error Probability in Lightwave Systems with Optical Amplifiers”, J. Lightwave Technol., vol. 8, pp. 1816–1823, 1990
[4] P. A. Humblet and M. Azizoglu, “On the Bit Error Rate of Lightwave Systems with Optical Amplifiers”, J. Light. Technol., vol. 9, pp. 1576–1582, 1991
[5] C .J Anderson, and L.A. Lyle, “Technique for evaluating system performance using Q in numerical simulations exhibiting intersymbol interference” Electronics Letters., 1994, 30, pp. 71-72
.
Tu.6.A.7.pdf 3 7/27/2011 4:26:13 PM