Radiation survey in the International Space Station
Livio Narici
1,2,*, Marco Casolino
2, Luca Di Fino
1,2, Marianna Larosa
1,2, Piergiorgio Picozza
1,2,
and Veronica Zaconte
1,21 Department of Physics University of Rome Tor Vergata, 00133 Rome, Italy 2 INFN Tor Vergata, 00133 Rome, Italy
*Corresponding author: [email protected] Received 8 May 2015 / Accepted 8 November 2015
ABSTRACT
The project ALTEA-shield/survey is part of an European Space Agency (ESA) – ILSRA (International Life Science Research Announcement) program and provides a detailed study of the International Space Station (ISS) (USLab and partly Columbus) radiation environment. The experiment spans over 2 years, from September 20, 2010 to September 30, 2012, for a total of about 1.5 years of effective measurements. The ALTEA detector system measures all heavy ions above helium and, to a limited extent, hydrogen and helium (respectively, in 25 Mev–45 MeV and 25 MeV/n–250 MeV/n energy windows) while tracking every indi-vidual particle. It measures independently the radiation along the three ISS coordinate axes. The data presented consist of flux, dose, and dose equivalent over the time of investigation, at the different surveyed locations. Data are selected from the different geographic regions (low and high latitudes and South Atlantic Anomaly, SAA). Even with a limited acceptance window for the proton contribution, the flux/dose/dose equivalent results as well as the radiation spectra provide information on how the radiation risks change in the different surveyed sites. The large changes in radiation environment found among the measured sites, due to the different shield/mass distribution, require a detailed Computer-Aided Design (CAD) model to be used together with these measurements for the validation of radiation models in space habitats. Altitude also affects measured radiation, especially in the SAA. In the period of measurements, the altitude (averaged over each minute) ranged from 339 km to 447 km. Measurements show the significant shielding effect of the ISS truss, responsible for a consistent amount of reduction in dose equivalent (and so in radiation quality). Measured Galactic Cosmic Ray (GCR) dose rates at high latitude range from 0.354 ± 0.002 nGy/s to 0.770 ± 0.006 nGy/s while dose equivalent from 1.21 ± 0.04 nSv/s to 6.05 ± 0.09 nSv/s. The radiation variation over the SAA is studied. Even with the reduced proton sensitivity, the high day-by-day variability, as well as the strong altitude dependence is clearly observed. The ability of filtering out this contribution from the data is presented as a tool to construct a radiation data set well mimicking deep space radiation, useful for model validations and improvements.
Key words. ISS – Radiation risk – Radiation models – Human space exploration – Radiation environment – ALTEA – Active silicon detectors
1. Introduction
Radiation is an important issue in human space exploration (Durante & Cucinotta 2011). Radiation on Earth is mostly shielded by the atmosphere and Earth’s magnetic field. At the International Space Station (ISS) altitude (about 400 km) the atmosphere is extremely rarefied and the deflective power of the magnetic field during high latitude passes is limited. During human deep space exploration (return to the Moon, Mars, and beyond), the astronauts will be exposed to the Galactic Cosmic Rays (GCRs) and to the radiation associated with transient solar events (SPEs, Solar Particle Events). Radi-ation damage to living cells/tissues/organs is demonstrated in the literature not only for the high doses/dose rates typical of nuclear bombing (Hiroshima and Nagasaki) or, in a more lim-ited extent, to accidents in nuclear power plants, but also in the case of long exposures at much lower radiation rates such as those experienced in space from GCR. The assessment of radi-ation risk – in terms of acute sickness probability as well as long-term increase of death probability or other radiation-related health risks – relies heavily on the understanding of the interactions between radiation and living matter, which is
a major issue in radiobiology research. Many of the most recent results (see, for example,Cucinotta et al. 2013;Mirsch et al. 2015; Parihar et al. 2015) suggest that radiation risks1
should not simply be related to the absorbed dose (energy per unit of mass) due to the impinging radiation, but that a detailed characterization of the radiation that might go beyond the use of dose equivalent or effective dose is needed to pro-duce a reliable estimate. Therefore, for a correct risk assess-ment the impinging radiation should be known with more details: the rate, the distribution in space, the energy released by each ion, or, better, the charge of the ion (Z value) and its kinetic energy Ek(Cucinotta et al. 2013).
Mission planning would require the exhaustive knowledge of radiation at sites where there are no measurements and sometimes not even the possibility of measuring in advance (in deep space, on a planet/satellite surface, in a deep space
1 Risks originate from many causes, for example cancer effects, non-cancer effects (such as central nervous system (CNS), cardio-vascular, digestive, and respiratory), bystander effects, etc. (see, for example, http://www.theseus-eu.org/fileadmin/Docs/Eg_reports_ roadmap/Cluster3_web.pdf).
DOI:10.1051/swsc/2015037
! L. Narici et al., Published byEDP Sciences2015
O
PENA
CCESST
ECHNICALA
RTICLEhabitat). Consequently, models2 are required and are being
developed to provide this needed information. These models must be validated against all possible pertinent data to ensure that we have the ability to describe radiation in a sufficiently reliable way for any interesting site in space.
The ISS is currently the best available test site to be used for these validation purposes (Wilson et al. 2006).
The radiation environment in the ISS is different from what is measured and expected in deep space. The most relevant dif-ference is the presence of radiation trapped in the Van Allen belts during the passes through the South Atlantic Anomaly (SAA), which is mostly composed of low energy protons. Trapped particles in the SAA make a large contribution to dose (about two third according toSemkova et al. 2014) and signif-icantly modify the overall radiation spectrum. At low latitudes only highly energetic ions can reach the ISS orbit due to the high geomagnetic cut-off rigidity. This effect is minimized at high latitudes.
The ability of active detectors3 to provide time-resolved
data permits the separation of the different regions (high lati-tude: low magnetic shield; equatorial regions: high magnetic shield; SAA: mostly low energy protons). This separation allows for each environment to be studied independently and contributes to the claim that the ISS environment provides the best available proxy for a space habitat exposed to deep space radiation, with respect to spectra, charge mixture, spatial distribution, and rate.
Radiation measurements within the ISS are needed for the following: (i) to monitor the environment where the astronauts live and (ii) to validate models for the radiation environment within space habitats. In the first case, whole orbit measure-ments are needed, aimed at studying all the components of the radiation environment in the ISS during its orbits. In this paper we focus mainly on the second objective and therefore we study mostly the high latitude data. Some whole orbit data are also presented, to address the first case and to provide results that can be compared with those of the passive dosimeters, which inherently provide integrated mission measurements.
Many radiation measurements have been conducted in the recent past on the ISS using both passive and active detectors (see, for example, Reitz et al. 2005; Casolino et al. 2006;
Dachev et al. 2006, 2011, 2015; Zhou et al. 2008, 2010;
Nagamatsu et al. 2013;Larsson et al. 2014). Only a few papers have shown data from the period under study here and have been published recently (Lishnevskii et al. 2012;Semkova et al. 2013,
2014;Berger et al. 2015;Smith et al. 2015;Dachev et al. 2015). The ALTEA system (Narici 2008;Zaconte et al. 2008) is a set of detectors able to measure, in real time, the energy deposited (in silicon) by ions and the direction of each incom-ing particle. Under certain conditions ALTEA can estimate the charge (Z) and kinetic energy of each ion (for details
seeDi Fino et al. 2012). The ALTEA system features separate detectors which are oriented along the ISS X, Y, and Z coor-dinate axes, therefore, it is able to measure radiation indepen-dently along the three directions. This provides important insights into the influence of shielding on the external radia-tion environment allowing for better model validaradia-tion.
In this paper we will focus on the survey performed during the time of the ALTEA-shield project sponsored by ESA and carried out between 20 September 2010 and 7 July 2012. Mea-surements were made at four different sites within the USLab with a total of about 1 year and 3 months of data acquisition time. Following the ALTEA-survey part of the experiment, the ALTEA hardware was used to extend the monitoring for another 4 months (through 30 September 2012) in the Colum-bus module.
The primary purposes of the measurements presented here are to provide detailed radiation data for model validations and to study the radiation environment where astronauts are living for a prolonged amount of time.
2. Instrument and methods
2.1. The ALTEA-shield/survey project
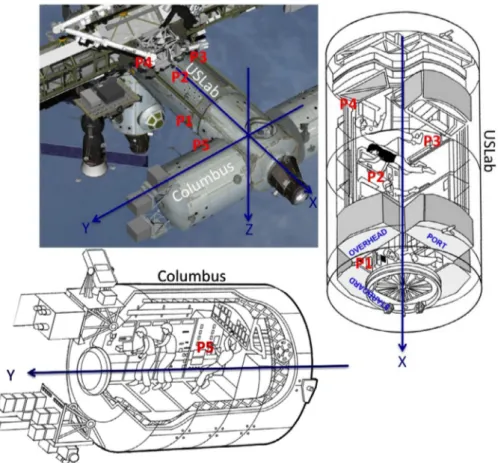
The ALTEA-shield/survey project is part of a European Space Agency (ESA) effort to use the ALTEA detector sys-tem, already on board the ISS (Narici et al. 2004; Narici 2008;Zaconte et al. 2010a), to (i) perform a radiation study in several sites of the USLab and (ii) investigate the effec-tiveness of the shielding characteristics of Kevlar compared to those of polyethylene. The survey section (i) of the pro-ject is the topic of this paper. ALTEA-shield/survey mea-surements have been carried out from September 20, 2010 to June 7, 2012. Table 1 shows times and positions of each segment of the project. Figure 1 presents a sche-matic of the measured positions. For the first four sites (sur-vey of the USLab) the ALTEA system (six Silicon Detector Units, SDUs) was deployed using two SDUs stacked in each of the three ISS axes as shown inFigure 2(this will be referred to as the ‘‘XYZ configuration’’). The fifth posi-tion was measured by a single SDU in the Z direcposi-tion inserted in Express Rack 3 in Columbus.
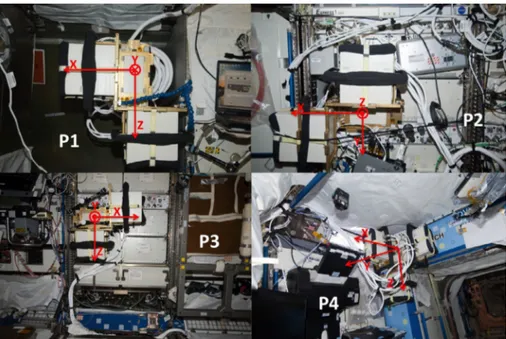
The first position (P1) is different from the others since it used the space left by a temporarily missing rack. The Y-direc-ted SDUs have therefore been inserY-direc-ted into such space so that they were looking only at the outer hull of the USLab (see
2A combination of radiation source models, radiation transport to follow the radiation while passing through matter, and Computer-Aided Design (CAD) models to describe the structure of the habitat. 3Active detectors are powered and can record and display continuously time-resolved information, in some cases discriminat-ing the nuclear specie of each impdiscriminat-ingdiscriminat-ing ion, its trajectory, energy released in the detector, input energy, charge. Passive detectors are unpowered (most often plastic) and accumulate signal over the entire course of their exposure so they provide integrated data over time, radiation species, and energies.
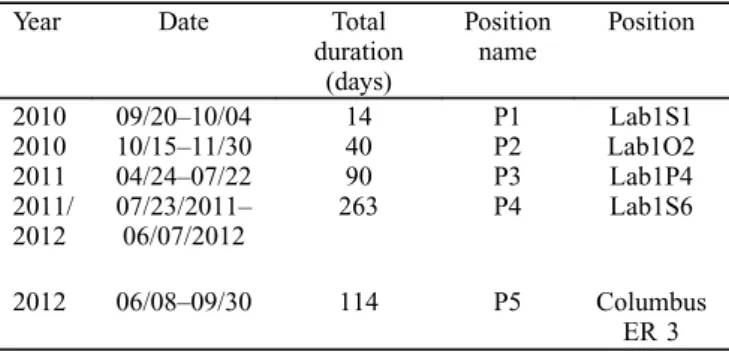
Table 1. Running days in the four ALTEA-shield/survey positions. The last line corresponds to the ‘‘shield’’ section of the experiment. The total duration might be less than the total number of days between start and end because of shut-off periods.
Year Date Total
duration (days) Position name Position 2010 09/20–10/04 14 P1 Lab1S1 2010 10/15–11/30 40 P2 Lab1O2 2011 04/24–07/22 90 P3 Lab1P4 2011/ 2012 07/23/2011–06/07/2012 263 P4 Lab1S6 2012 06/08–09/30 114 P5 Columbus ER 3 J. Space Weather Space Clim.,5, A37 (2015)
Fig. 3top left). In positions 2 and 3, respectively, the Z-directed SDUs and the Y-directed SDUs were inserted in an empty drawer in a rack (see Fig. 3 bottom left and top right). The fourth position (Fig. 3 bottom right) was instead external to the racks on the USLab overhead.
The rare situation relative to position 1 (missing rack) pro-vided measurements for an easier and more reliable use with simple models (seeNarici et al. 2012) because only a known amount of material (the ISS-USLab hull) was interposed between the detector and the outside space.
Fig. 1. The four measurement sites (P1–P4) in the USLab and the fifth one (P5) in Columbus. The three ISS orthogonal directions are also shown (see, for example,Di Fino et al. 2011).
2.2. The detector system
The ALTEA cosmic ray detector system was launched in the ISS in 2006. It is composed of six Silicon Detector Units (SDUs) that, during the Survey measurements, are assembled in a XYZ configuration (seeFig. 2). It is capable of determin-ing, in real time, energy loss and trajectory of the cosmic ray ions. The trigger and nature of the detector does not however allow discrimination between forward and backward moving particles.
The ISS orbital information provided by NASA also per-mits to study the radiation environment discriminating the dif-ferent geomagnetic zones (high latitude, low latitude, equator, and SAA) (Zaconte et al. 2008,2010a,2010b).
Each SDU consists of three pairs of silicon planes with each one composed of two silicon detectors segmented into 32 strips with 2.5 mm pitch. Strip segmentation on each plane is alternatively oriented along orthogonal directions in order to use the position of the hit strips in each pair and the height of the pair into the detector as the three coordinates in space. Indi-vidual ion trajectories in each detector can therefore be mea-sured. Each silicon plane (two silicon detectors) has a size of 16 cm· 8 cm and a thickness of 380 lm. The inter-planar space between a pair of silicon planes is 3.75 mm, while the distance between two pairs is 37.5 mm. The structure results in a double-ended geometrical factor of 230 cm2sr per single
SDU (Sullivan 1971, also calculated with a Monte Carlo sim-ulation based on a ‘‘Particle and Heavy Ion Transport code System’’, PHITS model4). The Linear Energy Transfer (LET,
in silicon) range of the detector goes from a threshold of about 3 keV/lm up to about 700 keV/lm. Under certain conditions the charge of each impinging particle can be estimated (Di Fino et al. 2012).
The detector is triggered by pass-through particles that deposit more energy than the set threshold on all the odd
planes of an SDU. Therefore, each SDU is able to measure protons with energy in the range of about 25 MeV–45 MeV, He ions from about 25 MeV/n–250 MeV/n, and all other penetrating particles up to relativistic molybdenum. Further details are reported inZaconte et al. (2008). The data trans-fer from the ISS to the ground is described inDi Fino et al. (2006).
2.3. Data selection
First, the raw data underwent a subtraction of the pedestal (off-set with no input) of the electronics of silicon detectors in order to assess each silicon detector baseline. Information for pedes-tal subtraction is provided periodically throughout the mea-surements to take into account possible drifts during operation. Second, only events that contain a single particle track have been selected.
A vertical incidence normalization of the energy lost in the silicon planes (DE) has also been performed using the formula: !En¼ !E cos hin; ð1Þ
where hinis the angle between the direction of the incident
particle and the normal to the silicon surface. The ratio of the normalized energy DEn to the silicon thickness is the
LET in silicon of the particle. This normalization is made possible by the tracking feature of each SDU (see above).
2.4. Orientation
Measurements of ALTEA are made coincident with the three orthogonal axes (X, Y, and Z) relative to the ISS (Fig. 1): X is along the main modules, in the forward direction (along the ISS orbit which has an inclination with respect to the equa-tor of 51.6"), which is the axis of the USLab and Russian mod-ules; Y is therefore orthogonal to the orbit, along the truss as well as along the Columbus and JEM axes, and Z is directed toward the Earth.
Fig. 3. ALTEA in the four USLab positions (seeTable 1). Top left: Position P1 (in this site the rack was temporarily missing and the Y-directed detectors were facing the USLab hull); Top right: P2 on the overhead with the Z-directed detectors inserted in an empty drawer; Bottom left: P3 on the port side with the Y-directed detectors inserted in an empty drawer; Bottom right: P4 on the overhead. X, Y, Z: ISS coordinate system. Photo courtesy of NASA.
4http://phits.jaea.go.jp
2.5. Analysis
Each ALTEA SDU directly measures the energy deposited in each of the six silicon planes by the impinging particle and determines the strip being hit. For the following analy-sis we use the average deposited energy over the six planes by each particle. We analyzed the data to obtain flux, dose rate, and dose equivalent rate. Flux is the counting rate per area and steradian, irrespectively of the kind of ion, the dose rate (energy per unit of mass and time) is proportional to the Linear Energy Transfer (LET) which depends on the specific ion (when traveling with the same energy per nucleon, high Z ions transfer more energy than low Z ions). Finally we calculate the dose equivalent rate of each ion which is a quantity most important in human exploration because it is the dose rate corrected by a weight which describes the ‘‘quality’’ of the radiation: the ability of radi-ation to cause damage on living matter. This weight (quality factor) is also a function of the LET.
In most instances we selected data acquired while orbiting over a specific region: high latitude (hereafter HL), low latitude (LL), or over the South Atlantic Anomaly (SAA). The selection criteria rely on the magnetic coordinates L and B (McIlwain 1961), which are calculated from the downlinked state vector (HL: L > 3; LL: L < 1.5 & B > 0.27; SAA: L < 2.4 & B $ 0.27).
We first convert the deposited energy in silicon (LET in sil-icon) to LET in water by the relation (Benton et al. 2010):
Log LETð H2OÞ ¼ %0:2902 þ 1:025 Log LETð SiÞ: ð2Þ The LET of each particle k is:
LETkð Þ ¼Si !E n k
h ; ð3Þ
where DEknis the normalized energy (see Eq.(1)) relative to
the kth particle and h the thickness of the silicon planes in the detectors.
The dose rate is:
Dose rate ¼hq4p H2OGF 1 !t XN k%1 !Ek; ð4Þ
where GF is the geometrical factor, qH2Ois the water density, the sum is over all the N particles measured in the time Dt, and DEkis the measured deposited energy by each particle.
The geometrical factor GF (calculated as described above) contains all the information about the geometry of the detec-tor. Here it is used to estimate the radiation flux, from the ALTEA telescope measurements and assuming isotropy. The 4p coefficient comes from the integration over the full solid angle. In a few situations, such as while passing through the SAA, where the incident radiation is highly anisotropic, this assumption is poor, however this issue is mitigated by the directional (telescopic) feature of the ALTEA SDUs: measurements correspond to a single direction. The Earth’s shadow will be briefly considered inSection 4.
To compute the dose equivalent rate we use the criteria in (ICRP 1991) assigning different weights w to different LETs:
LET < 10 keV=lm w ¼ 1
10 keV=lm < LET < 100 keV=lm w ¼ 0:32 LET % 2:2 LET > 100 keV=lm w ¼ 300=LET1=2
: ð5Þ
Flux and dose rates are averaged within each minute and within each day.
To compute the average flux, dose, or dose equivalent rates over a measured position, we start from the day-averaged quantities and produce the mean and the relative stan-dard error.
Quality factor (Q) values are calculated as the ratio between the dose equivalent rates and the dose rates.
When in the XYZ configuration (first four positions) the flux/dose rates/dose equivalent rates measured by the two SDUs pointed in the same direction have been averaged to improve the signal-to-noise ratio.
3. Results
The USLab and Columbus survey has been performed moving the detector system as mentioned above (seeTable 1,Figs. 1
and 3) in four sites in the USLab, having taken care to place the three directions of ALTEA parallel to the three ISS axes (X, Y, and Z,Fig. 3). The fifth position was in Columbus, with a single detector (SDU2) pointing in the Z direction.
The same data analysis has been performed for each posi-tion in order to have a full picture of the 3D radiaposi-tion environment.
First a simple application of the data selection procedure, to illustrate how to select out the SAA contribution, will be shown (Fig. 4).
A complete view of the flux measured over the entire period will be presented (Fig. 5) to show the difference between whole orbit measurements (relevant for comparing with passive devices and to monitor the doses to the astronauts) and high latitude measurements (relevant for model validations).
Dose rates and dose equivalent rates as well as spectra will be presented for high latitude (Figs. 6–11), with two excep-tions: a spectrum relative to low latitude (with the SAA still selected out,Fig. 12), to show the filtering effects of the mag-netosphere, and dose data relative only to the SAA (Fig. 13) to document the variability of this component.
3.1. Selecting out the SAA
The selection procedure that we followed for most of the pre-sented results is illustrated inFigure 4. The top panel of the fig-ure shows the flux measfig-ured from one single detector (SDU2, Z direction) in a typical quiet solar period over a few days, averaged every minute. The latitudinal oscillations as well as the longitudinal precession (due to the non-coincidence of geo-graphic and magnetic axes) are clearly visible in the data, as well as the passes through the SAA which are quite prominent. Note the passes over the equator (with fluxes close to zero) where only the very energetic particles can penetrate the Earth’s magnetic field, compared to the higher fluxes measured at higher latitudes where the magnetic shield is weaker. Due to the different distances between geographic and magnetic poles in the two hemispheres it is also notable that passes at high lat-itude alternate between a higher maximum (South) and lower maximum (North).
The number of passes per day through the SAA is variable, and even more so the flux during the daily passes. The integra-tion over one day consequently produces a large variability in the daily flux or dose.
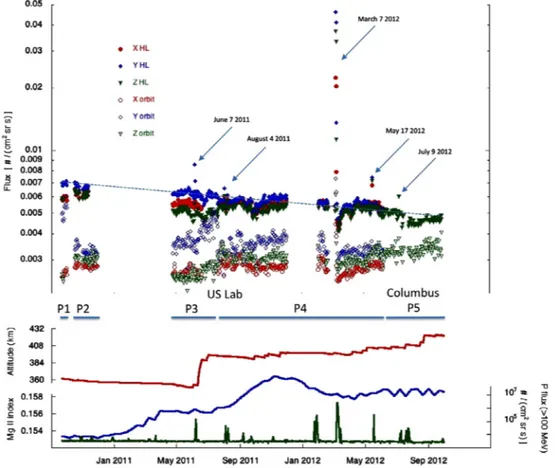
Fig. 5. Top: Flux measured by ALTEA in the three directions both in the whole orbit (empty symbols) and in the high latitude passes (HL, full symbols). The five most evident Solar Particle Events (SPEs) are indicated with an arrow. The dotted line serves as a guide for the eyes to follow the mean steady decrease of the flux linked to the solar cycle modulation. Bottom: Altitude of the ISS from the ancillary data acquired concurrently with the ALTEA measurements (above in red); solar cycle as described by the MgII index (middle, in blue); flux of the energetic (>100 MeV) protons, as measured by GOES (lowest, in green); The P1–P5 segments indicate the periods that the detector system ALTEA spent in the five different positions during the experiments ALTEA-shield/survey (P1–P4) and ALTEA-shield/shield (P5).
Fig. 4. Radiation flux measured by one SDU (SDU2, Z direction) in a quiet Solar Period (April 19–22, 2012). Top: complete data set. Bottom: Same data set, filtering out the passes through the SAA.
When filtering out the data acquired during SAA passes, using the magnetic coordinate, as mentioned in Section 2, the radiation dynamics becomes like the one shown in the bot-tom plot ofFigure 4.
3.2. Flux, dose, and dose equivalent
The overall panorama of the radiation environment for the entire investigation period (September 20, 2010 to September 30, 2012) is shown inFigure 5where the particle flux is plotted (top) and averaged each day for the three ISS directions (X: red, Y: blue, Z: green, seeFig. 1). The empty symbols represent
the flux averaged over one whole day. Fluxes averaged only over the passes at high latitude (HL) are also shown (full sym-bols). These are selected by the L coordinate (L > 3, see method).
At the bottom ofFigure 5we show three important refer-ence measurements. From above: the ISS mean altitude (acquired concurrently with the ALTEA data, ranging from '340 km to '420 km); the MgII index, descriptor of the solar cycle (Thuillier & Bruinsma 2001), the proton flux (E > 100 MeV) as measured by GOES.5
The P1–P5 segments indicate the five different measure-ment position periods.
Note that the last part of the ALTEA results (P5, from June 7, 2012) comes, as mentioned, from the second section of the project (ALTEA-shield/shield, Di Fino et al. 2014b). In this case the data is from a single SDU (SDU2), in the Z direction, positioned in the Columbus module in a double drawer in rack 3 and used in that experiment as baseline (without any further shielding). For this reason it is reasonable to use these data to time-extend the survey portion of the project.
FromFigure 5(flux at high latitude, low magnetic shield-ing) the contributions to the measured flux of five Solar Parti-cle Events (SPEs6) to the radiation pattern (daily values clearly
above the level of nearby days) are indicated with arrows (June 7, 2011, August 4, 2011, March 7, 2012, May 17, 2012, July 9, 2012).
Finally the mean steady decrease of the flux linked to the solar cycle modulation (dotted line inFig. 5) cannot be distin-guished in the whole orbit data due to the effect of the SAA contribution which is in turn heavily modulated by altitude and shielding as we will better appreciate later.
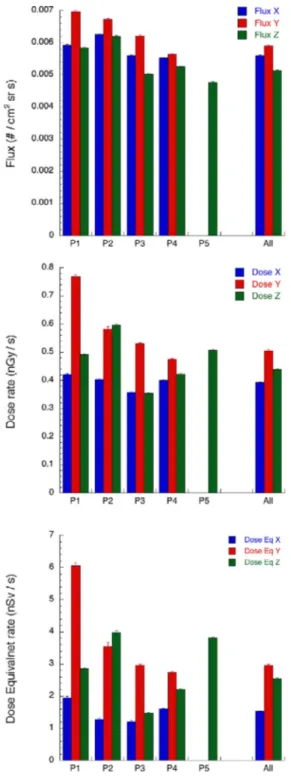
The results in the five different sites are first summarized in
Figure 6, where the flux, dose rates, and dose equivalent rates are averaged over time for each of the positions, showing the variability in the three directions. As mentioned inSection 2
the acceptance window of the detector system provides a reduced sensitivity to H and He. Because the dose depends on LET (lower for low Z ions) and dose equivalent depends on LET also through the weighting factor w (higher for high LET), the limited sensitivity has a larger effect on flux than on dose and dose equivalent.
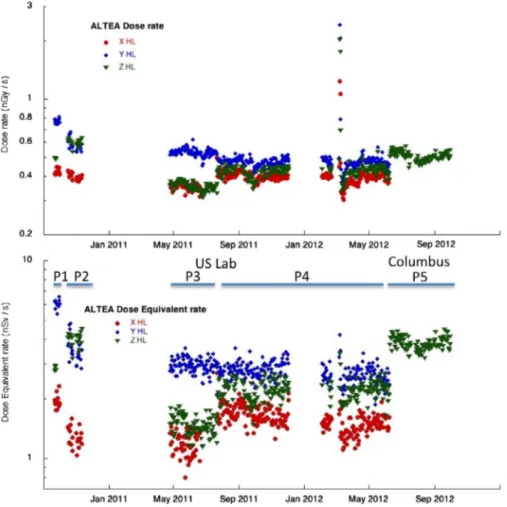
In Figure 7 we show the day-averaged time behavior of dose and dose equivalent rates (as a complement to the flux shown inFig. 5). Data are integrated over one day, at high lat-itude (HL), over the whole period of the ALTEA-shield experiment.
For comparison with other results, the measurements over the whole orbits, averaged for all directions and positions, lead to: dose rate = 39.7 ± 0.2 lGy/day; dose equivalent rate = 226 ± 3 lSv/day.
Figure 8presents the day-averaged time behavior over the whole measurement period of the quality factor (Q) (ratio between dose equivalent and dose) in the three directions.
3.3. Spectra
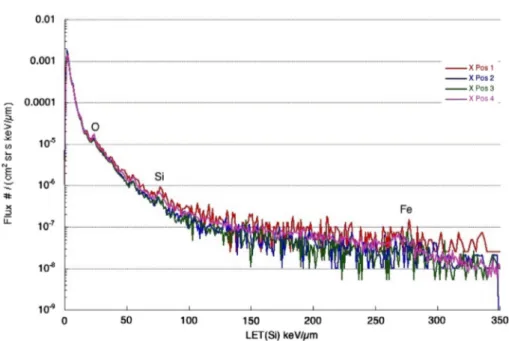
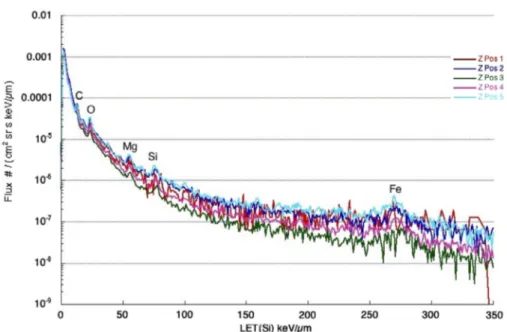
Finally we show the LET spectra measured at high latitude (HL) in the three directions, for the five different sites (Figs. 9–
11). Each spectrum is calculated over the entire period of per-formance of the detector system in each site.
Fig. 6. Flux, dose, and dose equivalent rates averaged over each site, and distinct for each direction. Measurements are during high latitude passes.
5 http://www.ngdc.noaa.gov/stp/satellite/goes/dataaccess.html 6 http://umbra.nascom.nasa.gov/SEP/
Note in the above plots the lower values of the spectra in the X direction for LET ( 50 keV/lm. The integrated flux lar-ger in the X direction than in the Z direction apparent in
Figure 6can be barely appreciated here in the small difference in the lowest LET peak (<10 keV/lm), which has, due to the logarithmic scale, a much larger effect than the integrated flux difference over all the other LETs.
The last spectrum (Fig. 12) shows the data for the low lat-itude (LL) region when the detector system was in the fourth position.
3.4. The contribution of the SAA to the day measurements
Passive dosimeters, widely used in the ISS, measure radiation quantities averaged over the whole orbit. This average is also proportional to the dose received by the astronauts. It is of interest, therefore, to study the difference between whole orbit flux (Fig. 5, top panel, empty symbols) and HL flux (Fig. 5, top panel, full symbols). The former has a wider spread than the latter due to the mentioned variable daily contribution in the South Atlantic Anomaly, which is included in the whole orbit
Fig. 7. Dose (top) and dose equivalent (bottom) measured over the entire period (high latitude, HL) by the ALTEA detector. Periods corresponding to the different sites are marked.
Fig. 8. Quality factor Q averaged over each day, for the entire measurement period (high latitude passes). J. Space Weather Space Clim.,5, A37 (2015)
average but not in the HL one, and mostly affects the least shielded direction (Y).
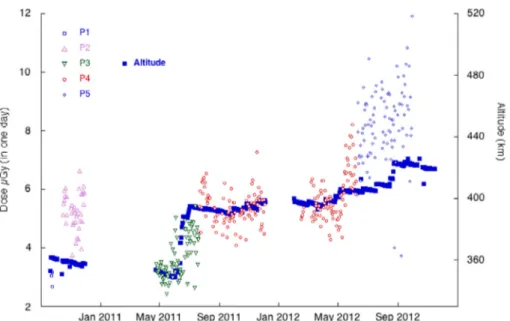
We calculate from the minute-averaged measurements the dose measured only in the SAA each day for the ‘‘Z’’direction, during the investigated period.
The result of this calculation is shown inFigure 13, where the measurements in the five different positions are presented with different symbols. Superimposed is the altitude of the ISS (right axis).
From the figure, the variability of the flux in the SAA per day is appreciable. Note the large mean altitude changes in the middle of 2011 that brought the ISS up about 40 km (from '355 km to '395 km) followed by smaller and more gradual changes starting in May 2012 (from '395 km to '409 km) and the one starting in the second half of August 2012 (from '410 km to '420 km).
4. Discussion
The major objective of this paper is to provide data to use in conjunction with detailed CAD simulations for a full validation of radiation environment models. For this reason most of the discussion will be on the high latitude data, which, as men-tioned, best mimics the deep space radiation in a space habitat. In order to compare these results with those of other works some whole orbit data will also be discussed.
Radiation in the ISS is due to two major ‘‘external’’sources (GCR, SPE), one ‘‘local’’ source (trapped radiation in SAA, mostly low energy protons) and, finally, the ‘‘internal’’ (to the ISS) source due to fragmentation. During the orbit these sources are time modulated. The time modulation of the GCR can be appreciated inFigure 4and it is due to the Earth’s magnetic shield. The ‘‘local’’ contribution (SAA) is readily selected, due to the specific coordinates at which it appears,
Fig. 9. LET (Si) spectra (HL) in the X direction for the four detector positions.
and therefore can be removed if needed. However, the ‘‘exter-nal/local’’ contribution cannot be distinguished from the ‘‘internal’’ one (without using models) because they follow the same time modulation. Results labeled ‘‘GCR’’, ‘‘SPE’’, or ‘‘SAA’’ correspond, therefore, to the radiation environment inside the ISS due to the GCR component (or SPE, or SAA), transported inside the vessel, which includes the ‘‘internal’’ contribution (fragmentation).
The high variability of the daily averaged radiation values across positions (P1–P5) and directions (X, Y, Z) is due to sev-eral causes. Shielding variation in the field of view of the detectors is most likely the major reason for this variability. Other concurring factors may be: (i) the changes in altitude, which modulates the effect of the magnetosphere and it is most important for the SAA passes, which is not an issue for HL data, (ii) the solar cycle, that during the measurement period
was slowly proceeding toward the maximum (very shallow) causing a slow decrease of the GCR component, and (iii) the attitude of the ISS, that would have had an influence, but that during the measurement period was mostly constant with the X axis parallel to the ISS velocity vector (XVV).7
Also the Earth’s shadow reduces the number of particles measured by ALTEA and influences mostly the Z direction by a factor '½, however this is already taken into account
Fig. 12. LET (Si) spectra measured at low latitude (LL) in the three direction for the fourth detector position (P4). Fig. 11. LET (Si) spectra (HL) in the Z direction for the five detector positions (including the last site in Columbus).
7Brief changes in attitude have occurred during the two Shuttle dockings during the measurements: STS 134 (May 18, 2011 to May 29, 2011) and STS 135 (July 10, 2011 to July 19, 2011). During these dockings ALTEA was in P3 and no significant ‘‘Shuttle shadow’’ effect was measured. These effects have been reported in the past (Dachev et al. 2012). The Shuttle mass adds to the X shielding, so a possible reason for not seeing changes in radiation is the large amount of shielding already present in that direction. J. Space Weather Space Clim.,5, A37 (2015)
by our procedure. In Eq.(4)the counting rate was divided by a double-ended GF to estimate the best isotropic source giving rise to our measurements, and then it was integrated over the full solid angle 4p to get the dose. In this manner we estimated the contribution of all particles, regardless of their forward or backward velocity and possible shielding.8If we were to
con-sider the Earth shielding explicitly from the beginning, the result would not change: for the Z-directed telescopes we would have used a single-ended GF (which is half of the dou-ble ended), assuming all particles were coming from above, and then integrate only over 2p, producing the same result.
We should underline that the possibility of discriminating radiation in the three directions (X, Y, Z) provided by ALTEA is useful when using these data for model validation (each direction would correspond to a specific amount of shielding), but probably not needed for radiation monitoring purposes, as an astronaut body is not sensitive to these differences. Also when planning radiobiology experiments in space the 3D find-ings would have importance only in the unlikely case of a radi-ation interaction showing directionality preferences.
4.1. Effects of shielding
Shielding produces modification of the quality of radiation. Slow ions may be stopped in the shield, while more energetic larger Z ions tend to be fragmented into lighter ions that will deposit lower energy (lower LET). These will provide lower dose and even lower dose equivalent (that depends on the LET through the weighting factor (Eq. (5)), but will also increase the flux, with the fragmented lighter ions. This is noticeable by observing the larger differences in dose rates and dose equivalent rates when changing detector position and across directions (La Tessa et al. 2009;Narici et al. 2012). To interpret the radiation behavior during detector position changes, or across different directions, we observe that for each position there are two contributions to the shielding: the parts of the ISS, ‘‘external’’ to the modulus where the measurement
takes place, and the ‘‘internal’’ contribution by racks and experimental apparatuses.
‘‘External’’ shielding are the other modules, and the truss. The other modules (and the nodes) strongly increase the shield-ing in the X direction when measurshield-ing in the USLab (X is look-ing through several modules and nodes), the truss is increaslook-ing the shielding in positions 3 and 4, direction Z (looking straight toward the truss), and, to a lesser extent, in direction Y (looking obliquely to the truss). The dose equivalent rate in all USLab positions is indeed much lower for the X direction, by as much as a factor of 3, confirming previous measurements (Di Fino et al. 2011;Larsson et al. 2015).
‘‘Internal’’ shielding is due to the presence of all racks and experiments. In this case it is important to consider the exact location of the detector system (seeFigs. 1and3). In position 4 all three directions are similarly positioned externally to the racks (Fig. 3bottom right). In the other three USLab sites one telescope pair (one direction) is inserted in an empty drawer (or in a missing rack, for position 1) and the other two pairs are flush on racks. When inserted in a drawer the shielding is reduced with respect to the one in position 4 (due to the empty drawer), even more so if inserted where a rack is missing (in this case the telescope is facing only the hull of the module). When the telescopes are flush to the racks the shielding is higher, because part of the field of view of the telescopes looks inside the racks. In the case of position 1 this effect is reduced as the closest rack is missing.
Combining all the above effects it is possible to interpret the radiation changes when moving the detector system from site to site.
Figure 6shows a comprehensive view of the HL radiation levels. The results are time averaged over the same position and shown independently for each direction, providing impor-tant inputs for model validations. The X direction featuring the highest shielding, similar in the four USLab sites, provides the least differences in dose and dose equivalent rates in the four measured sites. The Y radiation values appear similar in posi-tions P2, P3, and P4. In these measurements the detectors were looking transversely to the module and racks, and the total amount of shielding was comparable. Measurements in P1,
Fig. 13. Dose in one day measured in the ‘‘Z’’direction during the entire measurement period, over the five different sites. The mean altitude of the ISS is also reported (right axis).
8As mentioned ALTEA trigger does not permit this discrimination in any case.
which correspond to the mentioned missing rack, show values higher than in the other positions. Finally, the Z radiation val-ues show the largest differences across the five measured sites, and this is due to the position relative to the truss and to deployment of the detectors, either flush to the rack or facing the center part of the USLab.
The dose rates to an astronaut (within the ALTEA accep-tance) would be described by the average of the levels shown inFigure 6across directions for each position.
This description of the radiation environment variations (from one detector position to the next) linked to the shielding distribution is qualitative. A quantification of the shielding influ-ence on the radiation environment needs a detailed CAD model that will have to be used in conjunction with these data (and with all the similar data that will become available) for a com-plete and detailed validation of space habitat radiation models. Habitats for deep space exploration (vessels as well as bases) will feature a similar degree of complexity that we observed in the ISS, therefore models should be able to man-age this complexity. The ISS appears to be a good test-bed for this endeavor. One of the important issues to face would be the definition of the degree of details a model (including CAD) must feature to properly describe these radiation differences to the precision needed for risk assessment.
4.2. Spectra
The high latitude spectra (Figs. 9–11) provide further confir-mation of what was mentioned above inFigure 6. The differ-ences across directions reflect the variability of the total shielding in the fields of view of the detector. In this case, how-ever, some of the features are augmented if observing the high LET part of the spectra (LET > 50 keV/lm), where the effect of the fragmentation due to the shielding is most evident. Note, for example, that the iron contribution (LET (Si) ' 270 keV/ lm) to the X spectra almost disappears due to the high shield-ing in that direction.
The ‘‘low latitude’’ P4 spectra provide a demonstration of the filtering ability of the Earth’s magnetic field. At those low latitudes (LL) the deflecting power of the magnetic shield requires high kinetic energy to reach the ISS orbit. Only very energetic ions can therefore pass through. Lower energy parti-cles, that would have deposited higher energy in the detector, are deflected and consequently the right side of each ion peak in the spectrum (higher deposited energy) becomes less popu-lated, increasing the resolution of the peaks. Note also the les-ser extent of the directional differences due to the higher energies of the ions.
This filter also makes the effect of the low kinetic energy (i.e., high released energy) tails of the H+ and He+2 peaks
(these peaks are not resolved in the ALTEA measures) more apparent. Due to the filter effect these tails are shorter and can be seen inFigure 12 as different slopes: (i) a very steep one up to 10–20 keV/lm (H+), (ii) a medium one, up to about 90 keV/lm (He2+), followed by (iii) a flat region (no hidden
tail under it). These can be just barely observed in the HL spec-tra, due to the longer tails.
4.3. South Atlantic Anomaly (SAA)
The radiation during the passes through the SAA is strongly variable as shown inFigure 13. The flux measured during these passes depends on altitude and, being mostly composed of low
energy protons, it is heavily influenced by the shielding. The larger amount of SAA flux measured at P5 (Columbus) is partly due to the altitude and partly due to the lower shielding in the ‘‘Z’’direction (as mentioned the USLab is to some extent Z-shielded by the truss, vice versa Columbus is out from its protective shadow).
In a previous work (Reitz et al. 2005), dose rates for GCRs and the SAA have been presented, as measured by the dosim-etry telescope (DOSTEL) detector. A very similar variability in dose rate is found for the SAA. The values reported here are apparently much lower, however in Reitz’s work dose rate is presented, while inFigure 13we provide the total dose (within ALTEA acceptance) in one day received by the astronaut for the contribution of the trapped radiation in the SAA. To retrieve a dose rate the rather limited time spent each day in the SAA by the ISS should be taken into account. The dose in one day should then be multiplied by a factor ' 5. Doing so the difference with the cited paper becomes a factor 2–3 and can be taken into account by the DOSTEL acceptance window (reaching one order of magnitude lower LET), by the different location of the detectors, and by the different per-iod in the solar cycle.
The large variability of the SAA dose measured by ALTEA confirms the need of caution when using data from passive dosimeters for model validation purposes.
4.4. Average whole orbit dose rates
In order to compare our results with several other previous works, we also provided integrated, whole orbit values. These are significantly lower than what was found by other groups. As an example, in dose ALTEA measures only about 20% of the values reported bySemkova et al. (2014)(silicon detec-tor Liulin). This is mostly due to the reduced proton sensitivity and the large contribution of the SAA (about two third of the total dose according toSemkova et al. 2014). An interesting comparison is with data from CR39, a passive detector with sensitivity only above 10 keV/lm, so with almost no proton sensitivity. In this case (see, for example, Nagamatsu et al. 2013, measurements in the ELM-PS Kibo module, just a few months before the ALTEA ones) the dose measured by ALTEA is slightly larger than what was reported for the 2009–10 CR39 Kibo measurements. Dose equivalent in Kibo, however, is about 80% larger than what is reported by ALTEA. This could be accounted for by the different shielding (Kibo is less protected by the other modules and by the truss).
4.5. Solar Particle Events (SPEs)
Although outside the major aim of this paper, we wish to men-tion that once cleaned of the SAA contaminamen-tion, other events such as SPEs are evident in the dynamic of the radiation envi-ronment even though some of the ones observed were of small to moderate intensity. This is remarkable especially consider-ing ALTEA’s very limited sensitivity to protons. Five of these events are clearly visible inFigure 5(high latitude data) and the March 2012 SPE can also be seen in the dose and dose equivalent results (see also Larosa et al. 2011; Semkova et al. 2013,2014; Zeitlin et al. 2013;Berrilli et al. 2014;Di Fino et al. 2014a). Note also the lowest point in the quality fac-tor plot (Fig. 8, Q ' 1.7) during the March 2012 SPE, due to
the high concentration of protons that features low LET and therefore a dose equivalent rate value similar to the dose rate one (see Eq.(5)).
5. Conclusion
A 3D study of the radiation environment throughout the ISS-USLab and in one site in Columbus was carried out during 2010–2012 using the ALTEA detector system. The study was aimed at understanding the radiation environment in the ISS, providing inputs for a database useful for deep space model validations, and using the selection capability of the sys-tem that could extract data closely mimicking the deep space environment. This feature contributes to the claim that ISS is indeed the best available replica for radiation model validation for deep space habitats.
The radiation flux is shown to be roughly similar across the different positions, while the radiation quality, described by the dose equivalent and by the quality factor and most relevant for radiation risk assessment, features a larger variability, in some cases up to a factor ' 3 (almost '6 across positions and direc-tions). This is due to the higher contribution of the shielding distribution to these quantities.
The truss is confirmed to be an effective shield, while just staying close to a rack is shown to lower the quality of the radi-ation, therefore to decrease biological risk (these could be use-ful information for the best planning for sleep quarters).
The presence of the radiation from the SAA strongly mod-ifies the measured radiation pattern, with a large variability in time. Care must be taken when interpreting integrated results. Finally, the large radiation quality variability due to the complex shielding distribution requires a detailed CAD model to be joined to these data for a complete detailed validation of radiation models for space habitats that should be able to man-age this complexity. The ISS appears to be a good test-bed for this endeavor.
Acknowledgements. The authors acknowledge the support from ESA (programs ALTEA-shield and Dosis3D) from ASI, that made the development of the ALTEA detector possible (Contracts ALTEA, MoMa-ALTEA, and ALTEA-support). The authors would also like to thank Dr René Demets from ESA for his very valuable support during the ALTEA-shield project, and Dr Kerry T. Lee for having proofread the manuscript. Finally the authors are thankful to the ISS crew members who made all of this possible. The editor thanks two anonymous referees for their assistance in evaluating this paper.
References
Benton, E.R., E.V. Benton, and A.L. Frank. Conversion between different forms of LET. Radiat. Meas.,45 (8), 957, 2010, DOI:10.1016/j.radmeas.2010.05.008.
Berger, T., M. Hajek, P. Bilski, and G. Reitz. Cosmic radiation exposure of biological test systems during the EXPOSE-R mission. Int. J. Astrobiol.,14, 27–32, 2015,
DOI:10.1017/S1473550414000548.
Berrilli, F., M. Casolino, D. Del Moro, L. Di Fino, M. Larosa, et al. The relativistic solar particle event of May 17th, 2012 observed on board the International Space Station. J. Space Weather Space Clim.,4, A16, 2014, DOI:10.1051/swsc/2014014.
Casolino, M., V. Bidoli, M. Minori, L. Narici, M.P. De Pascale, et al. Relative nuclear abundances inside ISS with Sileye-3/Alteino experiment. Adv. Space Res.,37, 1686–1690, 2006.
Cucinotta, F.A., M.Y. Kim, and L.J. Chappel. Space Radiation Cancer Risk Projections and Uncertainties – 2012, NASA/TP-2013-217375, 2013.
Dachev, T., W. Atwell, E. Semones, B. Tomov, and B. Reddell. Observations of the SAA radiation distribution by Liulin-E094 instrument on ISS. Adv. Space Res.,37, 1672–1677, 2006, DOI:10.1016/j.asr.2006.01.001.
Dachev, T.P., J. Semkova, B. Tomov, Yu. Matviichuk, Pl. Dimitrov, et al. Space Shuttle drops down the SAA doses on ISS. Adv. Space Res.,47, 2030–2038, 2011,
DOI:10.1016/j.asr.2011.01.034.
Dachev, T., G. Horneck, D.P. Hä¨der, M. Schuster, P. Richter, M. Lebert, and R. Demets. Time profile of cosmic radiation exposure during the EXPOSE-E mission: the R3DE instrument. Astrobiology,12 (5), 403–411, 2012,
DOI:10.1089/ast.2011.0759.
Dachev, T.P., J.V. Semkova, B.T. Tomov, Yu.N. Matviichuk, P.G. Dimitrov, et al. Overview of the Liulin type instruments for space radiation measurement and their scientific results. Life Sciences in Space Res.,4, 92–114, 2015.
Di Fino, L., F. Belli, V. Bidoli, M. Casolino, L. Narici, et al. ALTEA data handling. Adv. Space Res.,37, 1710–1715, 2006,
DOI:10.1016/j.asr.2005.01.105.
Di Fino, L., V. Zaconte, M. Stangalini, R. Sparvoli, P. Picozza, et al. Solar particle event detected by ALTEA on board the Interna-tional Space Station. J. Space Weather Space Clim., 4, A19, 2014a, DOI:10.1051/swsc/2014015.
Di Fino, L., M. Larosa, V. Zaconte, M. Casolino, P. Picozza, and L. Narici. Measurements on radiation shielding efficacy of Polyethylene and Kevlar in the ISS (Columbus). J. Radiat. Res., 55, i64–i65, 2014b, DOI:10.1093/jrr/rrt198.
Di Fino, L., M. Casolino, C. De Santis, M. Larosa, C. La Tessa, L. Narici, P. Picozza, and V. Zaconte. Heavy ions anisotropy measured by ALTEA in the International Space Station. Radiat. Res.,176, 397, 2011, DOI:10.1667/RR2179.1.
Di Fino, L., V. Zaconte, A. Ciccotelli, M. Larosa, and L. Narici. Fast Probabilistic Particle Identification algorithm using silicon strip detectors. Adv. Space Res.,50, 408, 2012,
DOI:10.1016/j.asr.2012.04.015.
Durante, M., and F.A. Cucinotta. Physical basis of radiation protection in space travel. Rev. Mod. Phys., 83, 1245, 2011, DOI:10.1103/RevModPhys.83.1245.
ICRP. 1990 Recommendations of the International Commission on Radiological Protection. ICRP Publication 60, Ann. ICRP,21 (1–3), 1–201, 1991.
La Tessa, C., L. Di Fino, M. Larosa, L. Narici, P. Picozza, and V. Zaconte. Estimate of the space station thickness at a USLab site using ALTEA measurements and fragmentation cross sections. Nucl. Instrum. Methods B, 267, 3383–3387, 2009, DOI:10.1016/j.nimb.2009.06.107.
Larosa, M., F. Agostini, M. Casolino, C. De Santis, L. Di Fino, et al. Ion rates in the International Space Station during the December 2006 Solar Particle Event. J. Phys. G: Nucl. Phys.,38, 095102, 2011, DOI:10.1088/0954-3899/38/9/095102.
Larsson, O., V.V. Benghin, M. Casolino, I.V. Chernikch, L. Di Fino, et al. Relative nuclear abundances from C to Fe and integrated flux inside the Russian part of the ISS with the Sileye3/Alteino experiment. J. Phys. G,41, 015202, 2014,
DOI:10.1088/0954-3899/41/1/015202.
Larsson, O, V.V. Benghin, T. Berger, M. Casolino, L. Di Fino, et al., Measurements of heavy-ion anisotropy and dose rates in the Russian section of the International Space Station with the Sileye3/Alteino detector. J. Phys. G,42, 025002, 2015, DOI:10.1088/0954-3899/42/2/025002.
Lishnevskii, A.E., M.I. Panasyuk, O.Yu. Nechaev, V.V. Benghin, V.M. Petrov, A.N. Volkov, V.I. Lyagushin, and I.V. Nikolaev. Results of monitoring variations of absorbed dose rate on board the International Space Station during the period 2005–2011. Cosmic Res.,50, 391–396, 2012.
McIlwain, C.E. Coordinates for mapping the distribution of magnetically trapped particles. J. Geophys. Res., 66, 3681–3691, 1961, DOI:10.1029/JZ066i011p03681.
Mirsch, J., F. Tommasino, A. Frohns, S. Conrad, M. Durante, M. Scholz, T. Friedrich, and M. Löbrich. Direct measurement of the 3-dimensional DNA lesion distribution induced by energetic charged particles in a mouse model tissue. Proc. Nat. Acad. Sci. U.S.A.,112, 12396–12401, 2015,
Nagamatsu, A., K. Murakami, K. Kitajo, K. Shimada, H. Kumagai, and H. Tawara. Area radiation monitoring on ISS Increments 17 to 22 using PADLES in the Japanese Experiment Module Kibo. Radiat. Meas.,59, 84–93, 2013,
DOI:10.1016/j.radmeas.2013.05.008.
Narici, L. Heavy ions light flashes and brain functions: recent observations at accelerators and in spaceflight. New J. Phys.,10, 075010, 2008, DOI:10.1088/1367-2630/10/7/075010.
Narici, L., F. Belli, V. Bidoli, M. Casolino, M.P. De Pascale, et al. The ALTEA/Alteino projects: studying functional effects of microgravity and cosmic radiation, Adv. Space Res., 33, 1352–1357, 2004, DOI:10.1016/j.asr.2003.09.052.
Narici, L., M. Casolino, L. Di Fino, M. Larosa, O. Larsson, P. Picozza, and V. Zaconte. Iron flux inside the International Space Station is measured to be lower than predicted. Radiat. Meas.,47, 1030–1034, 2012, DOI:10.1016/j.radmeas.2012.07.006.
Parihar, V.K., B. Allen, K.K. Tran, T.G. Macaraeg, E.M. Chu, et al. What happens to your brain on the way to Mars. Science Advances,1, e1400256, 2015, DOI:10.1126/sciadv.1400256. Reitz, G., R. Beaujean, E. Benton, S. Burmeister, T. Dachev,
S. Deme, M. Luszik-Bhandra, and P. Olko. Space radiation measurements on-board ISS – the DOSMAP experiment. Radiat. Prot. Dosim.,116, 374–379, 2005, DOI:10.1093/rpd/nci262. Semkova, J., T. Dachev, R. Koleva, S. Maltchev, N. Bankov,
V. Benghin, V. Shurshakov, V. Petrov, and S. Drobyshev. Radiation environment on the International Space Station during the Solar Particle Events in March 2012. Astrobiol. Outreach,1, 102, 2013, DOI:10.4172/2332-2519.1000102.
Semkova, J., T. Dachev, R. Koleva, N. Bankov, S. Maltchev, V. Benghin, V. Shurshakov, and V. Petrov. Observation of radiation environment in the International Space Station in 2012–March 2013 by Liulin-5 particle telescope. J. Space Weather Space Clim., 4, A32, 2014, DOI:10.1051/swsc/2014029.
Smith, M.B., S. Khulapko, H.R. Andrews, V. Arkhangelsky, H. Ing, B.J. Lewis, R. Machrafi, I. Nikolaev, and V. Shurshalov. Bubble-detector measurements in the Russian segment of the
interna-tional Space Station during 2009-12. Radiat. Prot. Dosim.,163, 1–13, 2015, DOI:10.1093/rpd/ncu053.
Sullivan, J.D. Geometrical factor and directional response of single and multi-element particle telescopes. Nucl. Instrum. Methods, 95, 5–11, 1971.
Thuillier, G., and S. Bruinsma. The Mg II index for upper atmosphere modelling. Ann. Geophys.,19, 219–228, 2001. Wilson, J.W., F.A. Cucinotta, M.J. Golightly, J.E. Nealy, G.D.
Qualls, et al. International space station: A testbed for experi-mental and computational dosimetry. Adv. Space Res., 37, 1656–1663, 2006.
Zaconte, V., F. Belli, V. Bidoli, M. Casolino, L. Di Fino, et al. ALTEA: the instrument calibration. Nucl. Instrum. Meth. B,266, 2070–2078, 2008, DOI:10.1016/j.nimb.2008.02.072.
Zaconte, V., M. Casolino, L. Di Fino, C. La Tessa, M. Larosa, L. Narici, and P. Picozza. High energy radiation fluences in the ISS-USLab: ion discrimination and particle abundances. Radiat. Meas.,45, 168, 2010a, DOI:10.1016/j.radmeas.2010.01.020. Zaconte, V., M. Casolino, C. De Santis, L. Di Fino, C. La Tessa,
M. Larosa, L. Narici, and P. Picozza. The radiation environment in the ISS-USLab measured by ALTEA: spectra and relative nuclear abundances in the polar, equatorial and SAA regions. Adv. Space Res.,46, 797, 2010b, DOI:10.1016/j.asr.2010.02.032. Zeitlin, C., D.M. Hassler, F.A. Cucinotta, B. Ehresmann, R.F. Wimmer-Schweingruber, et al. Measurements of energetic par-ticle radiation in transit to Mars on the Mars Science Laboratory. Science,340, 1080–1084, 2013, DOI:10.1126/science.1235989. Zhou, D., D. O’Sullivan, E. Semones, N. Zapp, S. Johnson, and M. Weyland. Radiation dosimetry for high LET particles in low Earth orbit. Acta Astronaut.,63, 855–864, 2008,
DOI:10.1016/j.actaastro.2008.04.002.
Zhou, D., E. Semones, D. O’Sullivan, N. Zapp, M. Weyland, G. Reitz, T. Berger, and E.R. Benton. Radiation measured for MATROSHKA-1 experiment with passive dosimeters. Acta Astronaut.,66, 301–308, 2010,
DOI:10.1016/j.actaastro.2009.06.014.
Cite this article as: Narici L, Casolino M, Di Fino L, Larosa M, Picozza P, et al. Radiation survey in the International Space Station. J. Space Weather Space Clim.,5, A37, 2015, DOI: 10.1051/swsc/2015037.