... 5 ... 6 ... 7 ... 8 ... 9 ... 11 ... 11 ... 14 ... 17 ... 17 ... 18 ... 21 ... 21 ... 23 ... 28 ... 29 ... 30 ... 31 ... 33 ... 36 ... 36 ... 37 ... 41 ... 42 ... 46
... 46 ... 49 ... 54 ... 54 ... 57 ... 59 ... 63 ... 67 ... 69 ... 72 ... 73
8
𝐶𝑂
216
Figure 1 - Contaminants affecting the solid matrix (soil, sludge, sediment) as reported in 2011 [13]
17
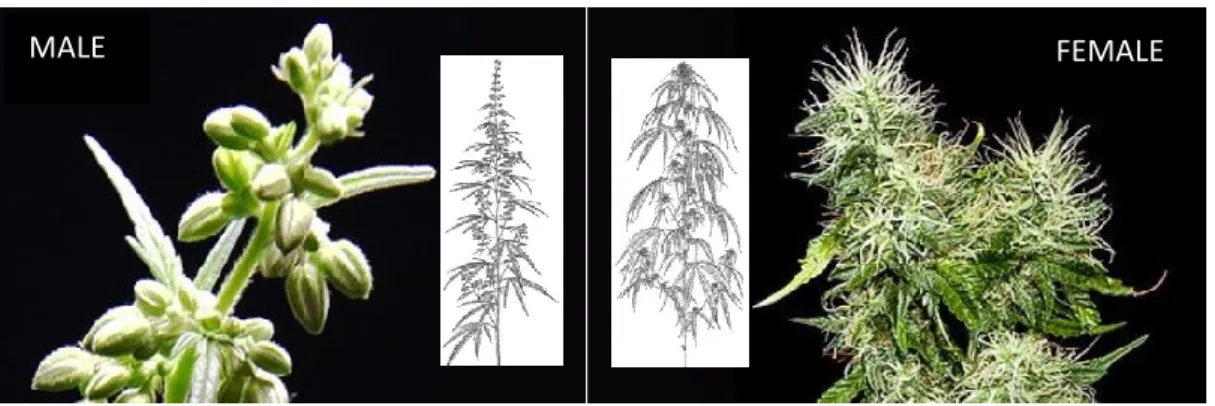
Figure 3 – male specimen of Cannabis sativa L (left), and female (right)
18
Figure 4 - varieties of cannabis plants
19
Figure 6 - stem cross section
20
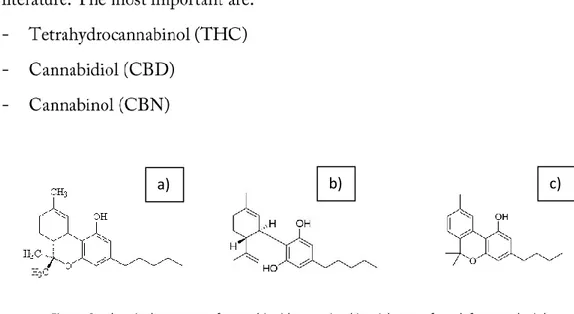
Figure 8 - chemical structure of cannabinoids contained in trichomes: from left towards right, a) THC, b) CBD, c) CBN.
Figure 9 – trichomes
24
Table 2 – Average costs of soil treatment
-
-
25
-
-
-
-
-
-
-
26
-
-
-
-
-
-
27
-
-
-
-
-
28
29
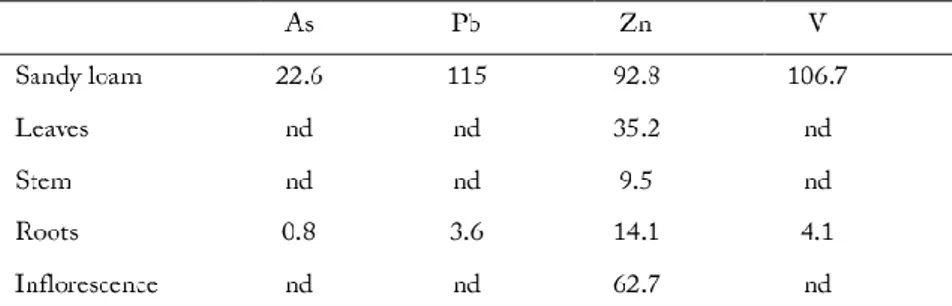
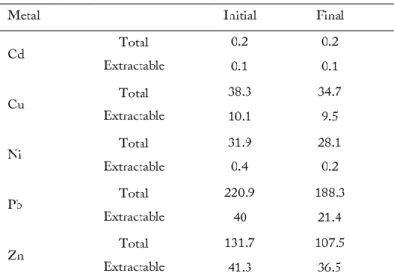
Table 4 - Cu, Ni and Zn levels in plants [mg.kg-1 dried plant matter]
-
-
-
31
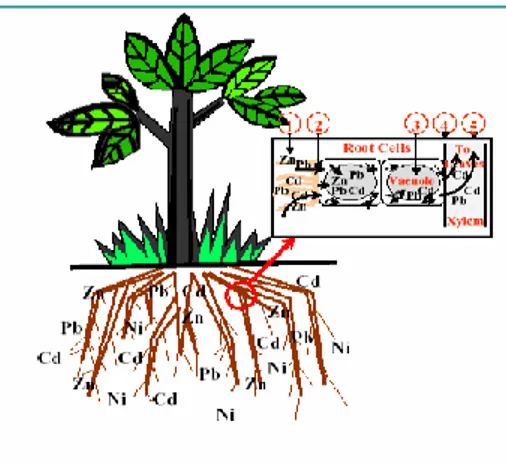
Figure 10 - metal uptake and accumulation: 1) A metal fraction is sorbed at root surface. 2) Bioavailable metal moves across cellular membrane into root cells. 3) A fraction of the metal absorbed into roots is immobilized in
the vacuole. 4) Intracellular mobile metal crosses cellular membranes into root vascular tissue (xylem). 5) Metal is translocated from the root to aerial tissues (stems and leaves). [32]
32
-
-
-
-
-
-
-
-
33
-
-
34
-
37
-
-
-
38
μ
μ μ
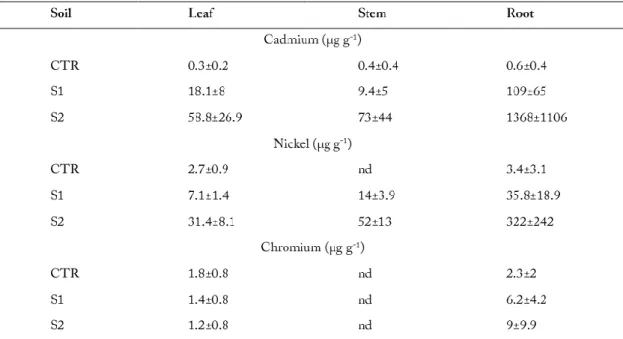
Table 5 - Cd content and total Cd in plant tissues [31]
μ
μ
μ
μ
39
Table 6 - Heavy metal concentrations in ripe hemp organs (µg g-1 dry matter). Mean values ± standard
40
Table 7 - Accumulation of heavy metals in leaves of Hemp plant in mg kg-1
41
43
44
μ
μ
μ
μ
μ
μ
Table 11 - Concentrations of contaminants in unplanted petrol hydrocarbon-polluted (PHC) soil and PHC soil planted with field crops. Values in mg kg-1 [48]
45
46
-
-
47
Figure 12 - Outline of a circular economy [50]
-
-
-
48
49
Figure 13- Sustainable Development Goals
50
-
-
-
-
-
-
-
-
-
-
-
51
-
-
-
-
-
52
-
-
-
-
-
-
-
-
53
-
54
Table 13 - composition of hemp
55
o
o
-
-
-
-
56
59
Figure 15 - hemp plant, pellets and bioplastic spoon
Figure 16 - Greenhouse gas emissions from transport mode (left), Share (%) of transport energy demand by mode (in 2014) [63]
61
62
Figure 17 - Dark green liquid at the left hand side is hemp seed oil while the light green liquid at the right hand side is hemp biodiesel.
63
-
-
-
-
-
64
-
-
-
-
-
-
Table 16 - average metal prices (source:
65
Table 17 - Heating value of crop species in [MJ/kg]
-
𝐿𝐻𝑉
𝑤.𝑏.= (𝑓
𝐶−
𝑓𝑂 2) ∗ 𝑄
𝐶+
𝑓𝐻 2∗ 𝑄
𝐻+ 𝑓
𝑁∗ 𝑄
𝑁+ 𝑓
𝑆∗ 𝑄
𝑆𝐿𝐻𝑉
𝑑.𝑏.= 𝐿𝐻𝑉
𝑤.𝑏.∗
100 100+𝑀𝐶𝑄
𝑖𝛥𝐻
𝑖𝑓
𝑖𝑓
𝑖=
𝑤𝑡%
𝑖100 ∗ 𝑀𝑊
∗ 1000
71
![Figure 1 - Contaminants affecting the solid matrix (soil, sludge, sediment) as reported in 2011 [13]](https://thumb-eu.123doks.com/thumbv2/123dokorg/7388778.97021/16.892.150.722.138.395/figure-contaminants-affecting-solid-matrix-sludge-sediment-reported.webp)
![Table 4 - Cu, Ni and Zn levels in plants [mg.kg -1 dried plant matter]](https://thumb-eu.123doks.com/thumbv2/123dokorg/7388778.97021/29.892.227.664.322.434/table-cu-ni-levels-plants-dried-plant-matter.webp)
![Table 5 - Cd content and total Cd in plant tissues [31]](https://thumb-eu.123doks.com/thumbv2/123dokorg/7388778.97021/38.892.142.713.778.882/table-cd-content-and-total-cd-plant-tissues.webp)