ALMA MATER STUDIORUM A.D. 1088
UNIVERSITÀ DI BOLOGNA
SCUOLA DI SCIENZE
Corso di Laurea Magistrale in Geologia e Territorio
Dipartimento di Scienze Biologiche, Geologiche ed Ambientali
Tesi di Laurea Magistrale
Mapping the bedrock K
2
O, U and Th
concentration in Italy – Towards the European
Atlas of Natural Radiation
Candidato: Relatore:
Alessio Nogarotto Prof. Roberto Braga
Correlatore:
Dott.ssa Giorgia Cinelli
Sessione Marzo 2018
Anno Accademico 2016-2017
i
INDEX
1. ABSTRACT ... 1
2. INTRODUCTION ... 2
3. MATERIALS AND METHODS ... 6
3.1 Software and statistical analysis ... 7
3.2 Geological units identification... 9
3.3 Data research and selection ... 17
4. DATA ANALYSIS ... 20
4.1 Igneous units ... 20
4.1.1 PI – Paleozoic intrusive rocks ... 20
4.1.2 PV – Paleozoic volcanic rocks ... 22
4.1.3 MVI – Mesozoic volcanic and intrusive rocks... 23
4.1.4 PNI – Paleogene-Neogene intrusive rocks ... 25
4.1.5 PNV – Paleogene-Neogene volcanic rocks ... 26
4.1.6 LTP – Lazio-Tuscany magmatic province ... 28
4.1.7 SAP – Sardinian magmatic province ... 30
4.1.8 CAP – Campanian magmatic province ... 32
4.1.9 SSD – Sicilian strait magmatic district ... 33
4.1.10 AEP – Aeolian magmatic province... 35
4.1.11 MVP – Mount Vulture magmatic province ... 37
4.1.12 SIP – Sicilian magmatic province ... 39
4.2 Metamorphic and ultramafic units ... 41
4.2.1 PM – Paleozoic metamorphic rocks ... 41
4.2.2 UM – Ultramafic rocks... 42
4.2.3 TM – Tertiary metamorphic rocks ... 43
4.3 Sedimentary units ... 45
4.3.1 COS – Cambrian-Ordovician-Silurian sedimentary rocks ... 45
4.3.2 DCPS – Devonian-Carboniferous-Permian sedimentary rocks ... 46
4.3.3 TS – Triassic sedimentary rocks ... 47
4.3.4 MC – Mesozoic carbonate rocks ... 48
4.3.5 CdB – “Complessi di base” ... 49
4.3.6 LCPS – Late Cretaceous-Paleogene sedimentary rocks ... 50
4.3.7 EOMS – Eocene-Oligocene-Miocene sedimentary rocks ... 52
4.3.8 ME – Messinian sedimentary rocks ... 53
ii
4.3.10 Q – Quaternary deposits ... 56
5. DISCUSSION ... 57
5.1 Validation of the GU methodology ... 57
5.2 Results and maps discussion ... 62
6. CONCLUSIONS ... 68
7. BIBLIOGRAPHY ... 70
8. APPENDIX ... 74
8.1 Appendix A – The dose ... 74
8.2 Appendix B – Sardinian samples ... 75
1
1. ABSTRACT
The Joint Research Center, the European Commission’s science and knowledge service, started the European Atlas of Natural Radiation project with the objective of gathering all the data related to natural radioactivity from the European countries. The estimate of the terrestrial natural radioactivity is one of the priority of the project and it includes the realisation of concentration maps of the radioactive elements naturally occurring in the environment, that are the elements of the U and Th families together with 40K.
The aim of this work is to study the methodology to develop the first complete K2O, U and Th concentration maps of the bedrock in Italy through the creation of geological units identified on a pre-compiled basis and the collection of geochemical data from scientific literature.
The geological units were determined based on litho-, chrono- and tectono-stratigraphic features of the bedrock. The dataset was created using global open-access database and peer-reviewed articles; the data, more than 15000 in total, was checked for outliers and representativeness and then studied with statistical analysis, in order to evaluate the methodology and to assign an average K2O, U and Th concentration to the geological units. The results confirm that the methodology is reliable and allows to create K2O, U and Th concentration maps at 1:1M scale. The main sources of errors come from the high lithological variability of the units, which implies a high variability in the distribution of the concentration values, and from the heterogeneity of the data coverage. Focusing on these problems, it’s still possible to improve the methodology, especially by increasing the amount of available geochemical data and, subsequently, by realising more accurate maps on a smaller scale.
2
2. INTRODUCTION
Background ionizing radiation is always present, due to both natural and artificial sources. Natural radioactivity has two main influxes: a cosmic contribution, made by cosmic rays that release secondary radiation when they interact with Earth atmosphere, and a terrestrial contribution, made by the radioactive decay of radionuclides present inside the Earth since its formation.
The man-made sources arise from peaceful (e.g. medical use, energy generation, and associated fuel cycle facilities, radioisotope production and waste management) and military purposes (nuclear tests and their fallout or radioactive release and nuclear explosions).
As can be noticed in figure 1, for most individuals the exposure due to natural sources exceeds that from all man-made sources combined. The world average effective dose received by human population is about 3 mSv per year, but large area is known to have values higher than 10 mSv per year (UNSCEAR, 2000; UNSCEAR 2008). See appendix A for more information on general concepts of the dose.
Figure 1: percentage of contributions to the public radiation exposure showing the strong predominance of natural over artificial radioactivity; division of the different natural sources.
Out of the total natural radioactivity, the cosmic contribution represents about 16% of the total exposure which people undergo and its value on a certain zone depends almost entirely on its elevation above sea level (Cinelli et al., 2017); the remaining part is mainly due to terrestrial radionuclides.
The terrestrial contribution is mainly due to potassium (K) and the radioactive families of thorium (Th) and uranium (U), which are the most common natural radioactive elements on Earth and which make up the greatest part of the Naturally-Occurring Radioactive Materials (NORM). They can be found in different concentrations in the Earth’s upper continental crust, with an average, expressed with a variability at one sigma level, of 2.8±0.2 wt% of K2O, 2.7±0.6 ppm of U and 11±1 ppm of Th (Rudnick and Gao, 2014). The local values of the three elements vary depending on the site-specific lithology,
3
geotectonics and geomorphology, which are the controlling factors for estimating natural radioactivity background (Cinelli et al., 2015).
Potassium is the 8th most abundant chemical element in the Earth’s crust and it’s one of the main rock-forming elements. It’s an essential component of common minerals like feldspars, micas and clay minerals, which can be easily found in different kind of rock. K has only one radioactive isotope, 40K, which is 0.01119% of the total potassium and has a half-life of 1.28 Gy (Cicchella et al., 2014). It decays to 40Ar or 40Ca, respectively with and without gamma ray emission. Even though its low occurrence as part of the total potassium, it’s an important radionuclide due to the high concentration of K in natural materials.
In this work, the K2O concentration was preferred to the K content, because the former is commonly used in geosciences. They are correlated by a simple factor: 𝑤𝑡%𝐾2𝑂 = 1.2048 × 𝑤𝑡%𝐾 .
Uranium and thorium have very low concentration in all the rock-forming minerals. During igneous differentiation processes, both Th and U behave as incompatible lithophile elements and partition into the residual melt during fractional crystallisation. U is the essential constituent of rare ore minerals such as uraninite, while Th forms its own uncommon minerals like thorite, thorianite and huttonite and it is present at wt% level in monazite. Uranium and thorium are found at ppm concentrations in many accessory mineral, the most important being zircon, apatite, allanite and xenotime, found in igneous, metamorphic and siliciclastic sedimentary rocks.
Th and U have comparable geochemical behaviour due to their similarities in ion size and chemical bonding. However, fluid-rock interactions fractionate Th from U, with the latter more readily soluble in water than the former (Taylor and McLennan, 1985). Besides, they can both be found as adsorbed elements in clay rocks, with quite high concentrations. On average, Th/U ratio goes from 3 to 5 and is quite constant in Earth upper crust, even though the differences in content ratio of different rocks helps to define their genetic conditions.
4
U has three natural radioactive isotopes (238U, 235U and 234U, with the first two making the 99.995% of all uranium present on Earth) that have, respectively, a half-life of 4.5 Gy, 700 My and 269 ky; Th has only one natural isotope, 232Th, with a half-life of 14 Gy (Cicchella et
al., 2014).
The health hazards associated with Th and U are mostly related to some of their daughter radionuclides: radium-226, radium-228, radon-220 and radon-222 (fig. 2). Among these, radon is by far the most dangerous: it is a noble gas and therefore very mobile, so once it is created from the decay process, it can easily leave its source material and release in the surroundings; when inhaled, it is considered a carcinogenic substance due to the emission of alpha particles. With its low half-life (55 seconds for 220Rn and 3.8 days for 222Rn) and not so low abundance, it contributes for more than 50% of worldwide total annual exposure to natural radiation per capita (fig. 1). Radon concentration in the environment depends on various factors, from bedrock geology to soil geochemistry, from geomorphology to local geotectonic history; only in the last few decades, thanks to the European directives (EC, 1996; EC, 1997; EC, 2013), the problem of natural radioactivity has become an important issue and a growing number of studies have begun to address it (e.g. Callegari et al., 2013; Cinelli et al., 2014).
Studying the natural radioactive background is therefore of primary importance; one of the tasks of the European Commission (EC) under the Euratom Treaty is to collect, validate and provide information about the levels of radioactivity in the environment of the EU Member States (De Cort et al., 2011). So, the project of a European Atlas of Natural Radiation (EANR) came to life in 2006. The Atlas is a collection of maps of Europe displaying the levels of natural radioactivity caused by different sources, from cosmic radiation to terrestrial radionuclides (Cinelli et al., 2018).
Through these maps, the public will be able to: familiarise itself with natural environmental radioactivity; be informed about the levels of natural radioactivity caused by the different sources; have a more balanced view of the annual dose received by the European population, to which natural radioactivity is the largest contributor; and make direct comparisons between doses from natural sources of ionizing radiation and those from man-made (artificial) ones, hence, to better assess the latter (Cinelli et al., 2018).
This project followed the first EC works about collecting, validating and reporting common information about the levels of radioactivity in Europe, like the “Atlas of Caesium deposition on Europe after the Chernobyl accident” (De Cort et al., 1998; De Cort et al., 2011).
As a first task, a European Indoor Radon Map was tackled, since in most cases this is the most important contribution to exposure, and since it could be expected that data collection would take quite some time, because radon surveys have very differently grade of advancement among European countries.
Secondly, the Joint Research Centre (JRC) has undertaken to map a variable, which measures “what earth delivers” in terms of geogenic radon potential (RP), due to heterogeneity of data sources across Europe and the need to develop models for estimating a harmonized quantity that adequately measures or classifies the RP. The European Geogenic Radon Map (EGRM) will give the possibility to characterize areas for
5
radon risk where indoor radon measurements are not available. The multivariate classification approach to estimate the geogenic radon potential has been developed and proposed to the scientific community during the round-table discussions entitled “The
European Geogenic Radon Map and the European Atlas of Natural Radiation”, held during
the 12th International Workshop on the Geological Aspects of Radon Risk Mapping in September 2014 in Prague. In this context, multivariate estimation means to use information from several quantities that are physically related to radon (geochemical data and geological information such as U concentration in bedrock and in soil, terrestrial gamma dose, permeability, geology, etc.) to assess a radon quantity of interest. Some countries, which have several input quantities available, have already been testing this approach. Although work on the geogenic radon map has been under way for several years, it has proven more complicated than initially thought.
For this reason, in the project it has been decided to give priority to the development of those maps that should be part of the EANR but also be used as input parameter in the EGRM, such as the uranium map in soil and bedrock and the terrestrial gamma dose rate. The first version of the European Atlas of Natural Radiation is available in digital format through a web portal (https://remon.jrc.ec.europa.eu/About/Atlas-of-Natural-Radiation), in which all the maps are collected and displayed with the related information. However not all the maps are completed yet and the JRC team keeps working for completing and validating the ones in which only data from few countries are available.
The maps of the EANR have been developed using different input data: for some maps data are available at national level (e.g. indoor radon data); for others at European level (e.g. U, Th and K in soil using FOREGS (http://weppi.gtk.fi/publ/foregsatlas/index.php) and GEMAS databases (http://gemas.geolba.ac.at/).
Indeed, it seems that there are not easily accessible databases of U, Th and K concentration in bedrock, at European or national level, for developing European maps. Because of this, to create these maps the use of data available in scientific literature has been considered. In this contest the aim of the present work is to study the methodology to develop the
maps of K2O, U and Th concentration in bedrock considering Italy as country study. The methodological approach used consists of the following activities:
- identify, starting from OneGeology-Europe data, geological units homogenous in K2O, U and Th content using lithostratigraphy, petrology and mineralogy knowledge;
- collect data of K2O, U and Th concentration in bedrock (i.e. all the consolidated material that lies under the soil or the loose superficial sediments) using scientific literature source;
- check the quality of the data and the geological units;
- assign K2O, U and Th concentration values in bedrock to each geological unit using the collected data;
6
3. MATERIALS AND METHODS
In order to produce the concentration maps of K2O, Th and U in bedrock in Italy we followed
this approach:
1) Identification of the Geological Units (GU) starting from the available data from OneGeology-Europe. To reduce the number of GUs to a manageable size, we employed an expert judgement approach based on litho-, chrono- and tectono-stratigraphic knowledge. This step was supported by GIS-based tools;
2) Assignment of the K2O, U and Th data available in the earth science literature, as well as
data retrieved from global geochemical/petrological databases (e.g EarthRef), to the GUs; 3) Testing the validity of the extrapolation of clustered geochemical data to an entire GU by descriptive statistics of the GUs coupled with ANOVA tests and box plots;
4) Creation of the K2O, U and Th concentration maps with GIS-based tools, using the
statistical results.
The French Institute for Radiological Protection and Nuclear Safety (IRSN) has already used a similar methodology to realise a map of uranium concentration in bedrock in France (Ielsch et al., 2017), implementing geochemical data from literature with specific geological knowledge, e.g. the contributions of the uranium mines and of the enrichment of some sedimentary units in rare elements. The results of the work were then used to study the geogenic radon potential and the environmental radioactivity. The database, though, was not available for the realisation of the French maps of K2O, U and Th concentration.
In our work we only considered the data from literature, without implementing them with geological or tectonic features.
7
3.1 Software and statistical analysis
The ESRI software ArcMap (version 10.1 build 3143) was used for the cartographic elaborations.
The StatSoft software STATISTICA version 8.0 and the Microsoft software Excel 2016 were used for the statistical analysis.
For each unit a series of parameters for the descriptive statistic was calculated, separately for K2O, U and Th, with: number of samples, mean, median, minimum and maximum values, 25th and 75th percentiles, standard deviation, skewness and kurtosis.
Figure 3: aspect of a distribution depending on the skewness value.
Skewness is a measure of the asymmetry of a distribution of a real variable; it is negative if the distribution has the left tail longer than the right one and vice versa (fig. 3). A normal distribution has a skewness value equal to zero.
Kurtosis is a measure of how much a distribution of a real variable differs from a normal one in terms of the form of its tails: a positive kurtosis value indicates a fatter tails distribution, while a negative kurtosis indicates a thinner tails distribution. They are both referred to the normal distribution which has a kurtosis value equal to zero.
In addition to the descriptive statistic, for each GU the dataset of K2O, U and Th was examined with the histograms of the distributions, the normal probability plots and the Shapiro-Wilk test, in order to define the characteristics of the data populations and to verify their distribution (e.g. if normal or log-normal).
Together with the histograms, the normal probability plots and the Shapiro-Wilk test were used to analyse the distributions. They have been performed both with the data and with their natural logarithm; the test gives a p-value that indicates the statistical significance with which you can state if the distribution is normal (or log-normal).
The one-way ANOVA test (Analysis of Variance) was used to evaluate the percentage of variation explained by:
- the analytical methods used to estimate K2O, U and Th contents; - the geological units;
- the lithologies.
This test assumes that, when studying a number of groups, there are two kind of variance: one inside the groups and one between them; so you can analyse if these groups are homogeneous between them (so the major variance is within the groups) or in their inside (so the major variance is between the groups). The test also generates a measure of the
8
effect size, the partial eta-squared value, i.e. an indicator of the percentage of variation of the samples due to the variance between the groups studied.
9
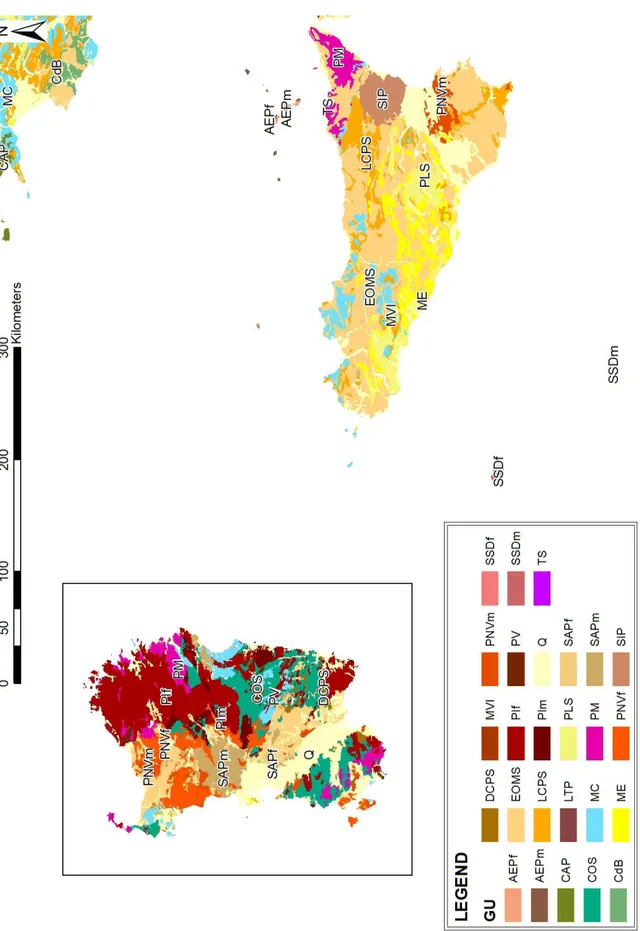
3.2 Geological units identification
For the realisation of the geological map, we used the 1:1M geological cartography available on the OneGeology site (http://portal.onegeology.org/OnegeologyGlobal/) as a
shapefile. This file contains 8909 polygons characterized by the name of the unit to which
they belong and a brief description including geological ages and the lithologies present, which are further divided into a main lithology and several minor ones (table 1).
Table 1: example of the attribute table of the OneGeology-Europe shapefile.
CODE ID name description lowerAge upperAge
IT033 32 GEO1MDB_32
Ophiolites: peridotites, gabbros, basalts, serpentinites and ophiolitic breccias with
various grade metamorphism
Jurassic Jurassic
IT034 33 GEO1MDB_33 Tectonic melanges, locally with low-grade
metamorphism. Emplaced during Miocene Miocene Miocene
IT035 34 GEO1MDB_34
Limestones and marly limestones with chert, radiolarites, calcareous marls, marls and
pelites, locally interbedded turbiditic calcarenites
Cretaceous Tortonian (Pliocene)
CODE urn_litho1 urn_litho2 urn_litho3 urn_litho4 urn_litho5
IT033 Peridotite Gabbro Basalt Serpentinite missing IT034
Clastic sedimentary
rock
missing missing missing missing
IT035 Limestone Mudstone Biogenic silica
sedimentary rock missing missing Firstly, the polygons of the shapefile were grouped, depending on the name of their belonging unit, using the dissolve tool of ArcMap. Then, the original 104 units were reduced by expert judgment to 19 Geological Units, hereafter named GUs (table 2).
GUs were chosen based mainly on their litho-, chrono- and tectono-stratigraphic position and their average lithology. As a matter of fact, the aim of creating the GUs was to obtain groups of rocks with similar K2O, U and Th concentrations, in order to reduce the number of units to the lowest possible and to simplify the final map, trying to maintain a geological coherence.
For sedimentary and metamorphic rocks, the GUs remained those created in the first place. But igneous rocks required more attention, because of the great variety of Italian volcanic and plutonic rocks, reflected by the thousands of studies about them, especially on the Plio-Quaternary products. So, there were two main reasons to split some of the igneous GUs:
a) The great lithological variability, even between the products of a single magmatic province (Peccerillo, 2005), implies that grouping igneous rocks from very different areas can lead to great miscalculations in the statistical analysis;
10
b) The great amount of data available from the scientific literature allows to characterize a lot more units, compared to the units considered for metamorphic and sedimentary rocks.
Table 2: the 19 GUs from the first division of the dataset.
GU DESCRIPTION AGE PREDOMINANT
LITHOLOGIES
SUBORDINATE LITHOLOGIES CdB "Complessi di Base" Middle Jurassic - upper Oligocene Limestone Mudstone
COS
Cambrian-Ordovician-Silurian sedimentary rocks
Upper Precambrian - lower Carboniferous Sandstone, conglomerate limestone, pelite Quartzite, dolostone, mudstone, siltstone DCPS Devonian- Carboniferous-Permian sedimentary rocks
Lower Devonian - lower Triassic
Conglomerate, sandstone, limestone Shale, dolostone LCPS Late Cretaceous-Paleogene sedimentary rocks
Middle Cretaceous - lower
Miocene Shale, limestone
Dolostone, mudstone, biogenic silica sedimentary rock MC Mesozoic carbonate rocks
Upper Permian - middle Cretaceous
Limestone,
dolostone Sandstone, evaporite
ME Messinian
sedimentary rocks Upper Miocene (Messinian)
Limestone,
sandstone Mudstone
MVI Mesozoic volcanic
and intrusive rocks Middle-upper Triassic
Basalt, gabbro, monzonite Syenite, trachyandesite, diorite EOMS Eocene-Oligocene-Miocene sedimentary rocks
Upper Paleocene - upper Miocene
Limestone, sandstone, mudstone Shale, conglomerate PNV Paleogene-Neogene volcanic rocks
Upper Paleocene (Cretaceous) -
lower Pleistocene Rhyolite, andesite Basalt, trachyte
PNI
Paleogene-Neogene intrusive
rocks
Middle Oligocene - lower Pliocene Granite, tonalite
Granodiorite, quartz-monzonite, diorite,
gabbro
PI Paleozoic intrusive
rocks Carboniferous - Permian
Granite, granodiorite, tonalite, monzonite Diorite, quartz-diorite, gabbro PLS Pliocene
sedimentary rocks Lower-upper Pliocene
Sandstone, mudstone
PM Paleozoic
metamorphic rocks
Precambrian - Carboniferous (protolith); upper Carboniferous -
Permian (metamorphism) Gneiss, schist, phyllite Migmatite, granulite, eclogite, amphibolite PQV Plio-Quaternary
volcanic rocks Upper Miocene - Holocene
Rhyolite, dacite, trachyte, basalt, andesite, tephrite Latite, phonolite, foidite PV Paleozoic volcanic
rocks Carboniferous - Permian Rhyolite, dacite Andesite
Q Quaternary
deposits Upper Pliocene - Holocene Clastic sediment Clay
TM Tertiary
metamorphic rocks
Mesozoic (protolith); Eocene
(metamorphism) Schist Quartzite
TS Triassic
sedimentary rocks Lower-middle Triassic Mudstone
Sandstone, conglomerate
UM Ultramafic rocks Paleozoic - Mesozoic Peridotite,
serpentinite Gabbro, pyroxenite Initially, only one GU, named PQV, was created to represent the entirety of the Plio-Quaternary volcanic products. This unit was eventually split into 7 new GUs depending on
11
the geographical location and geotectonic setting: AEP, Aeolian Magmatic Province; CAP, Campanian Magmatic Province; LTP, Lazio-Tuscany Magmatic Province; MVP, Mount Vulture Magmatic Province; SAP, Sardinian Magmatic Province; SIP, Sicilian Magmatic Province; and SSD, Sicilian Strait Magmatic District.
In order to map these units, the PQV feature was separated into its individual 170 polygons using the Explode Multipart Feature editing tool of ArcMap; these polygons were then manually merged depending on what was their new corresponding GU.
However, the problem of the high lithological variability of igneous rocks was still present. To reduce this effect even more, some of the igneous units (AEP, SAP, SSD, PNV and PI) were split in two GUs (denoted by m, mafic, and f, felsic; table 3), based on the chemical composition of the rocks:
- the mafic term includes basic and intermediate rocks: basalt, trachybasalt, andesite, trachyandesite, latite and their intrusive equivalents, besides of all the halfway terms;
- the felsic term contains acid rocks such as dacite, trachyte, rhyolite and their intrusive equivalents, as well as silica-undersaturated rocks (e.g. tephrite, foidite, phonolite), besides of all the halfway terms.
Intermediate rocks were grouped with the mafic ones due to their geochemical affinity and to the fact that the SIP GU comprises only basaltic and andesitic rocks with very few lithological variations.
Silica-undersaturated rocks are common in central Italy and they have been subject to many geochemical studies and researches. The number of data regarding them often exceeds that of other types of rock. Taking into account their peculiar geochemistry, that includes a high content of alkali and trace elements, often comparable to that of granites (Rudnick and Gao, 2003), they were grouped with the felsic rocks. Only in the PNV unit the slightly silica-undersaturated rocks present (nephelinite and tephrite) were grouped within the mafic unit, because of their low K2O, U and Th content.
In order to divide those 5 GUs between felsic and mafic, the descriptions present on the OneGeology-Europe attribute table were used (table 1).
There are two reasons why only a few igneous GUs were split between mafic and felsic: - MVP, SIP, MVI, PNI, PV: the rocks of these units are quite homogeneous and there is not a sharp distinction between two groups;
- CAP, LTP: even though in these two provinces there is evidence of both mafic and felsic products, and the collected data support this fact, the OneGeology-Europe cartography do not make a distinction between them; the only difference reported is made between felsic and silica-undersaturated rocks, that in this work have been grouped together. So, a map that consider felsic and mafic CAP and LTP wasn’t possible to realise with OneGeology-Europe 1:1M cartography.
12
Table 3: complete list of the 30 GUs created for K2O, U and Th mapping. The fourth column indicates the percentage of
the area covered by the unit without considering the extension of the Q unit, which contains all that we didn’t define as bedrock. GU AREA (km2) AREA (%) AREA (% NO Q) DESCRIPTION PREDOMINANT LITHOLOGIES SUBORDINATE LITHOLOGIES
AEPf 43.22 0.01 0.02 Aeolian magmatic
province (felsic) Dacite Rhyolite, trachyte
AEPm 60.95 0.02 0.03 Aeolian magmatic
province (mafic) Basalt Andesite
CAP 1800.07 0.60 0.86
Campanian magmatic
province
Phonolite, trachyte,
tephrite Latite, rhyolite
CdB 6827.89 2.28 3.28 "Complessi di
Base" Limestone Mudstone
COS 3495.55 1.17 1.68 Cambrian- Ordovician-Silurian sedimentary rocks Sandstone, conglomerate, limestone, pelite Quartzite, dolostone, mudstone, siltstone DCPS 2632.12 0.88 1.26 Devonian- Carboniferous-Permian sedimentary rocks Conglomerate,
sandstone, limestone Shale, dolostone
EOMS 59454.80 19.88 28.54 Eocene- Oligocene-Miocene sedimentary rocks Limestone,
sandstone, mudstone Shale, conglomerate
LCPS 25385.40 8.49 12.19 Late Cretaceous-Paleogene sedimentary rocks Shale, limestone Dolostone, mudstone, biogenic silica sedimentary rock LTP 5967.22 2.00 2.86 Lazio-Tuscany magmatic province Trachyte, tephrite, phonolite Rhyolite, trachyandesite, andesite, trachybasalt, leucitite MC 33681.40 11.26 16.17 Mesozoic
carbonate rocks Limestone, dolostone Sandstone, evaporite
ME 8601.73 2.88 4.13
Messinian sedimentary
rocks
Limestone, sandstone Mudstone
MVI 267.06 0.09 0.13 Mesozoic volcanic and intrusive rocks Basalt, gabbro, monzonite Syenite, trachyandesite, diorite MVP 193.98 0.06 0.09 Mount Vulture magmatic province
Tephrite, phonolite Foidite, melilitolite, carbonatite
PIf 8625.38 2.88 4.14
Paleozoic intrusive felsic
rocks
Granite Granodiorite, tonalite
PIm 1066.47 0.36 0.51
Paleozoic intrusive mafic
rocks
Monzonite, diorite Gabbro, quartz-diorite
PLS 13574.70 4.54 6.52
Pliocene sedimentary
rocks
Sandstone, mudstone Marl, limestone
PM 20609.10 6.89 9.89
Paleozoic metamorphic
rocks
Gneiss, schist, phyllite Migmatite, granulite, eclogite, amphibolite
13 GU AREA (km2) AREA (%) AREA (% NO Q) DESCRIPTION PREDOMINANT LITHOLOGIES SUBORDINATE LITHOLOGIES PNI 929.59 0.31 0.45 Paleogene-Neogene intrusive rocks Granite, tonalite Granodiorite, quartz-monzonite, diorite, gabbro PNVf 2027.43 0.68 0.97 Paleogene-Neogene volcanic felsic rocks
Rhyolite Andesite, trachyte
PNVm 1562.48 0.52 0.75 Paleogene-Neogene volcanic mafic rocks Andesite, basalt Basanite, trachyandesite, trachybasalt PV 2175.45 0.73 1.04 Paleozoic
volcanic rocks Rhyolite, dacite Andesite
Q 90689.50 30.33 Quaternary deposits SAPf 85.44 0.03 0.04 Sardinian magmatic province (felsic)
Rhyolite, dacite Trachyte, phonolite
SAPm 1548.19 0.52 0.74
Sardinian magmatic province (mafic)
Basalt, andesite Trachyandesite
SIP 1168.89 0.39 0.56 Sicilian magmatic
province Basalt, trachybasalt
Andesite, trachyandesite SSDf 67.78 0.02 0.03 Sicilian Strait magmatic district (felsic)
Trachyte, rhyolite Missing
SSDm 17.87 0.01 0.01 Sicilian Strait magmatic district (mafic) Basalt Andesite TM 3087.89 1.03 1.48 Tertiary metamorphic rocks Schist Quartzite TS 487.04 0.16 0.23 Triassic sedimentary rocks Mudstone Sandstone, conglomerate
UM 2861.06 0.96 1.37 Ultramafic rocks Peridotite,
14
15
16
17
3.3 Data research and selection
The data used in this work derive directly from scientific literature and from the EarthChem portal database (http://www.earthchem.org/portal), part of the IEDA project, which grants the access to several geoscience databases.
In addition, three samples were collected in central Sardinia and analysed for the K2O, Th and U content at Actlabs, Ontario, Canada, with peroxide fusion ICP/ICPMS; this method, which is based on a strong digestion of the sample, was chosen in order to be sure that even the more resilient minerals, such as zircon and monazite (the main hosts of U and Th in common rocks), were destroyed (for more information see http://www.actlabs.com). A brief description of the three samples is available in Appendix B.
Following the principles of the EU directive INSPIRE ( http://inspire.ec.europa.eu/about-inspire/563), which aims to create a common spatial data infrastructure for environmental policies and activities with the same standards and criteria in all European countries, these data will be available in the future together with the other datasets of the EANR.
IEDA, which stands for Interdisciplinary Earth Data Alliance, is a project funded by the US National Science Foundation in order to “support, sustain, and advance the geosciences by
providing data services for observational geoscience data from the Ocean, Earth, and Polar Sciences”. The EarthChem portal gathers thousands of geochemical data from scientific
publications, uploaded directly by the authors, in addition to all the analyses available in the greatest world databases, such as the USGS one. All data, besides from the pure geochemical analysis required, have several useful features:
- SAMPLE: the name with which the sample was recorded;
- SOURCE: the database from which the electronic datum derives;
- DOI, TITLE, JOURNAL and AUTHOR: the details of the article in which the datum was described;
- LATITUDE, LONGITUDE and LOC PREC: the geographical coordinates of the sample location with their analytical errors;
- MIN AGE, AGE and MAX AGE: respectively the younger, more probable and older geological age of the rock sample;
- METHOD: the analytical method used to study the sample;
- MATERIAL: the category which the rock sample belongs to (igneous, sedimentary or metamorphic);
- TYPE and COMPOSITION: only for igneous rocks, in order to separate volcanic from plutonic and felsic from mafic;
- ROCK NAME: the lithology of the rock sample.
All these features give the users the possibility to search the database by different constraints, depending on the requirement.
Geochemical data from the scientific literature were copied manually into an electronic table through Microsoft Excel, using the same output of EarthChem data, in order to make them comparable.
After the collection was completed, we performed a quality control of the data based on the following criteria:
18
- For the Plio-Quaternary volcanic units all data older than 1996 were discarded. For the other GUs, we rejected data older than 1990. Only a few older articles were taken into account for those units with very few data. This was needed in order to reduce uncertainties, since the old analytical techniques, especially for quantifying U and Th concentrations, were less efficient and precise than modern ones;
- Measurements accomplished by electron microprobe (EMP/EMPA) on single crystal were discarded, because of their lack of representativeness, as well as the analyses carried out on enclaves, xenoliths or veins;
- Data referred to soils or highly altered products were discarded too, since their concentrations were not representative of the bedrock;
- Measurements of K content were converted to K2O content;
- If no data on the analytical methods and the typology of the sample were available in EarthChem, we took down this information from the article, if publicly available. After discarding the data that did not meet the above criteria, the accepted data were assigned to their units based on lithology, age, geographical position and geological formation of the samples described in the electronic table. If one or more of these features were not reported, or when the assignment was doubtful, the datum was rejected.
The outliers of each GU were eliminated thanks to a preliminary statistical analysis: all data with a concentration value lower than 1.5 times the interquartile range (IQR) below the 25th percentile or higher than 1.5 times the IQR above the 75th percentile were defined as outliers and then discarded.
Finally, a database of 15651 analyses, of which 6860 for K2O, 3718 for U and 5073 for Th was created (data are available as supplementary material by contacting the author). The distribution of these data among the different GUs is shown in table 4: as we can see, the percentage of data and area are uncorrelated.
Table 4: list of the 29 GUs analysed in this work, with the number of data, the percentage of the total data and the percentage of the total area (without considering the area covered by quaternary deposits) for each unit.
GU AEPf AEPm CAP CdB COS DCPS EOMS LCPS LTP MC
N° DATA 408 1370 3452 168 70 14 163 78 2174 69
% DATA 2.61 8.75 22.06 1.07 0.45 0.09 1.04 0.50 13.89 0.44
% AREA 0.02 0.03 0.86 3.28 1.68 1.26 28.54 12.19 2.89 16.17
GU ME MVI MVP PIf PIm PLS PM PNI PNVf PNVm
N° DATA 120 228 183 384 110 87 1964 325 189 922
% DATA 0.77 1.46 1.17 2.45 0.70 0.56 12.55 2.08 1.21 5.89
% AREA 4.13 0.13 0.09 4.14 0.51 6.52 9.89 0.45 0.97 0.73
GU PV SAPf SAPm SIP SSDf SSDm TM TS UM
N° DATA 227 95 260 1816 236 114 167 18 240
% DATA 1.45 0.61 1.66 11.60 1.51 0.73 1.07 0.12 1.53
% AREA 1.04 0.04 0.74 0.56 0.03 0.01 1.48 0.23 1.37
Using literature data for mapping has, of course, both pros and cons.
It’s very convenient from an economic and quantitative point of view, because a great amount of data is already available, without the need of a sampling campaign. Furthermore, the ongoing growth of geosciences open-access databases in the last decades
19
is giving everyone the possibility to gather data by simply downloading an electronic table, which is extremely useful for comparing, grouping and analysing different data with ease. Anyway, there are many problems intrinsic in this methodology:
- Firstly, the sampling is not homogeneous and the sample distribution is not proportional to the values for the area covered by each unit, as it is possible to see in table 4. This implies that units and lithologies coverage are not weighted for their extension; actually the GUs with more areal extension are often less represented in the database. This is due to the fact that the number of data for each GU depends on which rocks have been more often object of study and how many of these studies have been published and made available for public use. And so, of course, the number of data does not reflect the unit extents;
- Secondly, geoscientists often dedicate their studies to small-scale features visible in small to meso-scale (from meters to tens of meters) outcrops, rather than to the characterisation of entire units at the km-scale. This means that geochemical studies don’t always represent the mean composition of a unit, not even at a large scale;
- Thirdly, geochemical data, especially U and Th, are not routinely acquired from important rock types such as sedimentary rocks;
- Lastly, there is no active control on the real data truthfulness, contrary to what would happen with a planned sampling campaign.
20
4. DATA ANALYSIS
4.1 Igneous units
4.1.1 PI – Paleozoic intrusive rocks
Description
The PI rocks are Hercynian plutons that form a substantial part of the Sardinian and Calabrian crystalline basement, besides appearing in the Alpine nappes, both in the Southern Alps of Trentino-Alto-Adige (e.g. Cima d’Asta pluton) and in the Alps s.s. (e.g. Graniti dei Laghi). This unit has been divided in two sub-units: mafic and felsic.
Age: Carboniferous – Permian.
Location of the main outcrops: eastern Sardinia; Calabria; central and western Alps. Lithology/composition: gabbro, monzonite, tonalite, granodiorite, granite.
Genesis/emplacement: the rocks of this GU formed during the latest phase of the Hercynian orogeny. Sardinian and Calabrian intrusive rocks are undeformed or with minor deformation, while in the Alps there are evidences of deformation related to the Alpine orogeny, mostly in the Austroalpine (Matterhorn klippe) and Helvetic domain of the western part of the chain (Boselllini, 2005).
Statistical analysis (PIf)
Table 5: descriptive statistic of PIf unit. K2O values are expressed in wt%, U and Th values in ppm. N=number of samples.
Std.Dev.=standard deviation.
N Mean Median Minimum Maximum 25 th Percentile
75th
Percentile Std.Dev. Skewness Kurtosis
K2O 166 3.6 3.6 1.5 6.1 2.9 4.4 1.0 0.0 -0.6
U 81 2.4 2.0 0.4 8.7 1.3 2.9 1.6 1.6 2.6
21
Figure 7: histograms of the K2O, U and Th distribution of the PIf unit.
The PIf unit represents a part of the crystalline basement, which make up for a large portion of the upper crust, and its K2O, U and Th concentration (table 5) are comparable to those of the estimate of Rudnick and Gao (2014) for similar materials.
The K2O and Th distributions are rather symmetrical, while the U data don’t fit well in a normal distribution (fig. 7) and have high skewness and kurtosis values.
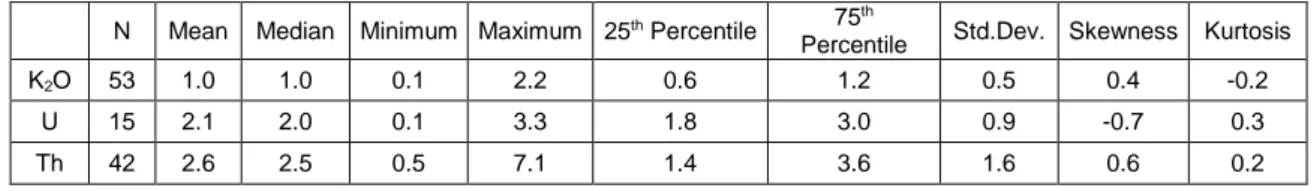
Statistical analysis (PIm)
Table 6: descriptive statistic of PIm unit. K2O values are expressed in wt%, U and Th values in ppm. N=number of
samples. Std.Dev.=standard deviation.
N Mean Median Minimum Maximum 25th Percentile 75th
Percentile Std.Dev. Skewness Kurtosis
K2O 53 1.0 1.0 0.1 2.2 0.6 1.2 0.5 0.4 -0.2
U 15 2.1 2.0 0.1 3.3 1.8 3.0 0.9 -0.7 0.3
22
Figure 8: histograms of the K2O, U and Th distribution of the PIm unit.
The PIm unit shows lower K2O, U and Th concentrations (table 6) than the PIf unit, due to its mafic composition.
The form of the U distribution (fig. 8) highly depends on the low number of samples. The bodies of the K2O and Th distributions can be considered normal, even though they are asymmetrical due to the absence of negative values, as for every natural distribution.
4.1.2 PV – Paleozoic volcanic rocks
Description
Volcanic rocks associated with PI unit. Age: Carboniferous – Permian.
Location of the main outcrops: Southern Alps of Trentino-Alto-Adige; western Liguria, near the border with Piedmont; central and northern Sardinia.
Lithology/composition: felsic and intermediate volcanic rocks with calcalkaline or K-alkaline affinity, ranging from andesite and trachy-andesite to rhyolite and dacite (Cortesogno et
al., 1998).
Genesis/emplacement: the rocks of this unit formed during the latest phase of the Hercynian orogeny. Although most of the Hercynian volcanic product did not survive the erosional processes, there are still large outcrop of them in Trentino-Alto-Adige (e.g. the Lower Permian Athesian Volcanic Group), near the border between Liguria and Piedmont (e.g. Melogno porphyry) and in Sardinia, often associated to plutonic rocks.
23
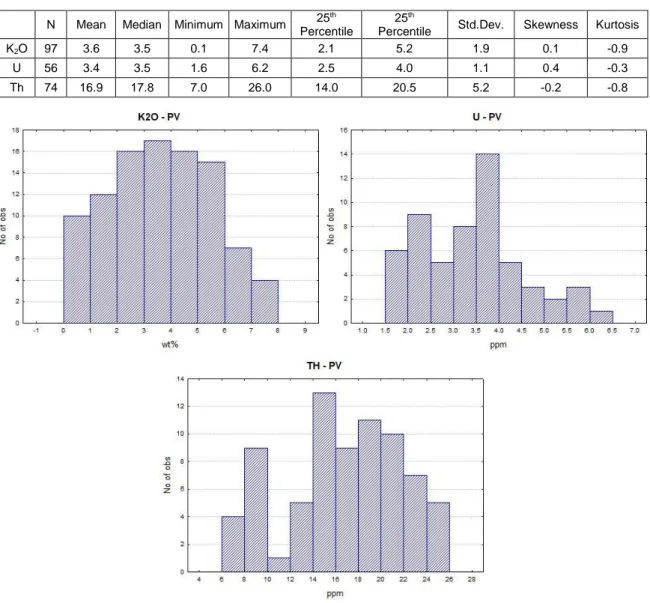
Statistical analysis
Table 7: descriptive statistic of PV unit. K2O values are expressed in wt%, U and Th values in ppm. N=number of samples.
Std.Dev.=standard deviation.
N Mean Median Minimum Maximum 25 th Percentile
25th
Percentile Std.Dev. Skewness Kurtosis
K2O 97 3.6 3.5 0.1 7.4 2.1 5.2 1.9 0.1 -0.9
U 56 3.4 3.5 1.6 6.2 2.5 4.0 1.1 0.4 -0.3
Th 74 16.9 17.8 7.0 26.0 14.0 20.5 5.2 -0.2 -0.8
Figure 9: histograms of the K2O, U and Th distribution of the PV unit.
The K2O, U and Th concentrations of the PV unit (table 7) are comparable to those of the PIf unit, as the former includes the volcanic terms of the latter. U and Th concentrations, however, show higher values in this unit, even though it comprehends andesitic products that should be more mafic than the average PIf sample.
The distributions (fig. 9) are quite symmetrical; the high negative kurtosis value indicates that the tails are not well represented.
4.1.3 MVI – Mesozoic volcanic and intrusive rocks
Description
Mesozoic intrusive rocks and volcanic submarine products associated with MC successions. Age: middle Triassic (Cretaceous).
Location of the main outcrops: Dolomites; Alpine foothills of Lombardy and Veneto; northern Carnia; western Sicily.
Lithology/composition: basalt, andesite, latite and intrusive mafic and felsic rocks with tholeiitic and shoshonitic affinity; rare rhyodacitic lava flows and ignimbritic tuffs.
24
Genesis/emplacement: the Triassic period was characterized by extensional/strike slip tectonic due to the breaking up of the supercontinent Pangea and this led to the formation of a large number of volcanic centres related to lithospheric thinning. The largest outcropping portion of these products is formed by the Predazzo-Monzoni complex, a series of magmatic bodies that intruded the forming MC succession during middle Triassic: it hosts shoshonitic mafic and felsic rocks, from pyroxenite to granite; its precise origin is still debated (Filipponi, 2018).
The other volcanic products that survived until now are mostly lava flows, pillow lavas and hyaloclastites that are found inside Southern Alps carbonate successions and in Sicily (Brondi et al., 1977, Cirrincione et al., 2014). There is evidence of the presence of Cretaceous lamprophyre in Tuscany (Stoppa et al., 2014).
Statistical analysis
Table 8: descriptive statistic of MVI unit. K2O values are expressed in wt%, U and Th values in ppm. N=number of
samples. Std.Dev.=standard deviation.
N Mean Median Minimum Maximum 25 th Percentile
75th
Percentile Std.Dev. Skewness Kurtosis
K2O 130 3.0 3.0 0.0 8.2 1.5 4.3 1.9 0.4 -0.4
U 24 1.5 1.6 0.5 3.0 1.1 2.0 0.7 -0.1 -0.3
Th 74 5.3 5.0 0.1 17.0 3.0 6.5 3.1 1.4 2.5
Figure 10: histograms of the K2O, U and Th distribution of the MVI unit.
The MVI unit shows low K2O, U and Th concentrations (table 8), though the values are strongly influenced by samples of lamprophyre and pyroxenite that are not entirely representative of the unit’s lithology.
25
The data don’t fit in normal distributions (fig. 10), mainly because of the large lithological heterogeneity.
4.1.4 PNI – Paleogene-Neogene intrusive rocks
Description
Oligocene-Miocene syn-collisional plutonic rocks. Age: middle-upper Oligocene.
Location of the main outcrops: central and western Alps.
Lithology/composition: granite, granodiorite, tonalite, gabbro, quartz-monzonite.
Genesis/emplacement: middle to upper Oligocene igneous bodies of the Alps located along the Periadriatic Fault System. Their formation is related to the slab breakoff during the Alpine continental collision (von Blanckenburg and Davies, 1995), that led to an enhanced heat flow from the upwelling asthenospheric mantle. The upwelling mantle caused the partial melting of the overriding upper mantle and lower crust. The outcrops are essentially made of differentiated plutonic felsic rocks, while volcanic products (e.g. the Biella Volcanic Suite; Kapferer et al., 2012) are less represented.
Statistical analysis
Table 9: descriptive statistic of PNI unit. K2O values are expressed in wt%, U and Th values in ppm. N=number of samples.
Std.Dev.=standard deviation.
N Mean Median Minimum Maximum 25 th Percentile
75th
Percentile Std.Dev. Skewness Kurtosis
K2O 120 1.8 2.0 0.2 3.7 1.3 2.4 0.8 -0.4 -0.5
U 101 3.1 2.9 0.3 7.7 1.8 4.2 1.7 0.3 -0.3
Th 104 11.1 11.3 0.3 28.1 5.0 16.0 6.6 0.2 -0.6
26
The PNI unit shows U and Th concentrations similar to the previous felsic units, but K2O content is definitely lower (table 9).
The distributions (fig. 11) are quite symmetrical, but they are affected by the absence of negative values; as like the PV unit, the tails are poorly represented.
4.1.5 PNV – Paleogene-Neogene volcanic rocks
Description
Paleogene and Neogene volcanic and sub-volcanic products related to extensional tectonics or subduction. This unit has been divided in two sub-units: mafic and felsic. Age: Cretaceous – lower Pleistocene.
Location of the main outcrops: Euganean Hills; Hyblean plateau; western Sardinia. Lithology/composition: basalt, andesite, latite, dacite, trachyte, rhyolite.
Genesis/emplacement: the volcanic districts of the Euganean Hills, the Monti Lessini, the Adige valley and the area of Marostica (Veneto) formed between upper Paleocene and upper Oligocene due to extensional tectonics, as a reaction to the compression on the N-S axis that was caused by Alpine orogeny. The products of the Euganean Hills follow the alkaline magmatic series, evolving from K-basalt to latite, trachyte and rhyolite (Tositti et
al., 2017). The rocks from the other zones have tholeiitic affinity and they have few
compositional differences: they consist of basalt, basaltic andesite and nephelinite (Beccaluva et al., 2007).
The Hyblean Plateau volcanism date back to early Cretaceous (even though some cut drillings recovered from commercial wells indicate it was already active during Triassic) and it correlates to the Pietre Nere (Puglia) Mesozoic volcanic activity, as they both are a kind of intraplate magmatism, due to a regime of passive rifting (Beccaluva et al., 1998). The oldest products, in the Pachino-Capo Passero zone (Sicily), are the result of submarine activity that formed basaltic pillow lavas and hyaloclastites; the main phase of activity started in lower Pliocene with mostly basaltic lava flows with tholeiitic or Na-alkaline affinity (Carbone, 2011).
The Oligocene-Miocene activity in Sardinia resulted from the development of a volcanic arc above a subducting slab: it formed when the Corsica-Sardinia block began to separate from Europe, first sliding and then rotating anticlockwise towards its current position, causing the subduction of the Alpine Tethys (Bosellini, 2005). The volcanic products show a calcalkaline affinity and all terms, from mafic to felsic ones, are represented.
Statistical analysis (PNVf)
Table 10: descriptive statistic of PNVf unit. K2O values are expressed in wt%, U and Th values in ppm. N=number of
samples. Std.Dev.=standard deviation.
N Mean Median Minimum Maximum 25 th Percentile
75th
Percentile Std.Dev. Skewness Kurtosis
K2O 135 4.6 4.8 1.6 7.7 3.7 5.4 1.2 0.0 -0.1
U 23 5.7 5.6 1.2 9.8 4.8 6.7 2.0 0.0 0.6
27
Figure 12: histograms of the K2O, U and Th distribution of the PNVf unit.
The K2O, U and Th concentrations of the PNVf unit are rather high (table 10); this is strongly related to the alkaline affinity of the products of the Veneto Volcanic Province, which also make up the majority of the samples.
The data fit well in a normal distribution (fig. 12), even though the kurtosis value for U indicates that the tails are overdeveloped.
Statistical analysis (PNVm)
Table 11: descriptive statistic of PNVm unit. K2O values are expressed in wt%, U and Th values in ppm. N=number of
samples. Std.Dev.=standard deviation.
N Mean Median Minimum Maximum 25 th Percentile
75th
Percentile Std.Dev. Skewness Kurtosis
K2O 439 1.2 1.1 0.0 3.0 0.8 1.6 0.7 0.6 -0.1
U 158 1.4 1.1 0.2 4.5 0.6 1.9 1.0 1.0 0.3
28
Figure 13: histograms of the K2O, U and Th distribution of the PNVm unit.
The PNVm unit shows K2O and U concentrations typical of mafic rocks, while Th concentrations are higher than average (table 11).
The high number of samples indicates that the result should be representative; as a matter of fact, the distributions are normal-shaped (fig. 13). The high skewness values are due to the impossibility to have negative numbers in a natural distribution.
4.1.6 LTP – Lazio-Tuscany magmatic province
Description
Plio-Quaternary plutonic and volcanic products of central Italy, from Lazio, Tuscany, Abruzzo and Umbria region.
Age: late Miocene – Holocene.
Location of the main outcrops: southern Tuscany; Elba island; Lazio; northernmost Campania; little and sporadic outcrops in Umbria and Abruzzo (ULUD: Umbria-Lazio Ultrapotassic District; Lavecchia and Stoppa, 1996).
Lithology/composition: mainly ultrapotassic and silica-undersaturated products, usually with kamafugitic and carbonatitic affinity in Umbria and Abruzzo (Peccerillo, 1998). Shoshonitic, calcalkaline and high-K calcalkaline products are present in the Tuscan area (Chelazzi et al., 2006). The main lithologies consist in trachyandesite, tephrite, phonolite, trachyte and rhyolite.
Genesis/emplacement: the magmatism of central Italy developed within the extensional basins caused by the opening of the Tyrrhenian Sea (Bosellini, 2005). It is composed of several volcanic centres spread across the Tyrrhenian side of central Italy, of which the
29
most important are Elba island, Mount Amiata, Cimini Hills, Vico, Vulsini, Monti Sabatini, Alban Hills, Monti Ernici and Roccamonfina. The only one still considered active, though quiescent, is the Alban Hills volcanic centre, which probably erupted during Holocene (Peccerillo, 2005).
The activity has been mostly explosive, with few effusive events. Intrusive rocks are limited to the Tuscan archipelago (Elba, Giglio and Montecristo islands) and near the town of Gavorrano (Livorno); the main compositions are felsic or intermediate, and their origin is due to an interaction between mantle and crustal melts (Principi et al., 2010).
Statistical analysis
Table 12: descriptive statistic of LTP unit. K2O values are expressed in wt%, U and Th values in ppm. N=number of
samples. Std.Dev.=standard deviation.
N Mean Median Minimum Maximum 25 th Percentile
75th
Percentile Std.Dev. Skewness Kurtosis
K2O 900 5.8 5.8 0.2 14.0 3.8 8.0 2.8 -0.1 -0.8
U 478 11.4 9.1 0.8 37.0 6.1 15.9 7.5 1.1 0.4
Th 798 56.6 46.1 2.4 175.0 27.6 80.0 38.5 0.9 0.0
Figure 14: histograms of the K2O, U and Th distribution of the LTP unit.
The LTP unit shows the highest K2O, U and Th concentrations (table 12), considering the three of them together, as it is already known from literature (Peccerillo, 2005). This is due to the presence of large bodies formed by potassic and ultrapotassic rocks, which are always enriched in rare elements like U and Th.
30
The K2O distribution has high symmetry, but its tails are almost non-existent; the U and Th distributions, on the other hand, have well-developed tails (fig. 14), but they are asymmetrical due to the absence of negative values.
4.1.7 SAP – Sardinian magmatic province
Description
Plio-Quaternary volcanic products of Sardinia. This unit has been divided in two sub-units: mafic and felsic.
Age: lower Pliocene – upper Pleistocene. Location of the main outcrops: central Sardinia.
Lithology/composition: basalt, trachyandesite, trachyte, dacite, rhyolite with tholeiitic or alkaline affinity and geochemical characteristics of intraplate magmatism (Lustrino et al., 2004).
Genesis/emplacement: the Plio-Quaternary volcanism in Sardinia developed within the extensional regime due to the opening of the Tyrrhenian Sea. The main eruptive centres are Capo Ferrato, Logudoro, Montiferru, Monte Arci, Central Sardinia and Orosei-Dorgali. Even though the geotectonic setting is the same for all the districts, the rock composition is extremely heterogeneous and the affinity varies from subalkaline to highly alkaline; furthermore, there is evidence of silica-undersaturated products (Peccerillo, 2005).
The activity has been mainly effusive, with sporadic explosive events. Statistical analysis (SAPf)
Table 13: descriptive statistic of SAPf unit. K2O values are expressed in wt%, U and Th values in ppm. N=number of
samples. Std.Dev.=standard deviation.
N Mean Median Minimum Maximum 25 th Percentile
75th
Percentile Std.Dev. Skewness Kurtosis
K2O 41 5.5 5.4 3.6 8.0 4.5 7.2 1.4 0.4 -1.2
U 22 4.4 4.4 2.3 6.8 3.5 5.0 1.2 0.1 -0.6
31
Figure 15: histograms of the K2O, U and Th distribution of the SAPf unit.
The K2O, U and Th concentrations for the SAPf unit (table 13) are higher than the average composition of the upper crust.
The distributions seem bimodal (fig. 15), even though this could be an effect of the low number of samples.
Statistical analysis (SAPm)
Table 14: descriptive statistic of SAPm unit. K2O values are expressed in wt%, U and Th values in ppm. N=number of
samples. Std.Dev.=standard deviation.
N Mean Median Minimum Maximum 25 th Percentile
75th
Percentile Std.Dev. Skewness Kurtosis
K2O 116 1.8 1.9 0.5 4.2 1.1 2.4 0.8 0.4 -0.3
U 71 0.9 0.8 0.3 2.2 0.6 1.2 0.5 0.8 0.0
32
Figure 16: histograms of the K2O, U and Th distribution of the SAPm unit.
The SAPm unit shows low values for K2O, U and Th concentration (table 14) like the others mafic GU.
The distributions are quite asymmetrical (fig. 16), partly due to the absence of negative values, especially for U.
4.1.8 CAP – Campanian magmatic province
Description
Potassic and ultrapotassic volcanic rocks formed during Plio-Quaternary. This unit has been divided in two sub-units: mafic and felsic.
Age: upper Pliocene – present.
Location of the main outcrops: central Campania and gulf of Naples archipelago.
Lithology/composition: basalt, trachybasalt, tephrite, phonolite and trachyte showing alkaline affinity, with high-K content and commonly silica-undersaturated.
Genesis/emplacement: the products originated from 5 main volcanic centres: Mount Vesuvius, Phlegraean Fields, Ischia, Procida and Vivara. They all formed in extensional basins along the Tyrrhenian Sea border and two of them, Mount Vesuvius and Phlegrean Fields, are still active today (Bosellini, 2005).
The activity has been mostly explosive, with the generation of a great amount of pyroclastic rocks.
33
Statistical analysis
Table 15: descriptive statistic of CAP unit. K2O values are expressed in wt%, U and Th values in ppm. N=number of
samples. Std.Dev.=standard deviation.
N Mean Median Minimum Maximum 25 th Percentile
75th
Percentile Std.Dev. Skewness Kurtosis
K2O 1836 7.5 7.4 4.9 10.0 6.9 8.1 1.0 0.1 -0.1
U 665 8.7 7.2 0.9 20.9 5.9 10.9 4.3 0.9 0.2
Th 951 29.1 26.6 1.5 73.4 19.7 35.9 14.3 0.7 0.4
Figure 17: histograms of the K2O, U and Th distribution of the CAP unit.
The CAP unit has the largest pool of data and its K2O, U and Th concentrations are among the highest ones (table 15), due to the common presence of alkaline and ultra-alkaline silica-undersaturated rocks.
The K2O data fit well in a normal distribution, while U and Th are affected by the absence of negative values (fig. 17).
4.1.9 SSD – Sicilian strait magmatic district
Description
Plio-Quaternary volcanic products of the Sicilian Strait. This unit has been divided in two sub-units: mafic and felsic.
Age: lower Pleistocene – Holocene.
Location of the main outcrops: Pantelleria and Linosa islands.
Lithology/composition: basalt, andesite, trachyte, rhyolite (pantellerite and comendite) with alkaline and peralkaline affinity.
34
Genesis/emplacement: the magmatism of the Sicilian strait developed inside the continental rifting system that interest the northern part of African plate (Peccerillo, 2005) and that formed the two islands of Pantelleria and Linosa. It has an important intraplate volcanism signature, with a great amount of alkaline and peralkaline products.
The first magmatic stage was characterized by hydromagmatic, strombolian and explosive activity, while the last events was almost purely effusive.
Statistical analysis (SSDf)
Table 16: descriptive statistic of SSDf unit. K2O values are expressed in wt%, U and Th values in ppm. N=number of
samples. Std.Dev.=standard deviation.
N Mean Median Minimum Maximum 25 th Percentile
75th
Percentile Std.Dev. Skewness Kurtosis
K2O 129 4.5 4.5 3.9 5.0 4.3 4.6 0.2 -0.1 0.1
U 30 9.6 9.8 1.9 17.2 4.9 13.1 4.4 -0.1 -1.0
Th 77 33.2 33.0 10.5 57.0 28.7 40.0 10.0 -0.2 0.4
Figure 18: histograms of the K2O, U and Th distribution of the SSDf unit.
The SSDf unit has high K2O, U and Th contents (table 16), due to the alkaline and peralkaline affinity of the rocks and the enrichment in rare elements that occurs in pantellerite, the typical peralkaline rhyolite of this GU.
The distributions are symmetrical (fig. 18), but U distribution has really high kurtosis value due to the absence of the tails.
35
Statistical analysis (SSDm)
Table 17: descriptive statistic of SSDm unit. K2O values are expressed in wt%, U and Th values in ppm. N=number of
samples. Std.Dev.=standard deviation.
N Mean Median Minimum Maximum 25 th Percentile
75th
Percentile Std.Dev. Skewness Kurtosis
K2O 31 1.1 1.0 0.8 2.0 0.9 1.4 0.3 1.4 1.3
U 38 1.3 1.1 0.6 3.1 0.7 1.9 0.7 0.8 -0.4
Th 45 3.9 2.6 2.0 8.4 2.4 4.8 2.1 1.0 -0.4
Figure 19: histograms of the K2O, U and Th distribution of the SSDm unit.
The SSDm unit shows low values for K2O, U and Th concentration (table 17) like the others mafic GU.
The SSDm distributions are among the worst (fig. 19). The problem seems to be the presence of rocks with very different K2O, U and Th contents scattered in a low number of data.
4.1.10 AEP – Aeolian magmatic province
Description
Products of the volcanic arc of the Aeolian Islands, north of Sicily. This unit has been divided in two sub-units: mafic and felsic.
Age: middle Pleistocene – present.
Location of the main outcrops: Aeolian archipelago.
Lithology/composition: basalt, andesite, latite, dacite, rhyolite with calcalkaline, high-K calcalkaline and shoshonitic affinity.
36
Genesis/emplacement: the Aeolian volcanic arc formed in Pleistocene due to the subduction of the Ionian Sea under the Calabrian-Peloritan arc. It’s composed of 7 islands: Stromboli, Panarea, Vulcano, Lipari, Salina, Filicudi, Alicudi; among these, Lipari, Vulcano and Stromboli are still active volcanoes, but Lipari and Vulcano are quiescent.
Taking into consideration the complex tectonic background of the area, the volcanic products don’t always have pure calcalkaline affinity and their chemical composition shows considerable variations (Peccerillo, 2005).
The activity has been both effusive and explosive. Statistical analysis (AEPf)
Table 18: descriptive statistic of AEPf unit. K2O values are expressed in wt%, U and Th values in ppm. N=number of
samples. Std.Dev.=standard deviation.
N Mean Median Minimum Maximum 25 th Percentile
75th
Percentile Std.Dev. Skewness Kurtosis
K2O 200 4.5 4.9 1.3 7.3 4.1 5.1 1.0 -0.8 0.3
U 101 8.9 9.1 2.3 16.6 5.6 11.9 3.9 0.1 -1.1
Th 107 29.0 30.0 0.1 58.2 17.9 39.1 14.6 0.1 -1.0
Figure 20: histograms of the K2O, U and Th distribution of the AEPf unit.
The AEPf unit has high K2O, U and Th concentrations (table 18), although the affinity varies from calcalkaline to shoshonitic.
The K2O distribution is asymmetrical; the U and Th distributions, while being symmetrical, have low represented tails (fig. 20).
37
Statistical analysis (AEPm)
Table 19: descriptive statistic of AEPm unit. K2O values are expressed in wt%, U and Th values in ppm. N=number of
samples. Std.Dev.=standard deviation.
N Mean Median Minimum Maximum 25 th Percentile
75th
Percentile Std.Dev. Skewness Kurtosis
K2O 528 2.5 2.1 0.6 5.5 1.8 3.2 1.1 0.8 -0.1
U 380 3.9 3.9 0.2 7.8 3.0 4.8 1.6 0.1 0.1
Th 462 14.4 15.0 1.1 32.1 9.4 18.2 6.4 0.0 -0.3
Figure 21: histograms of the K2O, U and Th distribution of the AEPm unit.
The AEPm unit has very high K2O, U and Th concentrations for a mafic GU (table 19); this is due to the common presence of rocks with trachyandesitic and trachybasaltic composition. The data fit quite well in a normal distribution (fig. 21), apart from the asymmetry of K2O distribution.
4.1.11 MVP – Mount Vulture magmatic province
Description
Plio-Quaternary volcanic products of Mount Vulture (Basilicata). Age: middle-upper Pleistocene.
Location of the main outcrops: Mount Vulture.
Lithology/composition: tephrite, basanite, foidite and phonolite with high alkaline affinity. Evidence of carbonatitic pyroclasts.
Genesis/emplacement: Mount Vulture volcano shares the same origin of the other volcanoes of central Italy, even though its position is quite isolated: it’s located at the front
38
of the Apennines, on the margin of the Apulian foreland, far from the rest of the magmatic districts (Peccerillo, 2005).
The activity of Mount Vulture has been mostly explosive, with the formation of great amount of pyroclastic rocks and some dome structures; several lava flows are also recognizable on the eastern flank of the volcano.
Statistical analysis
Table 20: descriptive statistic of MVP unit. K2O values are expressed in wt%, U and Th values in ppm. N=number of
samples. Std.Dev.=standard deviation.
N Mean Median Minimum Maximum 25 th Percentile
75th
Percentile Std.Dev. Skewness Kurtosis
K2O 57 1.1 0.4 0.2 4.6 0.3 1.3 1.4 1.7 1.5
U 59 36.8 42.5 3.5 63.0 12.8 56.0 20.6 -0.4 -1.6 Th 67 69.0 72.0 15.0 118.0 47.4 87.9 25.1 -0.2 -1.0
Figure 22: histograms of the K2O, U and Th distribution of the MVP unit.
The K2O and U concentrations of the MVP unit are underestimated and overestimated, respectively, due to the high percentage of works regarding Mt. Vulture carbonatitic products, which have very low K2O content and extremely high U content. The Th concentration is more likely representative (table 20), because its content is more comparable between carbonatite and other products.
The distributions show the same trend (fig. 22): most of the K2O data are very low (carbonatites) and U data are divided between high values (carbonatites) and intermediate values (other rocks).