symmetry
S S
Article
Opposition and Identicalness: Two Basic
Components of Adults’ Perception and Mental
Representation of Symmetry
Ivana Bianchi1,*ID, Marco Bertamini2ID, Roberto Burro3and Ugo Savardi3
1 Department of Humanities, University of Macerata, 62100 Macerata, Italy
2 Department of Psychological Sciences, University of Liverpool, Liverpool L69 7ZA, UK;
3 Department of Human Sciences, University of Verona, 37129 Verona, Italy; [email protected] (R.B.);
[email protected] (U.S.)
* Correspondence: [email protected]; Tel.: +39-0733-258-4320 Academic Editors: Sergei D. Odintsov and Christopher W. Tyler Received: 25 June 2017; Accepted: 21 July 2017; Published: 25 July 2017
Abstract: Symmetry is a salient aspect of biological and man-made objects, and has a central role in perceptual organization. Two studies investigate the role of opposition and identicalness in shaping adults’ naïve idea of “symmetry”. In study 1, both verbal descriptions of symmetry (either provided by the participants or selected from among alternatives presented by the experimenter) and configurations drawn as exemplars of symmetry were studied. In study 2, a pair comparison task was used. Both studies focus on configurations formed by two symmetrical shapes (i.e., between-objects symmetry). Three main results emerged. The explicit description of symmetry provided by participants generally referred to features relating to the relationship perceived between the two shapes and not to geometrical point-by-point transformations. Despite the fact that people tended to avoid references to opposition in their verbal definition of symmetry in study 1, the drawings that they did to represent their prototypical idea of symmetry manifested opposition as a basic component. This latter result was confirmed when the participants were asked to select the definition (in study 1) or the configuration (in study 2) that best fitted with their idea of symmetry. In conclusion, identicalness is an important component in people’s naïve idea of symmetry, but it does not suffice: opposition complements it.
Keywords: visual symmetry; bilateral symmetry; identicalness; opposition; between-objects symmetry; mirror-reflected pairs; mirrors
1. Introduction
The perception of symmetry has always been an intriguing subject for psychologists (for a review, see [1,2]). It has also been studied in relation to aesthetics (e.g., [3–9]) and, in recent times, to neuroscience [10,11].
Various studies have consistently demonstrated higher sensitivity (from the age of about four months) for bilateral symmetry around a vertical axis even at very short exposure times [12–15] and in various sense modalities [16,17]. Some studies have shown that the ability to detect mirror symmetry around a particular axis depends on the frequencies of various different orientations within a block of trials (e.g., [14,18]). This implies that the effect of orientation on the detection of symmetry is not completely determined by a fixed neural architecture in the visual system but can be modulated by scanning or attentional strategies. These findings do not negate the aforementioned preference for bilateral symmetry around a vertical axis, they indicate that it may be necessary to adjust the
hypotheses regarding the causes of the phenomena. Since the structure of the ecological world and of artifacts is predominantly bilateral around a vertical axis, the preference for this type of symmetry might depend on exposure.
As noted by Wagemans ([19], p. 346), much of what is known about the effects of several factors on human detection of symmetry (thanks to decades of experimental work) has been inspired by phenomenological observation. Regularity, for example, defined as the salience or perceptual strength of a given pattern, is a classic phenomenological notion (or Gestalt notion) which has inspired a large number of studies on symmetry (e.g., [20–33]). The study described in this paper starts from a similar basis with the aim of analyzing whether and to what extent two phenomenological relationships, namely opposition and identicalness, are salient components of adults’ naïve idea of symmetry.
Identicalness, opposition, similarity and diversity are directly perceived relationships, which are basic to human perception and categorization [34–42]. Every time we make a comparison between two stimuli these relationships inevitably emerge. Therefore, a reasonable question for a psychologist to ask concerns the relationship which is perceived between two shapes recognized as being “symmetrical” (e.g., Figure 1). This has been referred to as “between-object” symmetry to distinguish it from “within-object” symmetry, i.e., when a single figure is involved and symmetry exists between its
individual parts [43,44].
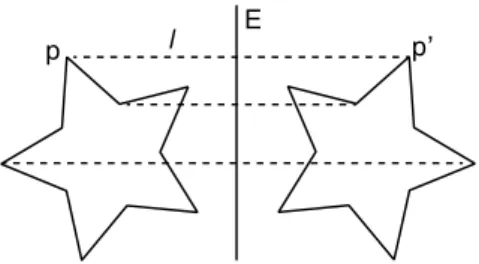
Independently of whether we are talking of a within-object symmetry or between-object symmetry, in geometrical terms symmetry is an isometry, that is, it is a transformation that maps elements to the same or another metric space such that the distance between the elements in the new metric space is equal to the distance between the elements in the original metric space (usually assumed to be bijective). There are four plane isometries: reflection, rotation, translation and glide reflection. Here we focus on reflection and we will reserve the word symmetry for reflectional symmetry. According to a standard definition (see Figure1): “a spatial configuration is symmetrical with respect to a given plane E if it is carried into itself by reflection in E. Take any line l perpendicular to E and any point p on l: there exists one and only one point p’ on l which has the same distance from E but lies on the other side. The point p’ coincides with p only if p is on E. Reflection in E is that mapping of space upon itself, S: p→p’, that carries the arbitrary point p into its mirror image p’ with respect to E” ([45], pp. 4–5). world and of artifacts is predominantly bilateral around a vertical axis, the preference for this type of symmetry might depend on exposure.
As noted by Wagemans ([19], p. 346), much of what is known about the effects of several factors on human detection of symmetry (thanks to decades of experimental work) has been inspired by phenomenological observation. Regularity, for example, defined as the salience or perceptual strength of a given pattern, is a classic phenomenological notion (or Gestalt notion) which has inspired a large number of studies on symmetry (e.g., [20–33]). The study described in this paper starts from a similar basis with the aim of analyzing whether and to what extent two phenomenological relationships, namely opposition and identicalness, are salient components of adults’ naïve idea of symmetry.
Identicalness, opposition, similarity and diversity are directly perceived relationships, which are basic to human perception and categorization [34–42]. Every time we make a comparison between two stimuli these relationships inevitably emerge. Therefore, a reasonable question for a psychologist to ask concerns the relationship which is perceived between two shapes recognized as being “symmetrical” (e.g., Figure 1). This has been referred to as “between-object” symmetry to distinguish it from “within-object” symmetry, i.e., when a single figure is involved and symmetry exists between its individual parts [43,44].
Independently of whether we are talking of a within-object symmetry or between-object symmetry, in geometrical terms symmetry is an isometry, that is, it is a transformation that maps elements to the same or another metric space such that the distance between the elements in the new metric space is equal to the distance between the elements in the original metric space (usually assumed to be bijective). There are four plane isometries: reflection, rotation, translation and glide reflection. Here we focus on reflection and we will reserve the word symmetry for reflectional symmetry. According to a standard definition (see Figure 1): “a spatial configuration is symmetrical with respect to a given plane E if it is carried into itself by reflection in E. Take any line l perpendicular to E and any point p on l: there exists one and only one point p’ on l which has the same distance from E but lies on the other side. The point p’ coincides with p only if p is on E. Reflection in E is that mapping of space upon itself, S: p → p’, that carries the arbitrary point p into its mirror image p’ with respect to E” ([45], pp. 4–5).
Figure 1. The point by point transformation underlying the geometry of mirror symmetry (around a vertical axis). “Take any line l perpendicular to E and any point p on l (…). Reflection in E is that mapping of space upon itself, S: p → p’, that carries the arbitrary point p into its mirror image p’ with respect to E” ([45], pp. 4–5).
Is this what people have in mind when they think of “symmetry”? In Euclidean geometry and its applications, any reference to qualitative features which reveal experiential spatial constructs are eliminated and replaced by abstract entities, definitions and terms. Conversely, the objective of Experimental Phenomenology (e.g., [46–49]) is to identify, describe and define the properties and relationships that are salient from the point of view of human direct experiences. The constructs of “symmetry”, “identicalness” and “opposition” which are used in this paper, as well as those of “regularity” or “goodness” which have been used in relation to symmetry, are all connected with this theoretical perspective. In particular, we hypothesize that since bilateral symmetry is modelled on a mirror reflection and since identicalness and opposition are salient features (as reviewed in Section 2), opposition and identicalness should emerge as a salient integral part of people’s perception and mental representation of “symmetry”. The two studies presented in this paper test this hypothesis.
Figure 1.The point by point transformation underlying the geometry of mirror symmetry (around a vertical axis). “Take any line l perpendicular to E and any point p on l ( . . . ). Reflection in E is that mapping of space upon itself, S: p→p’, that carries the arbitrary point p into its mirror image p’ with respect to E” ([45], pp. 4–5).
Is this what people have in mind when they think of “symmetry”? In Euclidean geometry and its applications, any reference to qualitative features which reveal experiential spatial constructs are eliminated and replaced by abstract entities, definitions and terms. Conversely, the objective of Experimental Phenomenology (e.g., [46–49]) is to identify, describe and define the properties and relationships that are salient from the point of view of human direct experiences. The constructs of “symmetry”, “identicalness” and “opposition” which are used in this paper, as well as those of “regularity” or “goodness” which have been used in relation to symmetry, are all connected with this theoretical perspective. In particular, we hypothesize that since bilateral symmetry is modelled on a mirror reflection and since identicalness and opposition are salient features (as reviewed in Section2),
opposition and identicalness should emerge as a salient integral part of people’s perception and mental representation of “symmetry”. The two studies presented in this paper test this hypothesis.
From Mirrors to Mirror Symmetry
Studies in the field of naïve optics [50] have revealed that when people are asked to determine the reflected world from the “real world” they do not rely on the optical-geometrical point-by-point rule (shown in Figure1) even though they have explicit knowledge of this [50,51]. This is the same as the evidence found in studies on naïve or intuitive Physics concerning movement. It was discovered that when adults are asked to make predictions about simple physical phenomena—for example the case of free falling objects [52–55], the trajectory of objects which have been thrown [56,57] or the orientation of the surface of liquids in variously inclined containers [58,59]—many observers forget about what they have learnt in school. Instead they base their responses on prototypical models that they have in mind [60].
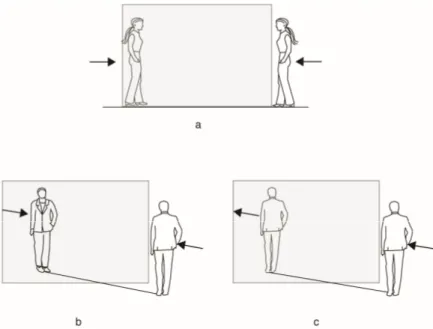
Among the proposals put forward to explain the systematic mistakes that adults make when asked to predict the behavior of reflections (e.g., [61–64]) one concerns the hypothesis that people think of reflections in terms of Identity and/or Opposition [65–67]. Most of the errors made [67–69] are compatible with a generalization of the rule which states that “the reflection does the same” (see Figure2c) and/or “the reflection does the opposite” (see Figure2b), which forms the basis of the macroscopic geometry of the relationship seen between a “real object” and its reflection ([67] (studies 4–5), [70]).
Symmetry 2017, 9, 128 3 of 21
From Mirrors to Mirror Symmetry
Studies in the field of naïve optics [50] have revealed that when people are asked to determine the reflected world from the “real world” they do not rely on the optical-geometrical point-by-point rule (shown in Figure 1) even though they have explicit knowledge of this [50,51].This is the same as the evidence found in studies on naïve or intuitive Physics concerning movement. It was discovered that when adults are asked to make predictions about simple physical phenomena—for example the case of free falling objects [52–55], the trajectory of objects which have been thrown [56,57] or the orientation of the surface of liquids in variously inclined containers [58,59]—many observers forget about what they have learnt in school. Instead they base their responses on prototypical models that they have in mind [60].
Among the proposals put forward to explain the systematic mistakes that adults make when asked to predict the behavior of reflections (e.g., [61–64]) one concerns the hypothesis that people think of reflections in terms of Identity and/or Opposition [65–67]. Most of the errors made [67–69] are compatible with a generalization of the rule which states that “the reflection does the same” (see Figure 2c) and/or “the reflection does the opposite” (see Figure 2b), which forms the basis of the macroscopic geometry of the relationship seen between a “real object” and its reflection ([67] (studies 4–5), [70]).
Figure 2. Some errors emerged in tasks which required participants to predict the location and direction of motion in a reflection: (a) when the “real” person moved parallel to a vertical mirror on a wall, many people expected her reflection to appear at the farther edge of the mirror walking towards the “real person”; (b,c) when the “real person” moved at an angle towards a mirror, some people expected the reflection to move along the same trajectory with an opposite orientation (b) or along the same trajectory but with an identical orientation (c).
When people observe simple objects positioned in front of a vertical plane mirror or in motion at various angles of incidence towards or away from the mirror, descriptions such as “the reflection has an identical orientation/direction of motion” or “the reflection has an opposites orientation/direction of motion as compared to that of the real object” are judged to be accurate (see [67] studies 4–5). Similarly, when naïve observers see their own image in a plane mirror (or another person’s image), they report that they perceive the orientation of the reflection to be opposite with respect to the real body [70]. The fact that our left arm in the reflection is our right arm is a visual characteristic which we notice, especially when we are encouraged to focus on the lateralization of our body. However, we also immediately notice that we are facing in one direction (e.g., north) while the reflection is
Figure 2.Some errors emerged in tasks which required participants to predict the location and direction of motion in a reflection: (a) when the “real” person moved parallel to a vertical mirror on a wall, many people expected her reflection to appear at the farther edge of the mirror walking towards the “real person”; (b,c) when the “real person” moved at an angle towards a mirror, some people expected the reflection to move along the same trajectory with an opposite orientation (b) or along the same trajectory but with an identical orientation (c).
When people observe simple objects positioned in front of a vertical plane mirror or in motion at various angles of incidence towards or away from the mirror, descriptions such as “the reflection has an identical orientation/direction of motion” or “the reflection has an opposites orientation/direction of motion as compared to that of the real object” are judged to be accurate (see [67] studies 4–5). Similarly, when naïve observers see their own image in a plane mirror (or another person’s image), they report that they perceive the orientation of the reflection to be opposite with respect to the real
body [70]. The fact that our left arm in the reflection is our right arm is a visual characteristic which we notice, especially when we are encouraged to focus on the lateralization of our body. However, we also immediately notice that we are facing in one direction (e.g., north) while the reflection is facing the opposite direction (i.e., south) and when we walk towards the mirror, the person in the reflection moves in the opposite direction (i.e., representing opposition on the sagittal axis). When the mirror is on the wall to the side of an observer, the reflection has an identical sagittal and gravitational orientation with respect to the real person but is opposite in terms of the coronal axis; if the person then moves laterally to his/her right (e.g., eastwards), the reflection moves in the opposite direction (i.e., to the left and westwards). If the observer then positions him/herself on top of a mirror lying on the floor, he/she again perceives the reflection as having an opposite orientation along the gravitational axes (as the reflection is upside-down). In all of these conditions, the orientation of the reflection is consistently described as “opposite” (rather than “identical”, “similar”, or “different”) in a percentage of cases ranging between 80% and 100% of the participants, depending on the position of the mirror (see [70], Figure3). This concurs with the fact that participants in mirror tasks describe their reflection as “identical” to themselves when looking at their reflection in a mirror set vertically in front of them or to their side, or as “opposite” or “similar” to themselves when looking at their reflection in a mirror set horizontally under their feet [70]. These findings are in agreement with studies carried out with various types of visual stimuli which show that transforming the orientation of something into its opposite orientation guarantees an overall perception of clear contrast and clear invariance at the same time, and these seem to be the two conditions which are necessary for the relationship between two things or events to be specifically recognized as contrary/opposite, rather than generically different [34,35,71]. In this study, we posed the question of whether the fact that reflections are phenomenally associated with the recognition of identity and opposition (as mentioned above) can be generalized to the naïve idea of symmetry, which adults have in mind. If so, the configurations that people consider to be good examples of a “symmetrical configuration” should reveal not only identity but also opposition. In other words, they should look more like those shown on the right side in Figure3than those shown on the left.
Symmetry 2017, 9, 128 4 of 21
facing the opposite direction (i.e., south) and when we walk towards the mirror, the person in the reflection moves in the opposite direction (i.e., representing opposition on the sagittal axis). When the mirror is on the wall to the side of an observer, the reflection has an identical sagittal and gravitational orientation with respect to the real person but is opposite in terms of the coronal axis; if the person then moves laterally to his/her right (e.g., eastwards), the reflection moves in the opposite direction (i.e., to the left and westwards). If the observer then positions him/herself on top of a mirror lying on the floor, he/she again perceives the reflection as having an opposite orientation along the gravitational axes (as the reflection is upside-down). In all of these conditions, the orientation of the reflection is consistently described as “opposite” (rather than “identical”, “similar”, or “different”) in a percentage of cases ranging between 80% and 100% of the participants, depending on the position of the mirror (see [70], Figure 3). This concurs with the fact that participants in mirror tasks describe their reflection as “identical” to themselves when looking at their reflection in a mirror set vertically in front of them or to their side, or as “opposite” or “similar” to themselves when looking at their reflection in a mirror set horizontally under their feet [70]. These findings are in agreement with studies carried out with various types of visual stimuli which show that transforming the orientation of something into its opposite orientation guarantees an overall perception of clear contrast and clear invariance at the same time, and these seem to be the two conditions which are necessary for the relationship between two things or events to be specifically recognized as contrary/opposite, rather than generically different [34,35,71].
In this study, we posed the question of whether the fact that reflections are phenomenally associated with the recognition of identity and opposition (as mentioned above) can be generalized to the naïve idea of symmetry, which adults have in mind. If so, the configurations that people consider to be good examples of a “symmetrical configuration” should reveal not only identity but also opposition. In other words, they should look more like those shown on the right side in Figure 3 than those shown on the left.
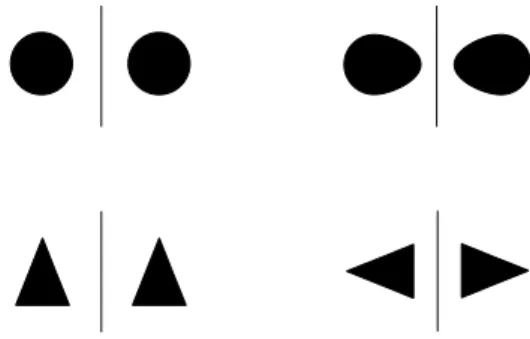
Figure 3. Mirror symmetry applied to configurations that have different symmetrical structures. On the left: shapes which are symmetrical along the axis parallel to the mirror minimize the perception of contrariety (which remains relative only to the position of the shapes, i.e., one to the left and the other to the right of the mirror axis) and maximize perception of identicalness. On the right: shapes which are symmetrical only with respect to the axis which is orthogonal to the mirror axis but which are asymmetrical with respect to the axis parallel to the mirror axis make the opposite orientation easier to see (for farther explanations, see text).
The configurations displayed in Figure 3 are, from a geometrical point of view, equally valid examples of reflections around a vertical axis. However, the configurations on the left look identical and the only recognizable element of opposition concerns the localization of the two shapes with respect to the mirror axis. Conversely, the configurations on the right show opposition as they show shapes which are oppositely oriented. If visible opposition, in addition to visible identity, is an important component of people’s naïve idea of symmetry, then these configurations would not be equally good and we should expect those on the right to be better examples.
2. Study 1
The aim of this study was to ascertain how important the role of identicalness and opposition is in the explicit idea (i.e., verbal description) and implicit idea (i.e., mental representation or
Figure 3. Mirror symmetry applied to configurations that have different symmetrical structures. On the left: shapes which are symmetrical along the axis parallel to the mirror minimize the perception of contrariety (which remains relative only to the position of the shapes, i.e., one to the left and the other to the right of the mirror axis) and maximize perception of identicalness. On the right: shapes which are symmetrical only with respect to the axis which is orthogonal to the mirror axis but which are asymmetrical with respect to the axis parallel to the mirror axis make the opposite orientation easier to see (for farther explanations, see text).
The configurations displayed in Figure3are, from a geometrical point of view, equally valid examples of reflections around a vertical axis. However, the configurations on the left look identical and the only recognizable element of opposition concerns the localization of the two shapes with respect to the mirror axis. Conversely, the configurations on the right show opposition as they show shapes which are oppositely oriented. If visible opposition, in addition to visible identity, is an important
component of people’s naïve idea of symmetry, then these configurations would not be equally good and we should expect those on the right to be better examples.
2. Study 1
The aim of this study was to ascertain how important the role of identicalness and opposition is in the explicit idea (i.e., verbal description) and implicit idea (i.e., mental representation or “prototypical mental image” in Yates et al.’s terms [60]) that naïve subjects have of symmetry. The former was assessed by asking participants to verbally describe the features characterizing two symmetrical shapes (the 1st question in the experiment) and at the end of the session, requesting them to choose which description out of three fit in best with their idea of symmetry (the 4th question). The implicit idea of symmetry was tested by assessing the drawings done by the participants as examples of their idea of symmetry (the 2nd and 3rd questions).
Since we were interested in understanding the relational aspects which characterize two symmetrical figures and to prevent the participants from simply drawing stereotypical images of symmetry such as a butterfly or a human face, we asked them to draw configurations consisting of two shapes which were symmetrical to each other.
We expected explicit and implicit descriptions to be related, but not necessarily to coincide. For example, participants might omit explicit references to opposition in their verbal description in response to question 1, but then draw configurations that manifest the opposite orientation of two figures (as those represented on the right in Figure3) or, conversely, give verbal descriptions referring to the opposition component and then draw configurations that do not display opposition (such as the configurations on the left in Figure3). Since we hypothesize that opposition is a structural implicit component of symmetry, we anticipated that the former expectation would be more likely to occur.
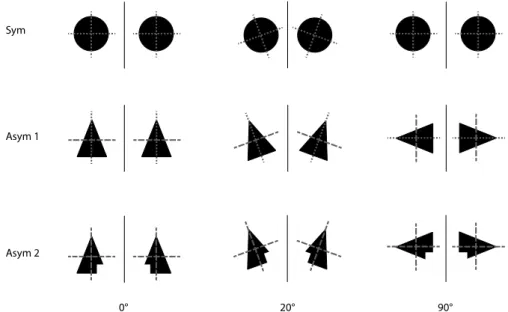
The drawings were analyzed according to a series of features of interest for the purposes of this study. These concerned, first of all, the shape of the figures forming the configuration (i.e., were they symmetrical or asymmetrical?) and the orientation of the two shapes with respect to the mirror axis. The reason why these features are important will become evident in Figure4. The Figure represents various examples of symmetrical configurations around a vertical mirror axis, black circles in the first row, isosceles triangles in the second row and isosceles triangles with a piece missing in the third row. The difference between these concerns: (i) the structure of the shapes forming the configuration in terms of whether they are symmetrical or asymmetrical and the orientation of the shapes with respect to the mirror axis (0◦, 20◦, or 90◦). The structure of the shapes (symmetry or lack of symmetry) is defined by two internal axes which are orthogonal to each other, represented by dashed lines in Figure4. The orientation of the shapes with respect to the mirror axis is determined by three different angles: in the first column (0◦), the shapes are positioned so that one of the internal axes is parallel and the other is orthogonal to the mirror axis; in the second column, the shapes have been rotated by 20◦with respect to the original position and in the third column, they have been rotated by 90◦with respect to the original position.
If the shapes forming the configuration are symmetrical with respect to both of their internal axes (Sym in Figure4), it is impossible for the two shapes to be oppositely oriented, whatever their position with respect to the mirror axis is. Conversely, if the shapes are symmetrical with respect to one axis but asymmetrical with respect to the other axis (Asym 1 in Figure4), it is only when the shapes are positioned so that their internal axis of symmetry is parallel to the mirror axis (i.e., Asym 1 at 0◦in Figure4) that the two shapes look identical to each other. In all other positions, the two shapes display an opposite orientation and this becomes particularly salient when the internal axis of symmetry is orthogonal to the mirror axis (i.e., Asym 1 at 90◦in Figure4). If the shapes are asymmetrical with respect to both of their internal axes (Asym 2 in Figure4), it is impossible for them to be organized in such a way that they look identical and do not display an opposite orientation.
In order to determine whether opposition was visually evident or masked in the participants’ drawings, it was therefore critical to analyze the shapes in terms of whether they were Sym, Asym
1 or Asym 2 and, in the case of shapes with one internal axis of symmetry (i.e., Asym 1), to analyze how the participants positioned them with respect to the mirror axis, i.e., whether the internal axis of symmetry was parallel to the mirror axis, as in the 0◦column in Figure4, or orthogonal to the mirror axis, as in the 90Symmetry 2017, 9, 128 ◦column in Figure4. 6 of 21
Figure 4. The differences in perceptual impact of rotating the black shapes (original position: 0°) by, respectively, 20° and 90° angles with respect to the “mirror axis” (the solid vertical line). The dashed lines indicate the two internal orthogonal symmetry axes. The shapes in the first row (Sym) are symmetrical with respect to both their internal axes (indicated by small dashes); the shapes in the second row (Asym 1) are symmetrical with respect to one axis (small dashes) and asymmetrical with respect to the other axis (large dashes) and the shapes in the third row (Asym 2) are asymmetrical with respect to both internal axes (large dashes). For a further explanation, see the text.
We also took into consideration, in the case of shapes that clearly pointed in a particular direction, whether there was a preference for divergent or convergent patterns. Furthermore, we explored whether the mirror axis of the prototypical configurations that the participants had in mind was more frequently oriented vertically. If so, we further investigated how robust this aspect was in terms of whether it was invariant in both drawings.
2.1. Materials and Method
2.1.1. Participants
109 undergraduate students of Psychology and Education at the University of Verona, Italy (mean age 21.2; 74 females; 35 males). The study was approved by the Ethics Committee of the University of Verona as the local ethics committee responsible and was conducted in accordance with the Declaration of Helsinki (revised 2008). All participants gave their written informed consent in accordance with the local ethics committee requirements.
2.1.2. Materials
A 5 page booklet with each page containing a different request: (1) How would you define the relationship between two symmetrical shapes? (2) Draw a clear example of your idea of two symmetrical shapes.
(3) Draw another clear example (radically different from the first two) of your idea of two symmetrical shapes. (4) Which of the following three definitions best describes your idea of symmetry?
(a) Two identical shapes
Figure 4.The differences in perceptual impact of rotating the black shapes (original position: 0◦) by, respectively, 20◦and 90◦angles with respect to the “mirror axis” (the solid vertical line). The dashed lines indicate the two internal orthogonal symmetry axes. The shapes in the first row (Sym) are symmetrical with respect to both their internal axes (indicated by small dashes); the shapes in the second row (Asym 1) are symmetrical with respect to one axis (small dashes) and asymmetrical with respect to the other axis (large dashes) and the shapes in the third row (Asym 2) are asymmetrical with respect to both internal axes (large dashes). For a further explanation, see the text.
We also took into consideration, in the case of shapes that clearly pointed in a particular direction, whether there was a preference for divergent or convergent patterns. Furthermore, we explored whether the mirror axis of the prototypical configurations that the participants had in mind was more frequently oriented vertically. If so, we further investigated how robust this aspect was in terms of whether it was invariant in both drawings.
2.1. Materials and Method
2.1.1. Participants
109 undergraduate students of Psychology and Education at the University of Verona, Italy (mean age 21.2; 74 females; 35 males). The study was approved by the Ethics Committee of the University of Verona as the local ethics committee responsible and was conducted in accordance with the Declaration of Helsinki (revised 2008). All participants gave their written informed consent in accordance with the local ethics committee requirements.
2.1.2. Materials
A 5 page booklet with each page containing a different request: (1) How would you define the relationship between two symmetrical shapes? (2) Draw a clear example of your idea of two symmetrical shapes.
(3) Draw another clear example (radically different from the first two) of your idea of two symmetrical shapes. (4) Which of the following three definitions best describes your idea of symmetry?
(a) Two identical shapes (b) Two opposite shapes
(c) Two identical and opposite shapes
The order of the four questions was the same for all participants; the order of the three definitions in question four was randomized between participants.
2.1.3. Procedure
The experiment was conducted at the beginning of a class on a topic which was totally unrelated to the issue. Participants were seated 6 seats apart in order to prevent them from influencing each other. Each participant received a booklet. They were told to start from the first page and move to the next one only after having completed the previous page. There were no time limits. All of the participants took less than 10 min to complete the task.
2.1.4. Statistical Analysis
Responses were analyzed using Generalized Mixed effect Models (GLMM) [72]. All of the variables analyzed in Study 1 are categorical variables. Responses were coded binomially (i.e., in terms of use or non-use of each level of the categorical variable), and binomial family GLMMs (with logit link function) were then conducted on the frequency of use of each level of the categorical variable (i.e., proportion of use over non-use). Mixed effect models allowed us to deal with the variability between participants as a Random effect. In cases involving significant main effects or interactions, post-hoc tests using the Bonferroni correction were conducted and estimates were made of both the non-standardized size of the effect (i.e., EST, which indicates the log odd ratio) and the standardized size of the effect (i.e., Cohen’s index d; see [73–75]).
All analyses were carried out using the statistical software program R 3.3.1, with the “lme4”, “car”, “lsmeans”, and “effects” packages. We performed Mixed Model ANOVA Tables (Type 3 tests) via likelihood ratio tests implemented in the “afex” package.
2.1.5. Results
In this section, we will focus first on the verbal descriptions of symmetry given by the participants in answer to question 1 and chosen in question 4; then we will analyze the drawings showing examples of the idea of symmetry (questions 2 and 3). Lastly, we will assess any association between the verbal descriptions in questions 1 and 4 and the drawings.
(I) Verbal descriptions of symmetry
The definitions produced by the participants in response to question 1 were classified into different categories based on their content. The categories were defined by the experimenters after an initial inspection of the responses. The classification was then conducted by two independent judges based on these categories (with almost perfect agreement, Cohen’s κ index = 0.92). Four responses were excluded from the analyses since they were either missing or tautological. The categories are listed in Table1, together with some examples of descriptions and the frequency of each category. Less than 3% of the descriptions given by the participants referred to a point-by-point transformation such that shown in Figure1(see category a in Table1). All the other responses referred to features relating to the relationship perceived between the two shapes.
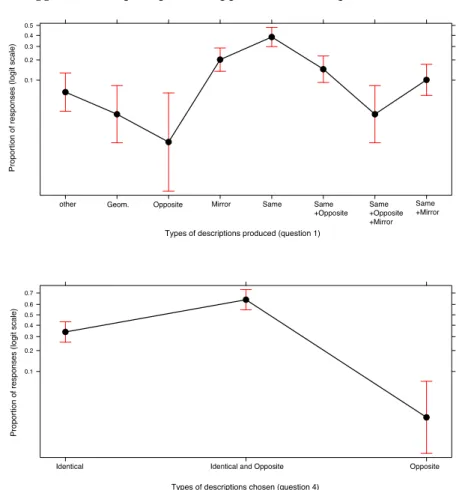
A GLMM (binomial family) tested whether some types of description were more frequently given and this turned out to be the case (χ2(7, 105)= 77.189, p < 0.0001, see top graph in Figure5). As post-hoc tests revealed, responses referring exclusively to the sameness of the two symmetrical shapes (either in general, or specifying that they were the same in terms of shape and/or size—see examples of the descriptions under the category b in Table1) were significantly more frequent than all of the
other response categories except for those responses which made exclusive and explicit reference to a specular configuration (i.e., category c in Table1; EST = 9.074, SE = 0.309, z-ratio = 2.934, p = 0.093).
The findings were as follows:
(a) Exclusive references to Sameness were significantly more frequent than references to both Sameness and Opposition (categories b versus f in Table1: EST = 1.292, SE = 0.334, z-ratio = 3.863, p = 0.003, d = 0.376);
(b) The two most frequent types of description (i.e., categories b and c in Table1), which together amount to 61% of the total number of responses, do not explicitly refer to opposition;
(c) Only one response (i.e., less than 1%) mentioned the opposition component exclusively (category e in Table1: “Two symmetrical shapes are two opposite shapes”);
(d) Overall Opposition, in one way or another (i.e., categories e, f, and g in Table1) was mentioned in only 20 out of the 105 descriptions collected (i.e., 19.04%).
These results suggest that the perception of opposition was not prominent in the verbal definitions.
Symmetry 2017, 9, 128 8 of 21
(a) Exclusive references to Sameness were significantly more frequent than references to both Sameness and Opposition (categories b versus f in Table 1: EST = 1.292, SE = 0.334, z-ratio = 3.863,
p = 0.003, d = 0.376);
(b) The two most frequent types of description (i.e., categories b and c in Table 1), which together amount to 61% of the total number of responses, do not explicitly refer to opposition;
(c) Only one response (i.e., less than 1%) mentioned the opposition component exclusively (category e in Table 1: “Two symmetrical shapes are two opposite shapes”);
(d) Overall Opposition, in one way or another (i.e., categories e, f, and g in Table 1) was mentioned in only 20 out of the 105 descriptions collected (i.e., 19.04%).
These results suggest that the perception of opposition was not prominent in the verbal definitions.
Figure 5. Effect plot of the proportional use of each of the various response categories for question 1 (top graph) or chosen from among the three alternatives in question 4 (bottom graph). Proportions are reported on a logit link scale (as computed by the GLMMs described in the main text). Error bars represent a 95% confidence interval.
A different picture emerged in the case of responses to question 4, for which participants were asked to choose which out of the three descriptions (“Two identical shapes”, “Two opposite shapes” and “Two identical and opposite shapes”) best fitted their idea of symmetry (χ2(2, 109) = 48.769, p < 0.0001; see bottom graph in Figure 5). “Identical and Opposite” was more frequently chosen as compared to exclusive references to Opposition (EST = 4.564, SE = 0.741, z-ratio = 6.159, p < 0.0001, d
Figure 5.Effect plot of the proportional use of each of the various response categories for question 1 (top graph) or chosen from among the three alternatives in question 4 (bottom graph). Proportions are reported on a logit link scale (as computed by the GLMMs described in the main text). Error bars represent a 95% confidence interval.
A different picture emerged in the case of responses to question 4, for which participants were asked to choose which out of the three descriptions (“Two identical shapes”, “Two opposite shapes” and “Two identical and opposite shapes”) best fitted their idea of symmetry (χ2
(2, 109)= 48.769, p < 0.0001; see bottom graph in Figure5). “Identical and Opposite” was more frequently chosen as compared to exclusive references to Opposition (EST = 4.564, SE = 0.741, z-ratio = 6.159, p < 0.0001, d = 0.601) but “Identical and Opposite” was also more frequently chosen as compared to exclusive references to Identicalness (EST = 1.250, SE = 0.284, z-ratio = 4.398, p < 0.001, d = 0.429).
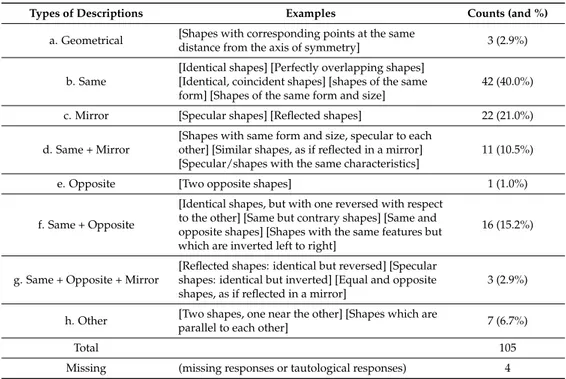
Table 1.The categories used to classify the definitions of symmetry produced by the participants in study 1 (in response to question 1). Examples of each type of description and the frequency of each category are presented.
Types of Descriptions Examples Counts (and %)
a. Geometrical [Shapes with corresponding points at the same
distance from the axis of symmetry] 3 (2.9%) b. Same
[Identical shapes] [Perfectly overlapping shapes] [Identical, coincident shapes] [shapes of the same form] [Shapes of the same form and size]
42 (40.0%)
c. Mirror [Specular shapes] [Reflected shapes] 22 (21.0%)
d. Same + Mirror
[Shapes with same form and size, specular to each other] [Similar shapes, as if reflected in a mirror] [Specular/shapes with the same characteristics]
11 (10.5%)
e. Opposite [Two opposite shapes] 1 (1.0%)
f. Same + Opposite
[Identical shapes, but with one reversed with respect to the other] [Same but contrary shapes] [Same and opposite shapes] [Shapes with the same features but which are inverted left to right]
16 (15.2%)
g. Same + Opposite + Mirror
[Reflected shapes: identical but reversed] [Specular shapes: identical but inverted] [Equal and opposite shapes, as if reflected in a mirror]
3 (2.9%)
h. Other [Two shapes, one near the other] [Shapes which are
parallel to each other] 7 (6.7%)
Total 105
Missing (missing responses or tautological responses) 4
(II) Prototypical representations
The following analyses was conducted on 76 of the first drawings and 75 of the second drawings (some of them are shown in Figure6). The other drawings were not considered either because they showed only one shape and not two as requested or because they were incorrect (i.e., they did not display symmetry). The latter was the case for 6 (i.e., 5.5%) of the drawings done as a first representation and 8 (i.e., 7%) of the drawings done as a second representation.
For all the variables considered in the following analyses, the assessment of the drawings was conducted by two independent judges, with inter-rater agreement ranging from very good (Cohen’s κ= 0.84) to excellent (Cohen’s κ = 0.94).
Symmetry 2017, 9, 128 9 of 21
= 0.601) but “Identical and Opposite” was also more frequently chosen as compared to exclusive references to Identicalness (EST = 1.250, SE = 0.284, z-ratio = 4.398, p < 0.001, d = 0.429).
Table 1. The categories used to classify the definitions of symmetry produced by the participants in
study 1 (in response to question 1). Examples of each type of description and the frequency of each category are presented.
Types of Descriptions Examples Counts (and %)
a. Geometrical [Shapes with corresponding points at the same distance
from the axis of symmetry] 3 (2.9%) b. Same
[Identical shapes] [Perfectly overlapping shapes] [Identical, coincident shapes] [shapes of the same form] [Shapes of the same form and size]
42 (40.0%) c. Mirror [Specular shapes] [Reflected shapes] 22 (21.0%) d. Same + Mirror
[Shapes with same form and size, specular to each other] [Similar shapes, as if reflected in a mirror]
[Specular/shapes with the same characteristics]
11 (10.5%) e. Opposite [Two opposite shapes] 1 (1.0%) f. Same + Opposite
[Identical shapes, but with one reversed with respect to the other] [Same but contrary shapes] [Same and opposite shapes] [Shapes with the same features but which are inverted left to right]
16 (15.2%)
g. Same + Opposite + Mirror
[Reflected shapes: identical but reversed] [Specular shapes: identical but inverted] [Equal and opposite shapes, as if reflected in a mirror]
3 (2.9%) h. Other [Two shapes, one near the other] [Shapes which are
parallel to each other] 7 (6.7%)
Total 105 Missing (missing responses or tautological responses) 4
(II) Prototypical representations
The following analyses was conducted on 76 of the first drawings and 75 of the second drawings (some of them are shown in Figure 6). The other drawings were not considered either because they showed only one shape and not two as requested or because they were incorrect (i.e., they did not display symmetry). The latter was the case for 6 (i.e., 5.5%) of the drawings done as a first representation and 8 (i.e., 7%) of the drawings done as a second representation.
For all the variables considered in the following analyses, the assessment of the drawings was conducted by two independent judges, with inter-rater agreement ranging from very good (Cohen’s κ = 0.84) to excellent (Cohen’s κ = 0.94).
Figure 6. Some of the drawings done by the participants as examples of their idea of symmetry (in
response to questions 2 or 3).
Figure 6.Some of the drawings done by the participants as examples of their idea of symmetry (in response to questions 2 or 3).
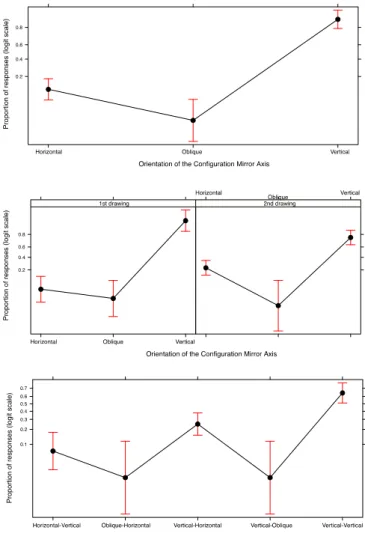
Mirror axis: vertical, horizontal or oblique? A GLMM was performed to analyze the orientation of the mirror axis in relation to the two drawings (first and second). A main effect of Orientation of the mirror axis emerged (χ2(2, 86)= 123.448, p < 0.0001). As shown in Figure7(top graph), participants more frequently drew configurations displaying a Vertical mirror axis than a Horizontal mirror
Symmetry 2017, 9, 128 10 of 21
axis (EST =−3.855, SE = 0.392; z-ratio = −9.843, p < 0.0001, d =−1.061), which in turn was more frequently used than an Oblique mirror axis (EST = 1.835, SE = 0.685, z-ratio = 2.678, p = 0.022, d = 0.288). As shown in the central graph in Figure7(which shows the interaction between Drawing and Orientation: χ2(2, 87)= 14.677, p = 0.0006), this distribution held for both the first and the second drawings. However, configurations displaying a horizontal mirror axis tended to be drawn more frequently in the second drawing as compared to the first (EST =−1.666, SE = 0.592; z-ratio =−2.816, p = 0.07, d = 0.274).
A combined analysis of the two drawings done by each participant was performed to determine whether the participants had used vertical axes in both drawings, horizontal axes in both drawings or had opted for a mixed solution. This allowed us to assess how robust the idea of a specific orientation of the mirror axis was in the participants’ minds. A combined GLMM was conducted on the mirror axes in Drawings 1 and 2 and the results are represented in the bottom graph in Figure7(χ2(4, 56)= 57.357, p < 0.0001). As confirmed by the post-hoc tests, the most frequent orientation was vertical in both the first and second drawings (EST = 3.152, SE = 0.58, z-ratio = 5.352, p < 0.0001, d = 0.715) despite the fact that participants had been explicitly told in the instructions that the second drawing should present a radically different example of symmetry to the first drawing.
Mirror axis: vertical, horizontal or oblique? A GLMM was performed to analyze the orientation of the mirror axis in relation to the two drawings (first and second). A main effect of Orientation of the mirror axis emerged (χ2(2, 86) = 123.448, p < 0.0001). As shown in Figure 7 (top graph), participants more frequently drew configurations displaying a Vertical mirror axis than a Horizontal mirror axis (EST = −3.855, SE = 0.392; z-ratio = −9.843, p < 0.0001, d = −1.061), which in turn was more frequently used than an Oblique mirror axis (EST = 1.835, SE = 0.685, z-ratio = 2.678, p = 0.022, d = 0.288). As shown in the central graph in Figure 7 (which shows the interaction between Drawing and Orientation: χ2(2, 87)
= 14.677, p = 0.0006), this distribution held for both the first and the second drawings. However, configurations displaying a horizontal mirror axis tended to be drawn more frequently in the second drawing as compared to the first (EST = −1.666, SE = 0.592; z-ratio = −2.816, p = 0.07, d = 0.274).
A combined analysis of the two drawings done by each participant was performed to determine whether the participants had used vertical axes in both drawings, horizontal axes in both drawings or had opted for a mixed solution. This allowed us to assess how robust the idea of a specific orientation of the mirror axis was in the participants’ minds. A combined GLMM was conducted on the mirror axes in Drawings 1 and 2 and the results are represented in the bottom graph in Figure 7
(χ2(4, 56) = 57.357, p < 0.0001). As confirmed by the post-hoc tests, the most frequent orientation was
vertical in both the first and second drawings (EST = 3.152, SE = 0.58, z-ratio = 5.352, p < 0.0001, d = 0.715) despite the fact that participants had been explicitly told in the instructions that the second drawing should present a radically different example of symmetry to the first drawing.
Figure 7. Effect plots of the Orientation of the mirror axis in the configurations drawn by participants. Top graph: Main effect of mirror axis Orientation. Central graph: interaction between mirror axis Orientation and Drawing. Bottom graph: Main effect of a combined analysis of the two drawings done by each participant. In all plots, error bars represent a 95% confidence interval.
Figure 7.Effect plots of the Orientation of the mirror axis in the configurations drawn by participants. Top graph: Main effect of mirror axis Orientation. Central graph: interaction between mirror axis Orientation and Drawing. Bottom graph: Main effect of a combined analysis of the two drawings done by each participant. In all plots, error bars represent a 95% confidence interval.
Symmetrical or asymmetrical shapes? The shapes in the drawings were classified according to whether they were symmetrical around both their vertical and horizontal axes (see the configurations in the top row in Figures4and6), asymmetrical with respect to both the vertical and horizontal axes (see the configurations in the third row in Figure4and in the third and fourth rows in Figure6) or symmetrical around one axis and asymmetrical with respect to the other (see the configurations in the second row in Figures4and6). As explained in the introduction of the study, when commenting on Figure4, the symmetry/asymmetry of the shape is relevant since opposition emerges only with shapes which are asymmetrical with respect to at least one axis.
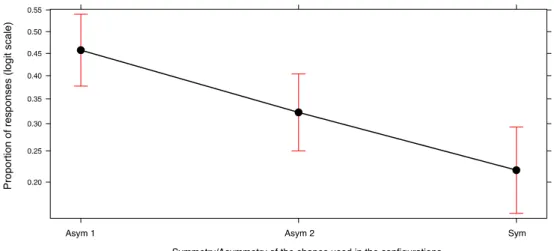
A GLMM was conducted to analyze the shapes in the two drawings according to the level of Symmetry/Asymmetry they displayed. The main effect of Symmetry/Asymmetry was confirmed (χ2(2, 86)= 17.758, p < 0.0001), with no interaction with Drawing (χ2(2, 86)= 2.412, p = 0.299). As shown in Figure8, the drawings were based on asymmetrical shapes in the majority of cases: asymmetrical shapes (either Asym 1 or Asym 2) constituted around 75% of the total, including both the first and second exemplars. Perfectly symmetrical shapes, i.e., shapes that minimized the opposition component, accounted for less than 25% of the configurations.
Post hoc tests revealed that participants had a preference for shapes which were symmetrical around one axis and asymmetrical around the other axis (i.e., Asym 1 in Figures4and8). This was more frequent than either perfectly symmetrical figures (EST = 1.113, SE = 0.264, z-ratio = 4.208, p < 0.0001, d = 0.453) or figures which were asymmetrical with respect to both the horizontal and vertical axes (EST = 0.600, SE = 0.248, z-ratio = 2.414, p < 0.05, d = 0.260).
Symmetry 2017, 9, 128 11 of 21
Symmetrical or asymmetrical shapes? The shapes in the drawings were classified according to whether they were symmetrical around both their vertical and horizontal axes (see the configurations in the top row in Figures 4 and 6), asymmetrical with respect to both the vertical and horizontal axes (see the configurations in the third row in Figure 4 and in the third and fourth rows in Figure 6) or symmetrical around one axis and asymmetrical with respect to the other (see the configurations in the second row in Figures 4 and 6). As explained in the introduction of the study, when commenting on Figure 4, the symmetry/asymmetry of the shape is relevant since opposition emerges only with shapes which are asymmetrical with respect to at least one axis.
A GLMM was conducted to analyze the shapes in the two drawings according to the level of Symmetry/Asymmetry they displayed. The main effect of Symmetry/Asymmetry was confirmed
(χ2(2, 86) = 17.758, p < 0.0001), with no interaction with Drawing (χ2(2, 86) = 2.412, p = 0.299). As shown in
Figure 8, the drawings were based on asymmetrical shapes in the majority of cases: asymmetrical shapes (either Asym 1 or Asym 2) constituted around 75% of the total, including both the first and second exemplars. Perfectly symmetrical shapes, i.e., shapes that minimized the opposition component, accounted for less than 25% of the configurations.
Post hoc tests revealed that participants had a preference for shapes which were symmetrical around one axis and asymmetrical around the other axis (i.e., Asym 1 in Figures 4 and 8). This was more frequent than either perfectly symmetrical figures (EST = 1.113, SE = 0.264, z-ratio = 4.208, p < 0.0001, d = 0.453) or figures which were asymmetrical with respect to both the horizontal and vertical axes (EST = 0.600, SE = 0.248, z-ratio = 2.414, p < 0.05, d = 0.260).
Figure 8. Effect plot of the use of symmetrical and asymmetrical shapes in the drawings done by the participants to exemplify their idea of a “symmetrical configuration” (Asym 2 = asymmetrical with respect to both the vertical and horizontal axes; Asym 1 = symmetrical around one axis and asymmetrical with respect to the other; Sym = symmetrical with respect to both the vertical and horizontal axes). Error bars represent a 95% confidence interval.
How were the shapes which were symmetrical around one axis (i.e., Asym 1) oriented with respect to the mirror axis? We analyzed the positioning of the shapes when they were symmetrical with respect to one axis and asymmetrical with respect to the other axis (i.e., Asym 1, see the configurations in the second row in Figures 4 and 6). We studied whether the opposite orientation of the shapes was manifested (i.e., with the symmetrical axis orthogonal to the mirror axis) or absent (i.e., with the symmetrical axis parallel to the mirror).
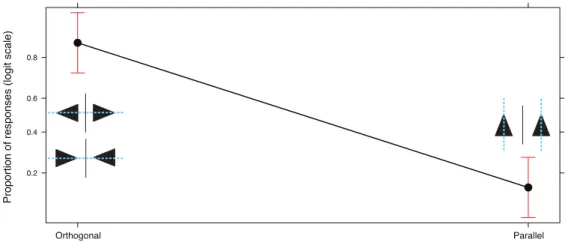
We performed another GLMM on the Orientation of the shapes (both the first and second Drawing) with respect to the Mirror axis (Parallel or Orthogonal). A main effect of Orientation emerged (χ2(1, 57) = 38.572, p < 0.0001). As shown in Figure 9, participants more frequently positioned the shapes with their internal axis of symmetry orthogonal with respect to the mirror axis rather than parallel to it (EST = 3.434, SE = 0.516, z-ratio = 6.657, p < 0.0001, d = 0.882). This means that they chose a configuration that made the opposite orientation of the two shapes evident.
Figure 8. Effect plot of the use of symmetrical and asymmetrical shapes in the drawings done by the participants to exemplify their idea of a “symmetrical configuration” (Asym 2 = asymmetrical with respect to both the vertical and horizontal axes; Asym 1 = symmetrical around one axis and asymmetrical with respect to the other; Sym = symmetrical with respect to both the vertical and horizontal axes). Error bars represent a 95% confidence interval.
How were the shapes which were symmetrical around one axis (i.e., Asym 1) oriented with respect to the mirror axis? We analyzed the positioning of the shapes when they were symmetrical with respect to one axis and asymmetrical with respect to the other axis (i.e., Asym 1, see the configurations in the second row in Figures4and6). We studied whether the opposite orientation of the shapes was manifested (i.e., with the symmetrical axis orthogonal to the mirror axis) or absent (i.e., with the symmetrical axis parallel to the mirror).
We performed another GLMM on the Orientation of the shapes (both the first and second Drawing) with respect to the Mirror axis (Parallel or Orthogonal). A main effect of Orientation emerged (χ2(1, 57)= 38.572, p < 0.0001). As shown in Figure9, participants more frequently positioned the shapes with their internal axis of symmetry orthogonal with respect to the mirror axis rather than
parallel to it (EST = 3.434, SE = 0.516, z-ratio = 6.657, p < 0.0001, d = 0.882). This means that they chose a configuration that made the opposite orientation of the two shapes evident.Symmetry 2017, 9, 128 12 of 21
Figure 9. Effect plot of the Orientation (Orthogonal or Parallel) of the internal axis of symmetry of the shapes drawn by participants with respect to the mirror axis. Two examples of orthogonal configurations are shown on the left and one example of parallel configuration is shown on the right. Error bars represent a 95% confidence interval.
A further GLMM was conducted to ascertain whether, in cases in which the two shapes pointed in a direction which was orthogonal to the mirror, the participants more frequently drew two shapes pointing away from the mirror axis (i.e., a divergent configuration) or two shapes pointing towards the mirror axis (i.e., a convergent configuration). No significant effect of Convergent/Divergent Orientation emerged, either as a main effect (χ2(1, 43) = 1.490, p < 0.222), or interacting with Drawing,
(χ2(1, 43) = 0.043, p = 0.835).
(III) Associations between verbal and iconic descriptions
We wondered whether there was an association between the descriptions given in answer to question 1 or selected from among alternatives in question 4 and the drawings. In particular, we wished to determine whether definitions which made reference exclusively to identicalness were associated with drawings showing shapes that maximized identicalness and minimized opposition (i.e., perfectly symmetrical shapes, i.e., Sym) and, conversely, definitions that mentioned an opposition component were associated with drawings showing asymmetrical shapes (i.e., Asym 1 and Asym 2).
We created a new three level variable labelled Iconic Pair to further classify the shapes in the drawings: (1) both shapes symmetrical (i.e., Sym); (2) both shapes asymmetrical (i.e., Asym 1 or Asym 2) and (3) mixed, i.e., one symmetrical (i.e., Sym) and the other asymmetrical (i.e., Asym 1 or Asym 2).
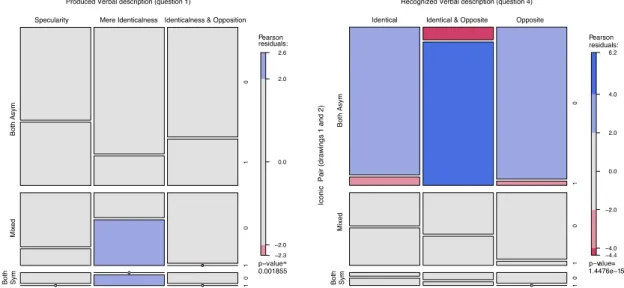
A first GLMM was carried out to determine whether there was any association between Iconic Pair levels and the responses to question 1 which had been re-coded according to three Categories: responses referring exclusively to identicalness (i.e., category b in Table 1); responses referring explicitly to Opposition (i.e., categories e + f + g in Table 1) and responses generically referring to a specular configuration, without mentioning opposition (categories c and d in Table 1). The interaction between the response categories in question 1 and the three Iconic Pair levels turned out to be significant (χ2(4, 57) = 9.353, p = 0.05). A second GLMM was then carried out to assess any association between the Iconic Pair levels and the responses to question 4 (Identical; Identical and Opposite; Opposite). In this case, too, the interaction between the responses to question 4 and the Iconic Pair levels turned out to be significant (χ2(4, 57) = 27.312, p < 0.0001).
We used mosaic plots to represent the association between the two variables [76–78]. A mosaic plot represents the observed frequencies of a contingency table by means of the size of the tiles; the interaction between variables by means of the asymmetrical non-alignment of the tiles and the significance of the difference between observed and expected frequencies according to a specific model (in our case a log-linear model of independence between variables) by means of the color of the tiles. The color of the tiles corresponds to Pearson residuals and the bars to the right of each mosaic
Figure 9. Effect plot of the Orientation (Orthogonal or Parallel) of the internal axis of symmetry of the shapes drawn by participants with respect to the mirror axis. Two examples of orthogonal configurations are shown on the left and one example of parallel configuration is shown on the right. Error bars represent a 95% confidence interval.
A further GLMM was conducted to ascertain whether, in cases in which the two shapes pointed in a direction which was orthogonal to the mirror, the participants more frequently drew two shapes pointing away from the mirror axis (i.e., a divergent configuration) or two shapes pointing towards the mirror axis (i.e., a convergent configuration). No significant effect of Convergent/Divergent Orientation emerged, either as a main effect (χ2(1, 43)= 1.490, p < 0.222), or interacting with Drawing, (χ2(1, 43)= 0.043, p = 0.835).
(III) Associations between verbal and iconic descriptions
We wondered whether there was an association between the descriptions given in answer to question 1 or selected from among alternatives in question 4 and the drawings. In particular, we wished to determine whether definitions which made reference exclusively to identicalness were associated with drawings showing shapes that maximized identicalness and minimized opposition (i.e., perfectly symmetrical shapes, i.e., Sym) and, conversely, definitions that mentioned an opposition component were associated with drawings showing asymmetrical shapes (i.e., Asym 1 and Asym 2). We created a new three level variable labelled Iconic Pair to further classify the shapes in the drawings: (1) both shapes symmetrical (i.e., Sym); (2) both shapes asymmetrical (i.e., Asym 1 or Asym 2) and (3) mixed, i.e., one symmetrical (i.e., Sym) and the other asymmetrical (i.e., Asym 1 or Asym 2).
A first GLMM was carried out to determine whether there was any association between Iconic Pair levels and the responses to question 1 which had been re-coded according to three Categories: responses referring exclusively to identicalness (i.e., category b in Table1); responses referring explicitly to Opposition (i.e., categories e + f + g in Table1) and responses generically referring to a specular configuration, without mentioning opposition (categories c and d in Table1). The interaction between the response categories in question 1 and the three Iconic Pair levels turned out to be significant (χ2(4, 57)= 9.353, p = 0.05). A second GLMM was then carried out to assess any association between the Iconic Pair levels and the responses to question 4 (Identical; Identical and Opposite; Opposite). In this case, too, the interaction between the responses to question 4 and the Iconic Pair levels turned out to be significant (χ2(4, 57)= 27.312, p < 0.0001).
We used mosaic plots to represent the association between the two variables [76–78]. A mosaic plot represents the observed frequencies of a contingency table by means of the size of the tiles;
the interaction between variables by means of the asymmetrical non-alignment of the tiles and the significance of the difference between observed and expected frequencies according to a specific model (in our case a log-linear model of independence between variables) by means of the color of the tiles. The color of the tiles corresponds to Pearson residuals and the bars to the right of each mosaic show which color corresponds to residuals greater than the cut-off points |2| (corresponding to α = 0.05).
As shown in Figure10, in the mosaic plot on the left, the responses to question 1 that mentioned only identicalness were more frequently associated with iconic representations that used symmetrical shapes (either in both the 1st and the 2nd drawings or in one of the two). Similarly, as shown in the mosaic plot on the right, those responses to question 4 that mentioned only identicalness were less frequently associated with iconic representations that used asymmetrical shapes in both the 1st and the 2nd drawings. Conversely an association emerged between using asymmetrical shapes in both the first and second drawings and selecting Identical and Opposite as the most fitting description in question 4.
Symmetry 2017, 9, 128 13 of 21
show which color corresponds to residuals greater than the cut-off points |2| (corresponding to α = 0.05).
As shown in Figure 10, in the mosaic plot on the left, the responses to question 1 that mentioned only identicalness were more frequently associated with iconic representations that used symmetrical shapes (either in both the 1st and the 2nd drawings or in one of the two). Similarly, as shown in the mosaic plot on the right, those responses to question 4 that mentioned only identicalness were less frequently associated with iconic representations that used asymmetrical shapes in both the 1st and the 2nd drawings. Conversely an association emerged between using asymmetrical shapes in both the first and second drawings and selecting Identical and Opposite as the most fitting description in question 4.
Figure 10. Mosaic plot showing the association between the three Iconic Pair levels relating to the shapes drawn by participants as exemplar configurations (in terms of symmetry/asymmetry) and the responses to question 1 (mosaic on the left) and question 4 (mosaic on the right).
3. Study 2
Study 2 was designed to further test (by means of a comparison task) the hypothesis that the phenomenal evidence of symmetry is more aligned with a perception of opposition in addition to identicalness, as compared to identicalness alone. Participants were asked to choose which of the two matched configurations better represented their idea of symmetry.
Various types of configurations and pair comparisons were presented in order to prevent participants from responding strategically (demand characteristics). In some cases, there were two configurations, both of which only showed evidence of identicalness; in other cases there were configurations that both showed evidence of identicalness and opposition and in another case the match was between a configuration which only showed identicalness and a configuration which showed both identicalness and opposition. The latter case was critical as it enabled us to test our hypothesis. If identicalness and opposition are the two salient components underlying the perception of symmetry, then the pairs showing opposition should be chosen over those showing only identicalness.
3.1. Materials and Method
3.1.1. Participants
70 undergraduate students of Psychology and Education at the University of Verona, Italy (mean age 23.8; 45 females; 25 males).
3.1.2. Materials
A 36-page booklet with each page containing two different configurations each consisting of a pair of shapes (the order of the pairs was randomized between participants and the order of the two configurations forming each pair was counterbalanced). Eight of the 36 pairs presented were catch trials and these consisted of a symmetrical configuration and a non-symmetrical configuration. They were introduced to check participants’ understanding of the task, but were then excluded from data analysis. The other pairs are shown in Figure11.
3.1. Materials and Method 3.1.1. Participants
70 undergraduate students of Psychology and Education at the University of Verona, Italy (mean age 23.8; 45 females; 25 males).
3.1.2. Materials
A 36-page booklet with each page containing two different configurations each consisting of a pair of shapes (the order of the pairs was randomized between participants and the order of the two configurations forming each pair was counterbalanced). Eight of the 36 pairs presented were catch trials and these consisted of a symmetrical configuration and a non-symmetrical configuration. They were introduced to check participants’ understanding of the task, but were then excluded from data analysis. The other pairs are shown in Figure 11.
Figure 11. The configurations used in the pair comparison task in study 2. The pairs inside the red borders are those instantiating a match between a configuration which shows only identicalness and another which shows both identicalness and opposition. The pairs inside the blue border are formed of two configurations both of which show identicalness and opposition. The configurations which are not inside a border are the pairs which are formed of two configurations, both of which only show identicalness.
Figure 11.The configurations used in the pair comparison task in study 2. The pairs inside the red borders are those instantiating a match between a configuration which shows only identicalness and another which shows both identicalness and opposition. The pairs inside the blue border are formed of two configurations both of which show identicalness and opposition. The configurations which are not inside a border are the pairs which are formed of two configurations, both of which only show identicalness.