DOI 10.1007/s11135-012-9734-z
Adapting football to the child: an application of the
logistic regression model in observational methodology
Javier Arana · Daniel Lapresa · María Teresa Anguera · Belén Garzón
© Springer Science+Business Media B.V. 2012
Abstract Logistic regression is included into the analysis techniques which are valid for observational methodology. However, its presence at the heart of this methodology, and more specifically in physical activity and sports studies, is scarce. With a view to highlighting the possibilities this technique offers within the scope of observational methodology applied to physical activity and sports, an application of the logistic regression model is presented. The model is applied in the context of an observational design which aims to determine, from the analysis of use of the playing area, which football discipline (7 a side football, 9 a side football or 11 a side football) is best adapted to the child’s possibilities. A multiple logistic regression model can provide an effective prognosis regarding the probability of a move being successful (reaching the opposing goal area) depending on the sector in which the move commenced and the football discipline which is being played.
Keywords Logistic regression· Observational methodology · Adapted football · Children Logistic regression models allow to assess the relationship between an identification var-iable—criteria variable—and one or several qualitative or quantitative predictor variables (Hidalgo and Gómez 2006;Herrera and Gómez 2008;Hellevik 2007). The analysis of the
J. Arana· D. Lapresa (
B
)Department of Educational Sciences, University of La Rioja, Edificio Vives, C/ Luis de Ulloa s/n, 26004 Logroño, La Rioja, Spain
e-mail: [email protected] J. Arana
e-mail: [email protected] M. T. Anguera
Department of Behavioural Sciences Methodology, Institute of Brain, Cognition and Behavior, University of Barcelona, Edifici de Ponent, Pg. Vall d’Hebron, 171, 08035 Barcelona, Spain e-mail: [email protected]
B. Garzón
IES Marqués de la Ensenada, C/ del Mazo, 11, 26200 Haro, Spain e-mail: [email protected]
relation between variables can be carried out (Silva and Barroso 2004) with estimative pur-poses—to what extent can the criterion variable be explained by the predictor variable(s), taking into account the presence of other factors—with predictive purposes—forecasting the value of the criterion variable depending on the different values which are adopted by the predictor variable(s).
Anguera et al.(2011), present logistic regression as a possible analysis technique in observational methodology for the type of data corresponding to the four quadrants of the observational designs: sequential and event-base; concurrent and event-base; sequential and time-base; concurrent and time-base.
Despite this, the studies which apply this logistic regression technique at the centre of observational methodology are still scarce (Garganta 1997;Casal 2009). This work aims to emphasise the possibilities this technique has in the scope of observational methodology applied to physical activity and sports. More specifically, aiming to study which football discipline, 9 a side football (F-9) or 11 a side football (F-11), is better adapted to provide continuity to the child’s practice after concluding the 11–12 year-old category, in which they practice the 7 a side football (F-7) discipline.
Starting from the importance given to the space factor in the development of the game (Castelo 2009), which seems to be key in the capacity to implement a technical-tactical task in an efficient and effective manner in Gréhaigne’s proposals (1998,2001), elevating the space factor to the level of functional indicative of the child’s level of expertise in the game; that is, the adaptation of football to the child.
In this research work we have resorted to a multiple logistic regression model to forecast the probability of a move being successful—reaching the opposing goal area—depending on the depth of the move—determined by the start sector—and by the discipline played.
1 Method
This research follows an observational methodology (Bakeman and Gottman 1986). The observational design we are going to use is, according toAnguera et al.(2001): point—three matches in each discipline (F-7, F-9 and F-11)—of monitoring between sessions—study-ing the behaviour in a continuous manner dursessions—study-ing the entire registry session, the match— nomothetic—three teams from the under-13’s category—and multidimensional—levels of proxemic response (the spatial performance of the observed team while playing the game) and gestural (the way in which the actions that lead to the start and conclusion of the move are specified). The level of participation is that of non-participative observation; the observation carried out is active; and the degree of perceptivity is complete—direct observation.
1.1 Participants
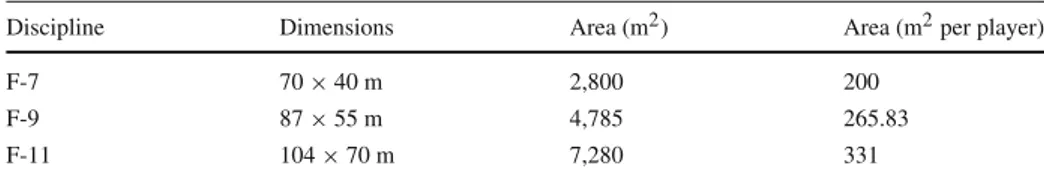
The data which supports this work includes the total number of moves (n = 1, 142) played within a triangular tournament, in three football disciplines. The players which comprise the teams (boys who turn 12 years old during this year) have never taken part in feder-ated competitions corresponding to the F-11 discipline—which is not applicable for them due to their age—or to the F-9 discipline—as this is an intermediate discipline which, on the day of the tournament, is not yet established—Each match lasted for 30 min. Table1
shows the measurements corresponding to the playing field in each of the disciplines played.
Table 1 Dimensions, surface area and surface area per player of the playing field for each football discipline
Discipline Dimensions Area (m2) Area (m2per player)
F-7 70× 40 m 2,800 200
F-9 87× 55 m 4,785 265.83
F-11 104× 70 m 7,280 331
Table 2 Structure of the observational tool
No. Criterion Categories
1 Move number Field format: 1, 2, 3, 4, 5, 6, etc.
2 Action commencement area (CA) CA10, CA20, CA30, CA40, CA50, CA60, CA41, CA51, CA61, CA70, CA80, CA90
3 Move conclusion area (EA) EA10, EA20, EA30, EA40, EA50, EA60, EA41, EA51, EA61, EA70, EA80, EA90
4 Development of the move (ZD) Field format: referring to the ball’s path through the different areas of the field
5 Area of occasional interception by a rival (OIA) OIA10, OIA20, OIA30, OIA40, OIA50, OIA60, OIA41, OIA51, OIA61, OIA70, OIA80, OIA90 6 Way in which the move starts Recovery (R); goal kick (GK); throw-in (TI); corner
kick (CK); free kick (FK); penalty (P); kick-off (KO); drop-ball (BDB)
7 Way in which the move concludes Interception (I); out in penalty area (OP); out over the far line (OF); foul (F); out over a touchline (OT); goal (G); drop-ball (CDB)
1.2 Observational tool
An observational tool has been designed which allows analysis of the spatial path of the ball on the playing field. Table2includes a diagram description of the tool’s criteria.
Image1shows the zoning of the field used for the matches. Adding that in order to analyse the depth of the game, the different zones of the playing field have been merged cross ways, obtaining four sectors: safety, creation own area, creation opposing area and definition. 1.3 Recording tool
For recording and coding the data we have used the software programme SDIS-GSEQ ( Bake-man and Quera 1995). More specifically, we have designed a template which has been adapted to the SDS encoding syntax (Bakeman and Quera 2011), including all of the constituting cri-teria of the observational tool.
In accordance withAnguera et al.(2011), and taking into account Bakeman’s classical proposal (1978), this data is of type II, concurrent and event-base. On the other hand, if we take into account the type of data provided byBakeman and Quera(1995), with regard to computerised encoding, the data are multi-event as they have been proposed in a multidi-mensional design and they use the combination of field format and categories system as an observational tool, which has actually been built based on these dimensions established in the observational design.
Spatial sense of the attack Left Safety area (Zone 10) Left Creation area own area (Zone 40) Left Definition area (Zone 70) Centre Definition area (Zone 80) Right Definition area (Zone 90) Centre Creation area own area (Zone 50) Right Creation area own area (Zone 60) Centre Safety area (Zone 20) Right Safety area (Zone 30) Left Creation area opposing area (Zone 41) Centre Creation area opposing area (Zone 51) Right Creation area opposing area (Zone 61)
Image 1 Zoning of the playing field
1.4 Quality of the data
A procedure has been developed for training observers in accordance with the approach set forth inAnguera(2003). Two recordings have been carried out: (a) the first one has been done in agreement (Anguera 1990) by a group of three observers; (b) carried out by one single observer.
Using the SDIS-GSEQ software package, we have obtained a degree of reliability, in the shape of concordance, by means of Cohen’s Kappa coefficient (1960) of: 0.84 for the F-7 discipline; 0.73 for the F-9 discipline; and 0.79 for the F-11 discipline. According to the reference values byLandis(1977), the agreement consideration is almost perfect, for F-7 and substantial, for F-9 and F-11.
Additionally, to guarantee the quality of the data, we have made use of the Generalizability theory (Cronbach et al. 1972). FromBlanco et al.(2000) andCastellano et al.(2009), using the Generalizability Theory software (Ysewijn 1996), we have made two different designs at the centre of the Generalised Linear Model (GLM), of which we have selected the type II data as the data has not been gathered in a random manner. With regard to the design: categories and matches, C/M, the analysis of the generalizability coefficients determines the achievement of a generalizability precision reliability of e2= 0.99; while the categories and teams design, C/T, obtains e2 = 0.97. These results allow us to assess the constancy of the matches played by the teams which have been taken into consideration within this research work.
1.5 Logistic regression
As the criterion variable is dichotomic (the move concludes or does not conclude in zone 80) and there being more than one predictor variable (sector in which the move starts and dis-cipline), we have resorted to a multiple logistic regression model which is presented below:
P (Y ), the probability of a specific event occurring; e, Euler’s constant; Xi(i = 1, 2, . . ., k),
the predictor variables;β0, the model’s constant;βi(i = 1, 2, . . ., k), the logistic regression
coefficients.
P(Y) = 1
1+ e−(β0+β1X1+β2X2+β3X3+···+βkXk)
Given that the predictor variables are two absolute variables with more than two categories (Sector: Safety, Creation Own Area, Creation Opposing Area and Definition; and Discipline: F-7, F-9 and F-11), have transformed into dichotomised dummy variables. The exponential of the coefficient corresponding to the dummy variables estimates the magnitude by which the risk of the event occurring varies, comparing this category with the reference category. For our logistic regression model, the Definition Sector has been used as a reference category in relation to the variable of the Sector in which the Move Starts; while, for the Discipline variable, the reference category has been the F-7 discipline.
2 Results
To determined the possible relation between the criterion variable (Success of the move) and the predictor variables (Sector in which the Move Starts and Disciplines), given that the vari-ables are categorical (Nevill et al. 2002), we have resorted to using Pearson’s chi-squared test
(χ2). The χ2obtained point out that the predictor variables Sector in which the Move Starts
(p ≤ 0.001) and Discipline (p = 0.020), maintain a significant relation with the criterion variable: Success.
Subsequently, discarding the multicolinearity as of obtaining the contingency coefficient (0.122) between the predictor variables Sector in which the Move Starts and Discipline. Also discarding the confusion and interaction between variables.
With the aim to detect which variables may be included into the logistic regression model with a predictive purpose and estimate the degree of relation there is between the criterion variable and the predictor variables, the following procedures have been used in the analysis: introduce, forward and backward of estimation per maximum verisimilitude. In the three cases, the results obtained—the same—include the following variables in the logistic regres-sion model: Safety Sector, Own Area Creation Sector, Opposing Area Creation Sector; and the F-11 discipline. Table3shows the estimated results for the coefficients of model—B and the Exp(B)—along with their significance levels and confidence interval.
In relation to its capacity for discrimination, the logistic regression model developed accu-rately forecasts 75 % of the analysed cases. Also obtaining a 10 % sensitivity—the model’s probability of predicting whether the move is successful when it has actually been a success— and a 96.2 % specificity—the model’s probability for predicting that the move is unsuccessful when it has actually been unsuccessful.
In order to assess the goodness of fit of the logistic regression model (Hagquist and Stenbeck 1998), we have resorted to the goodness of fit contrast byHosmer and Lemeshow
(1989). The results obtained highlight the absence of significant differences (p = 0.893) between the expected values and the observed values.
Next, we move on to the estimation process based on the logistic regression model we have built. If the sign of B is positive, this informs us that this particular variable favours the appearance of the event—in our case this favours the move concluding successfully—and we will obtain an Exp(B) higher than 1. In the event of the B sign being negative, we interpret
Table 3 Estimated results for the coefficients of model: B and the Exp(B), significance levels and confidence intervals
B Significance Exp(B) I.C. 95.0 % for Exp(B) Inferior Superior
Sector 0.000
Safety –1.682 0.000 0.186 0.127 0.272
Creation own area –1.079 0.000 0.340 0.225 0.513
Creation opposing area –0.529 0.012 0.589 0.391 0.888
Discipline 0.004
Football 9 –0.145 0.391 0.865 0.620 1.205
Football 11 –0.590 0.001 0.554 0.389 0.791
Constant 0.060 0.732 1.062
Table 4 Probability of success of a move based on the predictor variables
Relation between predictor variables Forecast success
probability If a move, corresponding to the F-9 discipline, starts in the Safety Sector 0.2267 If a move, corresponding to the F-9 discipline, starts in the Own Area Creation Sector 0.3489 If a move, corresponding to the F-9 discipline, starts in the Opposing Area Creation Sector 0.4815 If a move, corresponding to the F-11 discipline, starts in the Safety Sector 0.1582 If a move, corresponding to the F-11 discipline, starts in the Own Area Creation Sector 0.2556 If a move, corresponding to the F-11 discipline, starts in the Opposing Area Creation Sector0.3731
that a specific variable reduces the probability of success occurring, by which the value of Exp(B) is lower than 1.
With regard to the Start Sector variable, the probability of a move concluding in Area 80 is, in relation to the Definition Sector: 81.4 % lower if it has started in the Safety Sector; 66 % lower if it started in the Own Area Creation Sector; and 41.1 % lower if it started in the
Opposing Area Creation Sector.
In relation to the Discipline variable, the probability of a move concluding in Zone 80 is 44.6 % lower in the F-11 discipline than in the F-7 discipline. There is no statistically significant relationship between theF -7 and F -9 disciplines.
Lastly, with regard to prediction, Table4 shows the success probability of the move, depending on the different values adopted by the predictor variables.
3 Discussion and conclusions
A multiple logistic regression model has been built with a view to determine the probability of a move being successful (reaching the area which houses the opposing goal) depending on the sector in which the move commenced and the football discipline which is being played. The results obtained conclude that the F-7 discipline is the one in which the player of the studied age (children turning 12 years-old during this year) shows the most spatial competi-tion—capacity to generate progression in the game. This statement is in line with the studies
byCarvalho and Pacheco(1990) andPacheco(2007), for the age group comprised between 8 and 12 years; and byCosta and Garganta(1996),Ardá(1998),Ardá and Anguera(2000) andVegas(2006), for the 11–12 year-olds who, without taking into account other football disciplines, compare between F-7 and F-11.
Additionally, the logistic regression model built indicates the increased quality of the F-9 discipline, in relation to the F-11 discipline. This improved adaptation of the F-9 discipline for the studied age coincides with the conclusions set forth byArana et al.(2004) andLapresa et al.(2006).
In conclusion, the fact that the maintenance of the F-7 discipline, as well as the introduc-tion of the F-9 discipline, are better adapted proposals than the F-11 discipline, which is the discipline currently played by children in the 12–13 age group. This way, playing the F-7 and F-9 discipline, with a smaller playing field and less players than the F-11 discipline, must be seen as an opportunity to adapt the game to the child’s characteristics and not as a distortion of the adults’ sports game (Malina 2001;Federazione 2008).
With this work, we have managed to effectively apply logistic regression to observa-tional methodology; highlighting the possibilities this analysis technique offers from the dichotomies which, at a sporting level, obtain special relevance, such as: success/failure; adaptation/non-adaptation; correct/incorrect; timely/untimely.
References
Anguera, M.T.: Metodología observacional. In: Arnau, J., Anguera, M.T., Gómez J, J. (eds.) Metodología de la investigación en Ciencias del Comportamiento, pp. 125–238. Universidad de Murcia, Murcia (1990) Anguera, M.T.: La observación. In: Moreno, C. (ed.) Evaluación psicológica. concepto, proceso y aplicación
en las áreas del desarrollo y de la inteligencia, pp. 271–308. Sanz y Torres, Madrid (2003)
Anguera, M.T., Blanco, A., Losada, J.L.: Diseños observacionales, cuestión clave en el proceso de la metod-ología observacional. Metodo. Cienc. Comport. 3, 135–161 (2001)
Anguera, M.T., Blanco, A., Hernández, A., Losada, J.L.: Diseños observacionales: ajuste y aplicación en psicología del deporte. Cuad. Psicol. Deport. 11(2), 63–76 (2011)
Arana, J., Lapresa, D., Garzón, B., Álvarez, A.: La alternativa del fútbol 9 para el primer año de la categoría infantil. Universidad de La Rioja, Logroño (2004)
Ardá, A.: Análisis de patrones en fútbol a 7 (Doctoral thesis). Facultad de Ciencias del Deporte y la Educación Física, Universidad de La Coruña, La Coruña (1998)
Ardá, T., Anguera, M.T.: Evaluación prospectiva en programas de entrenamiento de fútbol a 7 mediante indicadores de éxito en diseños diacrónicos intensivos retrospectivos. Psicothema 12(2), 52–55 (2000) Bakeman, R.: Untangling streams of behavior: sequential analysis of observation data. In: Sackett,
G.P. (ed.) Observing Behavior, Vol. 2: Data Collection and Analysis Methods, pp. 63–78. University of Park Press, Baltimore (1978)
Bakeman, R., Gottman, J.M.: Observing Interaction: An Introduction to Sequential Analysis. Cambridge University Press, New York (1986)
Bakeman, R., Quera, V.: Analyzing Interaction: Sequential Analysis with SDIS and GSEQ. Cambridge Uni-versity Press, Cambridge (1995)
Bakeman, R., Quera, V.: Sequential Analysis and Observational Methods for the Behavioral Sciences. Cam-bridge University Press, CamCam-bridge (2011)
Blanco, A., Castellano, J., Hernández, A.: Generalizabilidad de las observaciones en la acción del juego en el fútbol. Psicothema 12(Supl. 2), 81–86 (2000)
Carvalho, J., Pacheco, R.: Ensino do futebol: futebol de 11 ou futebol de 7. Horiz 5(25), 7–11 (1990) Casal, C.A.: Análisis observacional de la fase ofensiva del fútbol de alto nivel (Doctoral thesis). Facultad de
Ciencias del Deporte y la Educación Física, Universidad de La Coruña, La Coruña (2009)
Castellano, J., Perea, A., Blanco, A.: Has soccer changed in the last three World Cups?. In: Reilly, T., Korkusuz, F. (eds.) Science and Football VI, pp. 167–170. Routledge, London (2009)
Castelo, J.: Futebol. Organizaçao dinámica do jogo. Universidade Lusófona de Humanidades e Tecno-logías, Lisboa (2009)
Costa, J., Garganta, J.: Análise comparativa de algumas situaçoes de jogo de futebol das crianças e dos adultos in estudos. FCDEF-UP, Porto (1996)
Cronbach, L.J., Gleser, G.C., Nanda, H., Rajaratnam, N.: The Dependability of Behavioral Measurements: Theory of Generalizability for Scores and Profiles. Wiley, New York (1972)
Federazione Italiana Giuoco Calcio: Guida tecnica per le scuole di Calcio. (Settore Giovanile e Scolasti-co, Roma 2008)
Garganta, J.: Modelaçao táctica do jogo de futebol. Estudo da organizaçao da fse ofensiva em equipas de alto rendimento (Doctoral thesis). Faculdade de Desporto, Universidade do Porto, Porto (1997)
Gréhaigne, J.F.: Game systems in soccer from the point of view of coverage of space. In: Reilly, T. (ed.) Science and Soccer, pp. 316–321. E. and F.N. Spon, London (1998)
Gréhaigne, J.F.: L’organization du jeu en football. Editions Actio, Joinville-le-Pont (2001)
Hagquist, C., Stenbeck, M.: Goodness of fit in regression analysis—R2 and G2 Reconsidered. Qual. Quant. Int. J. Methodol. 32(3), 229–245 (1998)
Hellevik, O.: Linear versus logistic regression when the dependent variable is a dichotomy. Qual. Quant. Int. J. Methodol. 43(1), 59–74 (2007)
Herrera, A.N., Gómez, J.: Influence of equal or unequal comparison group sample sizes on the detection of differential item functioning using the Mantel–Haenszel and logistic regression techniques. Qual. Quant. Int. J. Methodol. 42(6), 739–755 (2008)
Hidalgo, M.D., Gómez, J.: Nonuniform DIF detection using discriminant logistic analysis and multino-mial logistic regression: a comparison for polytomous items. Qual. Quant. Int. J. Methodol. 40(5), 805–823 (2006)
Hosmer, D.W., Lemeshow, S.: Applied Logistic Regression. Wiley, New York (1989)
Landis, J.R., Koch, G.G.: The measurement of observer agreement for categorical data. Biometrics 33, 159–174 (1977)
Lapresa, D., Arana, J., Garzón, B.: El fútbol 9 como alternativa al fútbol 11, a partir del estudio de la utilización del espacio de juego. Apunt. Educ. Fis. Deport. 86, 34–44 (2006)
Malina, R.: Youth football players: perspectives from growth and maturation. Insight F. A. Coach. Assoc. J. 1(5), 27–31 (2001)
Nevill, A.M., Balmer, N.J., Williams, M.A.: The influence of crowd noise and experience upon refereeing decisions in football. Psychol. Sport. Exerc. 3, 261–272 (2002)
Pacheco, R.: Fútbol: la enseñanza y el entrenamiento del fútbol 7. Paidotribo, Barcelona (2007) Silva, L.C., Barroso, I.M.: Regresión Logística. La Muralla, Salamanca (2004)
Vegas, G.: Metodología de enseñanza basada en la implicación cognitiva del jugador de fútbol base (Doctoral thesis). Facultad de Ciencias de la Actividad Física y el Deporte, Universidad de Granada, Granada (2006)