ASSESSMENT OF COLOR ADSORPTION BY YEAST
USING GRAPE SKIN AGAR AND IMPACT ON RED WINE COLOR
Andrea CARIDI1, Rossana SIDARI1*, Lucia KRAKOVÁ2, Tomáš KUCHTA3and Domenico PANGALLO2
1: Department of Agraria, “Mediterranea” University of Reggio Calabria, Via Feo di Vito, 89122 Reggio Calabria, Italy
2: Institute of Molecular Biology, Slovak Academy of Sciences, Dúbravská cesta 21, 84551 Bratislava, Slovakia 3: Department of Microbiology, Molecular Biology and Biotechnology, Food Research Institute,
Priemyselná 4, 82475 Bratislava, Slovakia
Aim: Evaluating Saccharomyces cerevisiae strains for their color adsorption aptitude by using Grape Skin Agar in order to protect the phenolic compounds responsible for the color of red wines; proposing a suitable and innovative medium to be included among the tests currently used for wine strain selection.
Methods and results : The strains were identified by fluorescence-Internal transcribed spacer (f-ITS) PCR and PCR-Restriction fragment length polymorphism (RFLP), confirmed by sequencing of ITS fragment, and tested for the parameter “aptitude to adsorb polyphenolic compounds” on the innovative chromogenic medium Grape Skin Agar. Laboratory-scale fermentations were carried out in must with and without SO2. The SO2
determined a decrease in tint, color intensity, and total polyphenol content. The strains M2V CHU7 and M2F CHU9 produced wines with the lowest color intensity, with and without SO2, respectively. By contrast, the strains M2F
VUP4 and M2V CHU1, with and without SO2,
respectively, produced wines with the highest color intensity, and therefore, they could improve the production of red wines.
Conclusion: The study highlights great variability and significant differences among strains in regard to their aptitude to modulate wine color. Grape Skin Agar should be a useful medium to be included in the selection tests currently performed for S. cerevisiae strains.
Significance and impact of the study: Our study confirms that yeast strains can modulate the chromatic properties of red wines according to their aptitude to adsorb polyphenols, as tested on Grape Skin Agar. Combining colored polyphenolic compound adsorption assay on Petri plate and laboratory-scale fermentation trials provides an effective way to test yeasts for their capability to improve the chromatic quality of the wines.
Key words : Saccharomyces cerevisiae, wine color, adsorption on Grape Skin Agar, polyphenols
Objectif : Évaluer des souches de Saccharomyces cerevisiae pour leur aptitude à adsorber les composés phénoliques responsables de la couleur des vins rouges en utilisant Grape Skin Agar; proposer un milieu approprié et innovant à inclure parmi ceux actuellement utilisés pour la sélection de souches de vin.
Méthodes et résultats: Les souches ont été identifiées par fluorescence-Espaceur interne transcrit (f-ITS) PCR et Polymorphisme de longueur des fragments de restriction (RFLP)-PCR, confirmées par séquençage du fragment ITS et testées pour le paramètre “aptitude d’adsorption des composés polyphénoliques” sur le milieu chromogène Grape Skin Agar. Des fermentations, à échelle du laboratoire, ont été effectuées en présence ou en absence de SO2dans le moût. Le SO2détermine la diminution de la
teinte, de l’intensité de la couleur et de la teneur totale en polyphénols. Les souches M2V CHU7 et M2F CHU9, respectivement avec et sans SO2, ont produit les vins avec
l’intensité de la couleur la plus faible. Les souches M2F VUP4 et M2V CHU1, respectivement avec et sans SO2,
ont quant à elles produit les vins les plus colorés et elles pourraient donc améliorer la production de vins rouges. Conclusion : L’étude met en évidence une grande variabilité et des différences significatives entre les souches en ce qui concerne leur aptitude à moduler la couleur du vin. Grape Skin Agar est un outil efficace qu’il convient d’inclure dans les tests de sélection actuellement effectués pour les souches de S. cerevisiae.
Signification et impact de l’étude: Notre étude confirme que les souches de levure peuvent moduler les propriétés chromatiques des vins rouges en relation avec leur aptitude à adsorber les polyphénols, testée sur Grape Skin Agar. La combinaison du test Grape Skin et des essais de fermentation à échelle réduite est un moyen efficace pour tester les levures vis-à-vis de leur capacité à améliorer la qualité chromatique des vins.
Mots clés : Saccharomyces cerevisiae, couleur du vin, adsorption sur Grape Skin Agar, polyphénols
INTRODUCTION
Nowadays, the use of wine yeasts autochthonous of the area of production is generally well established. Several authors have reported about the use of autochthonous yeast strains to improve wine quality and maintain the peculiarities of the wine producing region (Raspor et al., 2006; Callejon et al., 2010). The selection of wine Saccharomyces cerevisiae is usually based on parameters that affect the quality of wine and the technological process to produce wine (Giudici and Zambonelli, 1992). Also, the selection has to be carried out for novel characters such as the ability to enhance wine color and polyphenolic content, increasing its quality and healthiness (Caridi and Sidari, 2009). Polyphenols are an important family of compounds present in grape skin and wine (Poudel et al., 2008), where they affect the color, the astringency, and the antioxidant properties. Wine color is one of the most important parameters that influence consumer acceptance; consumer expecta-tion varies according to the type of wine, e.g., a deep and intense red for a red wine or a sparkling and clear yellow without residual color for a white wine. Therefore, the goal is to maintain/protect the colored polyphenols (red wines) or decrease them (white wines). Together with the acetaldehyde and pyruvic acid produced during alcoholic fermentation (Morata et al., 2003a), the pectinolytic enzymes (Hernández et al., 2003) and the presence of SO2(Morata et al.,
2006), yeasts contribute to the wine’s final chromatic properties.
In fact, the percentage of negative charges in the yeast cell wall confers to the strains its adsorption ability towards the polyphenols present in wine (Caridi, 2006). Morata et al. (2003b) reported the role played by yeast cell walls in anthocyanin adsorption and the chemical interaction between yeast and polyphenols. To assess the yeast aptitude to adsorb polyphenols during fermentation, a method (Caridi et al., 2007; Caridi, 2013) based on the color observa-tion of the yeast biomass grown on the chromogenic medium Grape Skin Agar (GraSki) has been developed and optimized at the laboratory of Microbiology of Reggio Calabria, Italy. Obviously, in the production of a high quality red wine the strain to select has to possess low polyphenolic adsorption ability so as not to adsorb the polyphenols responsible for the color. An important step before the selection process is the identification of the strains isolated. Recently, Chovanová et al. (2011) contributed a three-step molecular method as a useful and reliable tool for identification of certain yeasts.
The aim of this work was to evaluate S. cerevisiae strains for their color adsorption aptitude by combining the assay on GraSki with laboratory-scale fermentations in order to protect the phenolic compounds responsible for the color of red wines, thereby improving their quality as well as proposing a suitable and innovative tool to be included among the tests currently used for wine strain selection (not performed in this work).
MATERIALS AND METHODS
During the 2011 and 2012 grape harvest, a total of 419 yeast isolates were obtained. Sampling was performed from grape and must samples of the varieties Frankovka modra (Blaufränkisch) and Veltlinske zelene (Grüner Veltliner) from the Small Carpathians area. Each sample was spread on YPD (yeast extract 10 g/L, peptone from casein 10 g/L, dextrose 20 g/L, and agar 15 g/L) and incubated for 3-5 days at 25 °C. Then, the colonies were microscopically observed and tested on acetate agar (sodium acetate anhydrous 1 g/L and agar 20 g/L) at 25 °C for 10 days to chose the strains producing spores typical of the Saccharomyces genus before performing the molecular tests.
1. Identification of yeast species
The f-ITS (fluorescence-Internal transcribed spacer) approach and ITS sequencing were carried out using the protocols proposed by Kraková et al. (2012). The restriction fragment length polymorphism of ITS fragment (ITS PCR-RFLP) was performed using 0.6 pmol of each primer ITS1 (TCCGTAGGTGAACCT-GCGG) and ITS4 (TCCTCCGCTTATTGATATGC) in 25 μL PCR volume including 1.5U Taq polymerase (Gene Craft, Köln, Germany), 1x reaction buffer for DNA polymerase with 15 mM MgCl2 (Gene Craft, Köln, Germany), and 0.20 mM
of each dNTP. The PCR program was as follows: 1 min at 95 °C, 35 cycles of 1 min at 95 °C, 1 min at 54 °C and 1.5 min at 72 °C, and final polymerization at 72 °C for 10 min. The amplicons obtained were digested with HaeIII, HhaI, and HinfI restriction enzymes (New England Biolabs, Ipswich, USA) for 3 h at 37 °C in 15 μL restriction volume including 1x reaction buffer for HaeIII, 1x reaction buffer and 10x BSA for HhaI, 1x reaction buffer with BSA for HinfI, 5U of each restriction enzyme, and 5 μL of the PCR products from ITS1/ITS4 amplification. All restriction enzyme reactions were visualized on 20 g/L agarose gel stained with ethidium bromide.
2. Grape Skin Agar (GraSki) test
Fifty S. cerevisiae strains (44 Slovakian and 6 Calabrian) were tested for their aptitude to adsorb polyphenolic compounds on improved GraSki agar (dried grape skin 60 g/L, citric acid monohydrate 50 g/L, disodium hydrogen phosphate 25 g/L, dextrose 20 g/L, casein peptone 7.5 g/L, yeast extract 4.5 g/L, and agar 20 g/L – separately sterilized) and analyzed by a sequent biomass color imaging processing strategy (Caridi, 2013). Briefly, 10 µL of strain biomass, previously grown at 28 °C for 2 days on YPD agar, was taken using a sterile loop and spread on GraSki and YPD agar (as control medium). After anaerobic incubation at 28 °C for 10 days, the biomass was carefully mixed using a sterile loop, and 10 µL of the biomass was taken and photographed. The images were processed for Red (R), Green (G), and Blue (B) analysis by Photoshop CS for Windows XP from Adobe taking four points for each component. Each R, G, and B component ranges from 0 (black) to 255 (white). Higher R, G, and B values correspond to a low adsorption aptitude -white biomass color ; lower R, G, and B values correspond to a high adsorption aptitude - dark brown biomass color. To have a comprehensive picture of the behavior of the strains, the sum of R, G, and B of the four values obtained with Photoshop for each strain (R+G+B) was also considered. The strains were stored at -85 °C using the Protect system (KAIROSAFE, Italy) until the laboratory-scale fermentations.
3. Laboratory-scale fermentations
The 50 strains were characterized by laboratory-scale fermentations with or without the addition of SO2
(100 mg/L). Must from black grapes was obtained after 3 days of cryomaceration at 4 °C in contact with skins and seeds, divided in aliquots of 100 mL, pasteurized (110 °C x 10 minutes) with or without SO2, inoculated with pre-cultures of the strains, and
incubated at 25 °C. The loss of carbon dioxide was followed by weighting the samples. At the end of fermentation, wines were centrifuged at 4,500 rpm for 5 min and analyzed for the following parameters: alcoholic content by Malligand ebulliometer; color by measuring the absorbance at 420-nm (yellow component), 520-nm (red component), and 620-nm (blue components) - using an Anadeo1 spectrophotometer (Bibby Sterilin Ltd) ; color intensity (I) and tint (T) calculated with the following formulas: I = A420 + A520 + A620 and T = A420: A520, respectively ; and Folin-Ciocalteu’s Index (FCI) according to Singleton and Rossi (1965). From the data at 420-, 520-, and 620-nm, the percentage of
yellow (% Y), red (% R), and blue (% B) of the wines was calculated. The wine color and FCI analyses were performed in triplicate.
4. Statistical analysis
Data were subjected to statistical analysis using StatGraphics Centurion XVI for Windows XP from StatPoint according to Fisher’s Least Significant Difference analysis (P < 0.05).
RESULTS 1. Yeast strain identification
Fifty S. cerevisiae strains, chosen for their S. cerevisiae appearance on acetate agar, displayed the same f-ITS profile including two peaks with a size of 380 bp and 415 bp. They had the same typical ITS PCR products: HaeIII produced 4 bands with sizes around 120, 170, 220 and 300 bp; HhaI produced 3 bands of 120, 340 and 360 bp; and HinfI produced 2 bands of 110 and 360 bp. The RFLP profiles are in accordance with those of S. cerevisiae isolates from wine and from other fermented foods (Esteve-Zarzoso et al., 1999; Pulvirenti et al., 2004; Nisiotou et al., 2007). The result was confirmed by sequencing of the ITS fragment amplified for 18 isolates. These results highlighted the usefulness of the f-ITS PCR for easy identification of S. cerevisiae strains, validating the findings of recent studies (Chovanová et al., 2011; Kraková et al., 2012). In fact, the f-ITS approach, based on a simple PCR assay, was able to discriminate S. cerevisiae members from a complex population of isolated yeasts.
2. Yeast strain characterization on GraSki
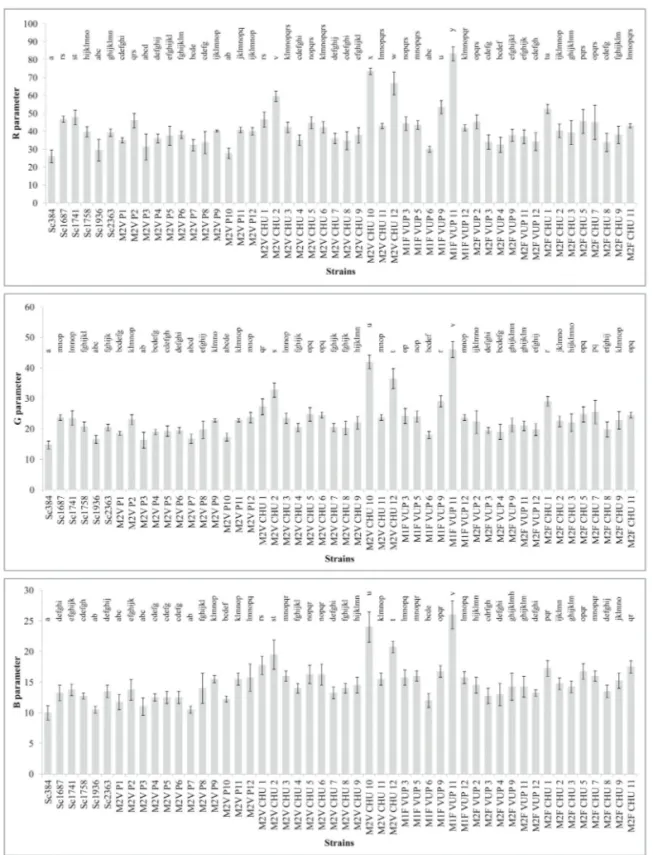
Concerning the strain aptitude to adsorb colored polyphenolic compounds on GraSki (figure 1), the strain Sc384, which exhibited biomass darker than the other strains, adsorbed more colored compounds from the medium (low R, G, and B values), while the opposite behavior (high R, G, and B values) was observed for the strain M1F VUP 11, which exhibited lighter biomass. The strains were distributed in 25 homogeneous groups for red (R) and 22 for green (G) and blue (B) values (a homogeneous group defined as a group of means within which there are no statistically significant differences). On YPD agar the strains exhibited higher color parameter values, which means lighter biomass color, than those observed on GraSki. The R value ranged from 101 to 160, the G value from 82 to 139, and the B value from 41 to 82 (data not shown). This was expected due to the fact that in the formulation of YPD there are no colored
polyphenolic compounds to be adsorbed by yeasts, as opposed to the GraSki medium. So, in the first case the yeast biomass was creamy in color, while in the second case its color ranged from brown to deep red. Summing up the R, G, and B values (R+G+B) allowed us to rapidly identify the adsorption aptitude of a strain by assigning a value to it. The values ranged from 51 (strain adsorbing more colored compounds) to 155 (strain adsorbing less colored
compounds). The strains were distributed in 25 homogeneous groups (data not shown).
3. Laboratory-scale fermentations: influence of yeast strains and SO2
Fermentation vigor, as the sample weight for loss of carbon dioxide, varied from 3.65 to 7.79 with SO2,
and from 4.42 to 5.86 without SO2. After alcoholic
Figure 1 - Means, standard deviations, and homogeneous groups (Fisher’s Least Significant Differences, level of confidence of 95%) of Red (R), G (Green), and B (Blue) parameters obtained
fermentation, with or without SO2, the 50 strains
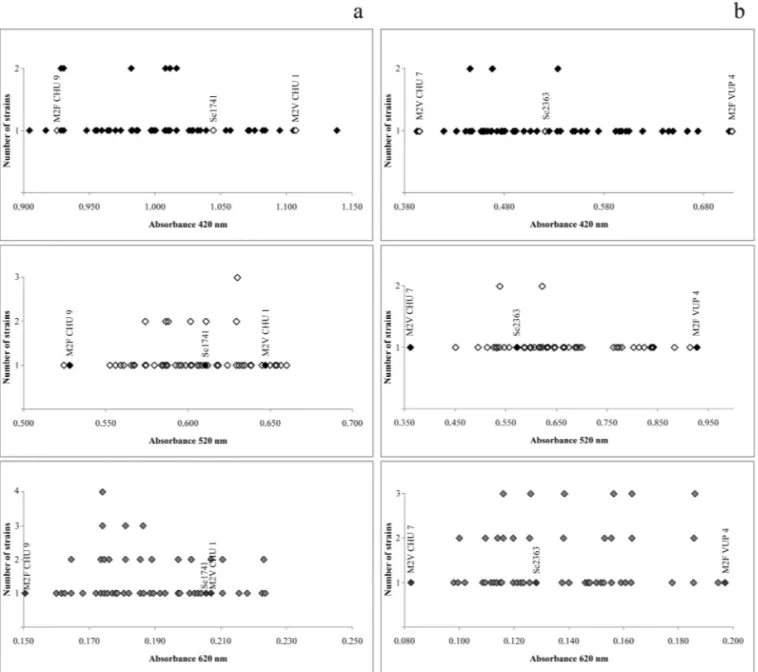
could be distributed in 15 groups according to the ethanol content, ranging from 9.90 to 10.39 %. Dot plots of the color parameters at 420-, 520-, and 620-nm of the wines obtained without (figure 2a) and with (figure 2b) the addition of SO2show the number
of strains with the same value of yellow, red, and blue wine parameters. For the wines produced without SO2, the 420-nm values ranged from 0.905 (strain
M2F CHU2) to 1.139 (strain M2V P9) with a mean value of 1.007. The 520-nm values, indicating the anthocyanin content, ranged from 0.525 (strain Sc1687) to 0.660 (strain M2V CHU6) with a mean value of 0.603. The 620-nm values ranged from 0.151 (strain M2F CHU9) to 0.224 (strain M2V CHU2) with a mean value of 0.187. The strains were
distributed in 28, 29, and 21 homogeneous groups for the 420-, 520-, and 620-nm values, respectively. For the wines produced with the addition of SO2, the
420-nm values ranged from 0.393 (strain M2F CHU5) to 0.709 (strain M2F VUP4) with a mean value of 0.525. The 520-nm values ranged from 0.362 (strain M2V CHU7) to 0.928 (strain M2F VUP4) with a mean value of 0.658. The 620-nm values ranged from 0.082 (strain M2V CHU7) to 0.197 (strain M2F VUP4) with a mean value of 0.137. The strains were distributed in 21, 31, and 22 homogeneous groups for the 420-, 520-, and 620-nm values, respectively.
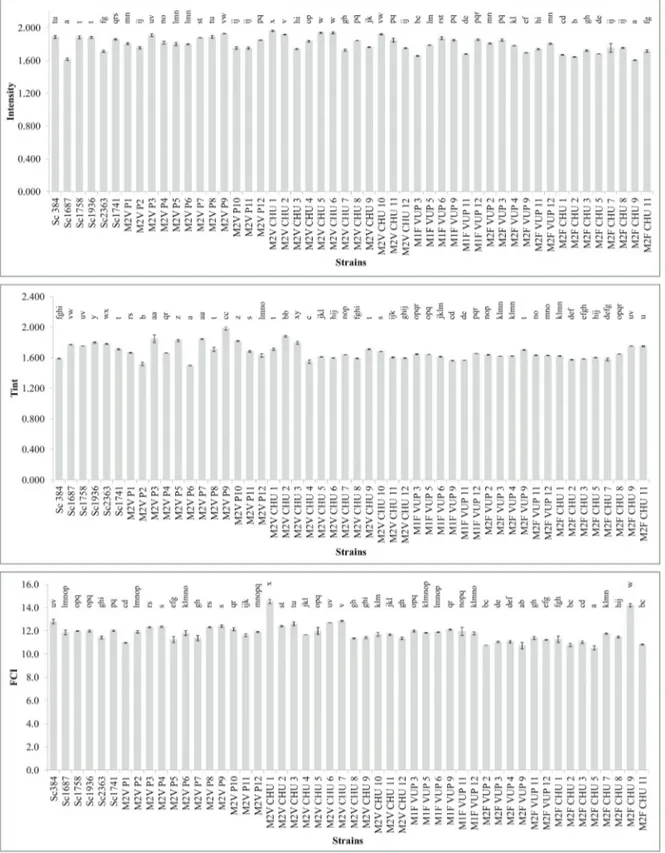
Figure 3 reports the intensity and tint parameters, as well as the FCI of the wines obtained from must without the addition of SO2. The strains M2F CHU9
Figure 2 - Dot plots of the color parameters - 420-, 520-, and 620-nm - of the wines obtained without (a) and with (b) the addition of SO2, showing the number of strains with the same value of yellow, red, and blue
wine parameters. The name of the strains that, according to the intensity parameter (sum of absorbance at 420-, 520-, and 620-nm), are more useful to improve the color of wines are shown.
and M2V CHU1 produced wines with the lowest and the highest color intensity, respectively. The strains were distributed in 24 homogeneous groups with a mean value of 1.798. The tint values ranged from 1.498 (strain M2V P6) to 1.983 (strain M2V P9) with a mean value of 1.674. The strains were distributed in 29 homogeneous groups. The strains M2F CHU5 and M2V CHU1 produced wines with the lowest and the
highest content of total polyphenols, respectively. The mean value of the FCI was 11.8. The strains were distributed in 24 homogeneous groups.
Figure 4 reports the intensity and tint parameters, as well as the FCI of the wines obtained with the addition of SO2. The strains M2V CHU7 and M2F
VUP4 produced wines with the lowest and the highest color intensity, respectively. The mean color
Figure 3 - Means, standard deviations, and homogenous groups (Fisher’s Least Significant Differences, level of confidence of 95%) of the color intensity, tint, and Folin-Ciocalteu’s Index (FCI) of the wines
intensity was 1.319. The strains were distributed in 30 homogeneous groups. The tint parameter ranged from 0.709 (strain M2F VUP11) to 1.092 (strain M2V CHU7) with a mean value of 0.848. The strains were distributed in 28 homogeneous groups. Concerning the total polyphenol content, the strains were distributed in 24 homogeneous groups. The strains M2F CHU5 and M2F CHU7 gave wines with
the lowest and the highest total polyphenol content, respectively, with a mean value of 10.4.
The wines produced without the addition of SO2are
characterized by 56.19 % Y, 33.44 % R, and 10.37 % B, while the SO2 gave wines with 39.79 % Y,
49.84 % R, and 10.37 % B. Therefore, the SO2
determines an increase of 49 % in red components.
Figure 4 - Mean values, standard deviations, and homogeneous groups (Fisher’s Least Significant Differences, level of confidence of 95%) of color intensity, tint, and Folin-Ciocalteu’s Index (FCI)
The SO2 affects wine intensity, tint, and total
polyphenol content by determining a decrease.
DISCUSSION
The wines obtained from pasteurized must without the addition of SO2have higher color intensity than
the wines obtained from must with SO2 addition.
This result is in accordance with the finding on grape juice quality reported by Morris et al. (1986) and Morata et al. (2006). The addition of SO2affects the
wine color parameters by modifying their percentage in wines. Nevertheless, for all the parameters studied, the statistical analysis highlights the existence of great variability and significant differences among the strains.
The strains behavior when tested on Petri plates and at laboratory-scale fermentation is not always in accordance. In detail, the strain Sc384, which shows the highest adsorption activity on GraSki, is among the strains producing wines with high color intensity when tested in the absence of SO2, while in the
presence of SO2 it produces wines with medium
color intensity. The strains M2V P10, M2V P3, M2V P7, M1F VUP6, M2V P1, M2F VUP3, and M2F CHU8 have high aptitude to adsorb colored compounds on GraSki and, in the presence of SO2,
exhibit low or medium color wine intensity. The strain M1F VUP11, which has the lowest adsorption activity on GraSki, shows low and high wine color intensity without and with SO2, respectively. Similar
behavior in the presence of SO2 is reported for the
strains M2V CHU10, M2F CHU1, and M2F CHU7. This could be attributable to the fact that the color and phenolic content of wines depends on a variety of factors other than yeasts (see Introduction section). The Calabrian strains often belong to the same homogeneous groups of the Slovak strains showing similar performances. This is in accordance with recent findings (Francesca et al., 2012) supporting the idea to reconsider the term ‘autochthonous’ in winemaking.
CONCLUSION
The improvement of wine color is among the criteria for wine yeast selection (Pretorius et al., 2003; Fleet, 2008). Over the years, various research groups have focused their interest on the interaction between yeasts and wine color (Caridi et al., 2004; Medina et al., 2005; Morata et al., 2005) and the way to assess yeast behavior towards pigments (Caridi et al., 2007; Caridi, 2013).
This paper reports the use of GraSki to test a great number of isolates for their color adsorption aptitude. The results highlight the effectiveness of using the Petri plate adsorption assay together with laboratory-scale fermentations as a strategy for assessing the aptitude of S. cerevisiae strains to positively impact the color of wines. More fermentation trials with different red grape musts in comparison with test on GraSki are needed to validate the test on the chromogenic medium. If validated, testing strains on GraSki should be the fastest and simplest way to know their behavior towards grape pigments and this test could be included in those currently performed for wine strain selection.
The incomplete correlation between data on strain biomass and laboratory-scale fermentations, due to factors other than yeasts acting on wine colored polyphenols, highlights the need to go further in the investigation, especially considering strain differences in the cell wall structures, the type of polyphenols present in GraSki and in the grape must, and the chemical interaction between strains and media.
Acknowledgements: This work was supported by the project APVV-SK-IT-0019-08 “Use of selected autochthonous yeasts with adsorption activities to improve the quality and safety of wine” - Slovak-Italian Science and Technology Cooperation. It was also supported by Action 2 : Laboratori pubblici di ricerca “Mission oriented” interfiliera, AGROMATER-LAB Calabria and L.I.P.A.C., and by the Slovak Research and Development Agency under contract No. APVV-0344-12.
REFERENCES
Callejon R.M., Clavijo A., Ortigueira P., Troncoso A.M., Paneque P. and Morales M.L., 2010. Volatile and sensory profile of organic red wines produced by different selected autochthonous and commercial Saccharomyces cerevisiae strains. Anal. Chim. Acta, 660, 68-75.
Caridi A., Cufari A., Lovino R., Palumbo R. and Tedesco I., 2004. Influence of yeast on polyphenol composition of wine. Food Technol. Biotechnol., 42, 37-40.
Caridi A., 2006. Enological functions of parietal yeast mannoproteins. Antonie van Leeuwenhoek, 89, 417-422.
Caridi A., Sidari R., Solieri L., Cufari A. and Giudici P., 2007. Wine colour adsorption phenotype: an inheri-table quantitative trait loci of yeasts. J. Appl. Microbiol., 103, 735-742.
Caridi A. and Sidari R., 2009. Safety and healthiness enhancement of red wines by selected microbial starters. In: O’Byrne P. (Ed.), Red Wine and Health.
Nova Science Publishers Inc., New York, pp. 205-233.
Caridi A., 2013. Improved screening method for the selection of wine yeasts based on their pigment adsorption activity. Food Technol. Biotechnol., 51, 137-144.
Chovanová K., Kraková L., Ženišová K., Turcovská V., Brežná B., Kuchta T. and Pangallo D., 2011. Selection and identification of autochthonous yeasts in Slovakian wine samples using a rapid and reliable three-step approach. Lett. Appl. Microbiol., 53, 231-237.
Esteve-Zarzoso B., Belloch C., Uruburu F. and Querol A., 1999. Identification of yeasts by RFLP analysis of the 5.8 S rRNA gene and the two ribosomal internal transcribed spacers. Int. J. Syst. Bacteriol., 49, 329-337.
Fleet G.H., 2008. Wine yeasts for the future. FEMS Yeast Res., 8, 979-995.
Francesca N., Canale D.E., Settanni L. and Moschetti G., 2012. Dissemination of wine-related yeasts by migratory birds. Environ. Microbiol. Rep., 4, 105-112.
Giudici P. and Zambonelli C., 1992. Criteri di selezione dei lieviti per enologia. Vignevini, 9, 29-34.
Hernández L.F., Espinosa J.-C., Fernández-González M. and Briones A., 2003. ß-glucosidase activity in a Saccharomyces cerevisiae wine strain. Int. J. Food Microbiol., 80, 171-176.
Kraková L., Chovanová K., Ženišová K., Turcovská V., Brežná B., Kuchta T. and Pangallo D., 2012. Yeast diversity investigation of wine-related samples from two different Slovakian wine-producing areas through a multistep procedure. LWT Food Sci. Technol., 46, 406-411.
Medina K., Boido E., Dellacassa E. and Carrau F., 2005. Yeast interactions with anthocyanins during red wine fermentation. Am. J. Enol. Vitic., 56, 104-109. Morata A., Gómez-Cordovés M.C., Colomo B. and
Suárez J.A., 2003a. Pyruvic acid and acetaldehyde production by different strains of Saccharomyces cerevisiae: relationship with Visitin A and B forma-tion in red wines. J. Agric. Food Chem., 51, 7402-7409.
Morata A., Gómez-Cordovés M.C., Suberviola J., Bartolomé B., Colomo B. and Suárez J.A., 2003b. Adsorption of anthocyanins by yeast cell walls during the fermentation of red wines. J. Agric. Food Chem., 51, 4084-4088.
Morata A., Gómez-Cordovés M.C., Colomo B. and Suárez J.A., 2005. Cell wall anthocyanin adsorption by different Saccharomyces strains during the fermentation of Vitis vinifera L. cv. Graciano grapes. Eur. Food Res. Technol., 220, 341-346.
Morata A., Gómez-Cordovés M.C., Calderón F. and Suárez J.A., 2006. Effects of pH, temperature and SO2on the formation of pyranoanthocyanins during
red wine fermentation with two species of Saccharomyces. Int. J. Food Microbiol., 106, 123-129.
Morris J.R., Sistrunk W.A., Junek J. and Sims C.A., 1986. Effects of fruit maturity, juice storage, and juice extraction temperature on quality of ‘Concord’ grape juice. J. Am. Soc. Hortic. Sci., 111, 742-746.
Nisiotou A.A., Spiropoulos A.E. and Nychas G.J.E., 2007. Yeast community structures and dynamics in healthy and Botrytis-affected grape must fermentations. Appl. Environ. Microbiol., 73, 6705-6713.
Poudel P.R., Tamura H., Kataoka L. and Mochioka R., 2008. Phenolic compounds and antioxidant activities of skins and seeds of five wild grapes and two hybrids native to Japan. J. Food Compos. Anal., 21, 622-625.
Pretorius I.S., du Toit M. and van Rensburg P., 2003. Designer yeasts for the fermentation industry of the 21stcentury. Food Technol. Biotechnol., 41, 3-10.
Pulvirenti A., Solieri L., Gullo M., De Vero L. and Giudici P., 2004. Occurrence and dominance of yeast species in sourdough. Lett. Appl. Microbiol., 38, 113-117.
Raspor P., Miklič Milek D., Polanc J., Smole Možina S. and Čadež N., 2006. Yeasts isolated from three varieties of grapes cultivated in different locations of the Dolenjska vine-growing region, Slovenia. Int. J. Food Microbiol., 109, 97-102.
Singleton V.L. and Rossi J.A. J.-R., 1965. Colorimetry of total phenolics with phosphomolybdic-phospho-tungstic acid reagents. Am. J. Enol. Vitic., 16, 144-158.