Fecal Microbiota in Healthy Subjects
Following Omnivore, Vegetarian and Vegan
Diets: Culturable Populations and rRNA DGGE
Profiling
Ilario Ferrocino1, Raffaella Di Cagno2, Maria De Angelis2, Silvia Turroni3, Lucia Vannini4, Elena Bancalari5, Kalliopi Rantsiou1, Gianluigi Cardinali6, Erasmo Neviani5,
Luca Cocolin1*
1 Department of Agricultural, Forest and Food Science, University of Turin, Largo P. Braccini n°2, 10095, Grugliasco, Italy, 2 Department of Soil, Plant and Food Science, University of Bari Aldo Moro, Via Amendola 165/a, 70126, Bari, Italy, 3 Department of Pharmacy and Biotechnology, Alma Mater Studiorum University of Bologna, Via Belmeloro 6, 40126, Bologna, Italy, 4 Department of Agricultural and Food Sciences, viale Fanin 50, 40127, Bologna, Italy, 5 Department of Food Science, University of Parma, Parco Area delle Scienze 49/A, 43124, Parma, Italy, 6 Department of Pharmaceutrical Sciences Università of Perugia, Via Borgo 20 Giugno, 74 06123, Perugia, Italy
Abstract
In this study, the fecal microbiota of 153 healthy volunteers, recruited from four different lo-cations in Italy, has been studied by coupling viable counts, on different microbiological media, with ribosomal RNA Denaturing Gradient Gel Electrophoresis (rRNA-DGGE). The volunteers followed three different diets, namely omnivore, ovo-lacto-vegetarian and vegan. The results obtained from culture-dependent and -independent methods have underlined a high level of similarity of the viable fecal microbiota for the three investigated diets. The rRNA DGGE profiles were very complex and comprised a total number of bands that varied from 67 to 64 for the V3 and V9 regions of the 16S rRNA gene, respectively. Only a few bands were specific in/of all three diets, and the presence of common taxa associated with the dietary habits was found. As far as the viable counts are concerned, the high similarity of the fecal microbiota was once again confirmed, with only a few of the investigated groups showing significant differences. Interestingly, the samples grouped differently, according to the recruitment site, thus highlighting a higher impact of the food consumed by the volun-teers in the specific geographical locations than that of the type of diet. Lastly, it should be mentioned that the fecal microbiota DGGE profiles obtained from the DNA were clearly sep-arated from those produced using RNA, thus underlining a difference between the total and viable populations in the fecal samples.
a11111
OPEN ACCESS
Citation: Ferrocino I, Di Cagno R, De Angelis M, Turroni S, Vannini L, Bancalari E, et al. (2015) Fecal Microbiota in Healthy Subjects Following Omnivore, Vegetarian and Vegan Diets: Culturable Populations and rRNA DGGE Profiling. PLoS ONE 10(6): e0128669. doi:10.1371/journal.pone.0128669 Academic Editor: Markus M. Heimesaat, Charité, Campus Benjamin Franklin, GERMANY Received: March 21, 2015
Accepted: April 30, 2015 Published: June 2, 2015
Copyright: © 2015 Ferrocino et al. This is an open access article distributed under the terms of the Creative Commons Attribution License, which permits unrestricted use, distribution, and reproduction in any medium, provided the original author and source are credited.
Data Availability Statement: All relevant data are within the paper and its Supporting Information files. Funding: This study was supported by the Italian Ministry of University and Research (MIUR) PRIN 2010–2011 program (http://www.diet4microgut.it). Competing Interests: The authors have declared that no competing interests exist.
Introduction
Human intestinal microbiota is a complex ecosystem which contains a huge number of micro-organisms, including bacteria, archaea, viruses and fungi, which form 60% of the total fecal mass [1,2]. The composition of intestinal microbiota is gaining importance in human health studies since there is increasing evidence that these microorganisms play a role in disease aeti-ology [3,4]. Over the last few decades, several studies have reported the importance of improv-ing knowledge on how lifestyle factors, such as diet, age or geographic site, can influence changes in gut microbiota [5–9]. Diet habits in particular appear to be an important factor that affects gut microbiota, in terms of abundance, composition and activity [9–11]. Different kinds of food have been demonstrated to influence microbiota composition, as they provide sub-strates for bacterial proliferation and function as sources of bacterial contamination. Changing the intakes of the three main macronutrients (carbohydrates, proteins and fats) can significant-ly affect the composition of microbiota [12–15].
At present, three main dietary habits have been recognized throughout the world: omnivore, ovo-lacto-vegetarian and vegan. The choice of following an ovo-lacto-vegetarian or vegan diet is increasing throughout the world due to the widespread information that is available on the effects that such diets can have on human health, in terms of prevention of cardio-vascular dis-eases (CVD), cancer and diabetes [16–19]. All these studies indicate that diet has a considerable effect on the composition of gut microbiota. Moreover, comparisons between long-term and short-term dietary habits have shown that only long-term diets are correlated/can be correlated to the composition of microbiota [11].
Although colonic microbiota is relatively stable throughout the life of an adult, age-related changes in the gastrointestinal (GI) tract, as well as changes in diet and immune system reactiv-ity, inevitably affect microbiota [20]. The differences in composition of gut microbiota, related to ovo-lacto-vegetarian, vegan or omnivore diets have been reported extensively, but studies on large cohorts are generally lacking [21–25]. The classical microbiological methods employed for the analysis of fecal microbiota offer a partial representation of the impact on the gut eco-system, because it has been estimated that more than 60% of fecal bacteria cannot be cultured, due to their fastidious requirements for anaerobiosis and nutritional needs [12]. Molecular techniques, based on the 16S rRNA sequence, such as fluorescent in situ hybridization (FISH), terminal restriction fragment length polymorphism (T-RFLP), denaturing gradient gel electro-phoresis (DGGE), quantitative PCR (qPCR) and, more recently, high-throughput sequencing technologies (HTS), are also used to characterize human gut microbiota [11,25,26]. Although DNA based fingerprint procedures provide a picture of the global community, they do not re-flect the metabolic activity of the populations, because the DNA could originate from living ac-tive cells, living dormant cells, lysed cells, or even dead cells. RNA-based approaches can help overcome this limitation, since they can describe the microbiota, focusing on live bacteria [27]. A clear difference between DNA and RNA based DGGE fingerprints on the predominant fecal bacterial populations has been reported [28,29].
In the present study, the fecal microbiota of 153 healthy volunteers, recruited from different regions in Italy, who followed omnivore, ovo-lacto-vegetarian or vegan diets, has been investi-gated by means of molecular methods (DNA and RNA-based-DGGE), and using conventional enumeration of the main microbial groups on selective agar plates, with the final goal of de-scribing the impact of the diet regime on the composition of the fecal populations.
Materials and Methods
Participant recruitment
Between February 2013 and July 2013, healthy adult volunteers (no = 153) with about equal por-tions of men and women aged 18–55 (38 ± 9.8), with BMI>18 (22 ± 2.3), who habitually fol-lowed an omnivore (total no = 51), ovo-lacto-vegetarian (total no = 51) or vegan (total no = 51) diet, were recruited in 4 different locations in Italy: three locations in the north (Bologna, Parma and Turin) and one in the south (Bari). The volunteers were recruited through advertisements and using flyers, which were distributed in the areas surrounding the collection sites. Addition-ally, a press release was published on thehttp://www.scienzavegetariana.it/web-site.
The subjects had to have followed a specific diet for at least one year at the time of recruit-ment. An ovo-lacto-vegetarian diet was assumed when the subjects stated they did not con-sume meat in any form, but ate animal products such as milk, cheese and eggs. A vegan diet was also considered for those who stated they did not consume such animal products. The ex-clusion criteria were: acute or chronic gastrointestinal diseases; eating disorders, such as an-orexia, bulimia or other specified feeding or eating disorder; prevalent chronic diseases, such as diabetes mellitus and cancer; Antibiotic treatment or surgical operations during the previous 3 months; pregnancy and breastfeeding.
Human fecal sample collection
Volunteers were provided with 3 series of containers to collect the feces (VWR, Milan, Italy); the first contained 10 mL of an Amies liquid transportation medium (Oxoid, Milan, Italy), the second contained 10 mL of RNA later (Life Technologies, Milan, Italy) and the third was empty. The subjects were instructed on how to collect the samples, and all materials were pro-vided in a convenient, refrigerated, specimen collection kit.
The fecal samples were collected at home and transferred to the sterile sampling containers using a polypropylene spoon (3 spoons of about 15g in the Amies containing container, 2 spoons of about 10 g in the one containing RNA later and 2 spoons of about 10 g in the empty one) and immediately stored at 4°C. The specimens were transported to the laboratory within 12 hours of collection at a refrigerated temperature. Each volunteer was requested to collect feces samples over a time span of 3 weeks, once per week. The fecal samples in the Amies based containers were used immediately to evaluate the microbial populations through the use of se-lective culture media, while the RNA-later based and the empty containers were stored at -80°C for RNA and DNA extraction, respectively.
Microbiological analysis
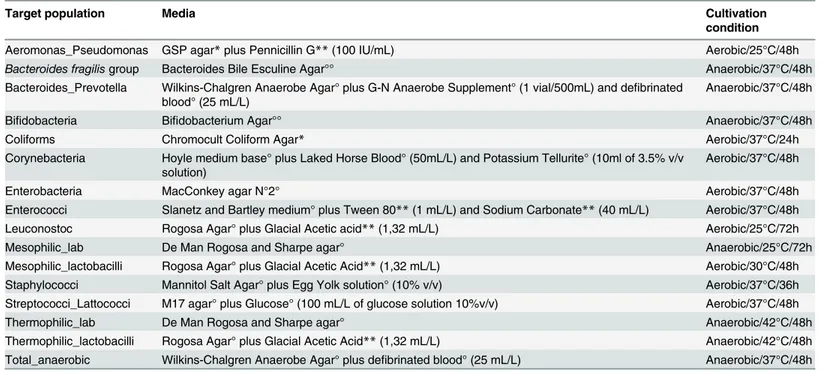
Ten g of feces from each volunteer, were homogenized with 90 mL of Ringer’s solution (Oxoid) for 2 min in a stomacher (LAB Blender 400, PBI, Italy; stomacher bags: Sto-circul-bag, PBI, Italy) at room temperature for each week of collection. Decimal dilutions were prepared in quarter-strength Ringer’s solution, and aliquots of 0.1 ml of the appropriate dilutions were spread onto several media, as reported inTable 1. The results were calculated as the means of Log colony forming units (CFU) for three independent determinations.
Total DNA and RNA extraction from feces samples
The 3 aliquots of feces collected during the experiment from each volunteer were pooled to-gether for nucleic acid extraction. Ten g of the pool was aseptically homogenized with 90 ml of Ringer’s solution (Oxoid) for 2 min in a stomacher (PBI) at room temperature for DNA extrac-tion. An aliquot of two ml was collected and centrifuged at the maximum speed for 30 s, then
the supernatant was removed and the DNA was extracted from the pellet using a Powersoil DNA kit (MO-BIO, Carlsbad, CA, USA), according to the manufacturer’s instructions. DNA was quantified using a NanoDrop 1000 spectrophotometer (Thermo Scientific, Milano, Italy) and standardized at 50 ngμl-1. About 250 mg of the feces pool was directly subjected to RNA extraction using a Stool Total RNA Purification Kit (Norgen Biotek Corp. Ontario, Canada), according to the supplier's instructions. Sevenμl of TURBO-DNase (Life Technologies) was added to digest the DNA in the RNA samples, with an incubation of 3 h at 37°C. RNA was quantified, as described above, and standardized at 500 ngμl-1. Each RNA solution was checked for the presence of residual DNA by performing PCR amplification. When positive signals were detected, the DNase treatment was repeated.
Reverse transcription
Reverse transcription (RT) reactions were performed using M-MLV reverse transcriptase (Pro-mega, Milan, Italy). Five hundred ng of RNA was mixed with 1μl of 10 μM Random Primers (Promega) and DNase- and RNase-free sterile water (Sigma) to a final volume of 10μl and then incubated at 75°C for 5 min. The mix was placed on ice and a mixture containing 50 mM Tris-HCl (pH 8.3), 75 mM KCl, 3 mM MgCl2,10 mM DTT, 2 mM of each dNTP, 1μl of 200 Uμl-1M-MLV and 0.96 U of RNasin ribonuclease inhibitor (Promega) was transferred to the reaction tube. Reverse transcription was carried out at 42°C for 1 h.
Table 1. Media and cultivation condition used.
Target population Media Cultivation
condition
Aeromonas_Pseudomonas GSP agar* plus Pennicillin G** (100 IU/mL) Aerobic/25°C/48h
Bacteroides fragilisgroup Bacteroides Bile Esculine Agar°° Anaerobic/37°C/48h
Bacteroides_Prevotella Wilkins-Chalgren Anaerobe Agar° plus G-N Anaerobe Supplement° (1 vial/500mL) and defibrinated blood° (25 mL/L)
Anaerobic/37°C/48h
Bifidobacteria Bifidobacterium Agar°° Anaerobic/37°C/48h
Coliforms Chromocult Coliform Agar* Aerobic/37°C/24h
Corynebacteria Hoyle medium base° plus Laked Horse Blood° (50mL/L) and Potassium Tellurite° (10ml of 3.5% v/v solution)
Aerobic/37°C/48h
Enterobacteria MacConkey agar N°2° Aerobic/37°C/48h
Enterococci Slanetz and Bartley medium° plus Tween 80** (1 mL/L) and Sodium Carbonate** (40 mL/L) Aerobic/37°C/48h
Leuconostoc Rogosa Agar° plus Glacial Acetic acid** (1,32 mL/L) Aerobic/25°C/72h
Mesophilic_lab De Man Rogosa and Sharpe agar° Anaerobic/25°C/72h
Mesophilic_lactobacilli Rogosa Agar° plus Glacial Acetic Acid** (1,32 mL/L) Aerobic/30°C/48h
Staphylococci Mannitol Salt Agar° plus Egg Yolk solution° (10% v/v) Aerobic/37°C/36h
Streptococci_Lattococci M17 agar° plus Glucose° (100 mL/L of glucose solution 10%v/v) Aerobic/37°C/48h
Thermophilic_lab De Man Rogosa and Sharpe agar° Anaerobic/42°C/48h
Thermophilic_lactobacilli Rogosa Agar° plus Glacial Acetic Acid** (1,32 mL/L) Anaerobic/42°C/48h Total_anaerobic Wilkins-Chalgren Anaerobe Agar° plus defibrinated blood° (25 mL/L) Anaerobic/37°C/48h Suppliers:
*Merk-Millipore, Darmstadt, Germany; **Sigma, Milan, Italy;
°Oxoid, Milan, Italy;
°°Becton Dickinson, Milan, Italy. doi:10.1371/journal.pone.0128669.t001
PCR amplification and DGGE analysis
Oneμl of DNA, or cDNA, was used as a template in the PCR reaction. Two regions of 16S rRNA were amplified: the V3 region with the 338f-GC/518r primers [30] and the V9 region with the Ec1392-GC/Ec1055 primers [31]. PCR template was denatured for 5 min at 94°C, the initial annealing temperature was 66°C and this was decreased 1°C every cycle for 10 cycles, fi-nally 20 cycles were performed at 56°C. The extension for each cycle was carried out at 72°C for 3 min while the final extension was at 72°C for 30 min. PCR products obtained with the two couples of primers were applied to an 8% (wt/vol) polyacrylamide gel (acrylamide- bis ac-rylamide 37:5:1) with a denaturing gradient ranging from 25 to 55%. The gels were subjected to a voltage of 200 V for 4 h at 60°C, stained for 30 min in 1X TAE containing 1X SYBR gold (Life Technologies) and then analyzed under UV using UVI pro platinum 1.1 Gel Software (Eppen-dorf, Hamburg, Germany). Selected DGGE bands, specific of each dietary habit, were excised from the gel with sterile pipette tips and purified in water. One microliter of the eluted DNA was used for the re-amplification using the primers and the conditions described above, and the PCR products were checked by means of DGGE. The original PCR product was run on the gel as the control. Products that migrated as a single band and at the same position as the con-trol were purified using a PCR Extract Mini Kit (5PRIME, Hilden, Germany), according to the manufacturer’s instructions. Sequencing was performed with a Deoxy terminator cycle se-quencing kit (Perkin-Elmer Applied Biosystems), using the 518r or EC1055 primers. Searches were performed in public data libraries (GenBank) with the Blast search program (http://www. ncbi.nlm.nih.gov/blast/) in order to determine the closest known relatives of the obtained par-tial 16S rRNA gene sequences.
Statistical analysis
Data obtained from the plate counts were analyzed using one-way analysis of variance (ANOVA) for each individual volunteer, with diet being the main factor, and the R package “Vegan” (www.r-project.org). ANOVA analyses were performed with the SPSS 22.0 statistical software package (SPSS Inc., Cary, NC, USA). The Duncan HSD test was applied when ANOVA revealed significant differences (P< 0.05). A database of fingerprints was created using the Bionumerics software, version 4.6 (Applied Maths, Sint Marten Latem, Belgium). A combined data matrix that included all the fingerprints of both couples of primers was ob-tained, and dendrograms of similarity were retrieved using the Dice coefficient and the Un-weighted Pair Group Method with the Arithmetic average (UPGMA) clustering algorithm [32]. The similarity distance matrix generated through the Bionumerics software was used to build a Projection on Latent Structures—Discriminant Analysis (PLS-DA) utilizing the “mixO-mics” R package. Binary band-matching tables, obtained by means of Bionumerics software, were considered to calculate the Shannon-Wiener diversity index (H’) using PAST (PAleonto-logical STatistics) software [33].
Ethics statement
During a preparatory consultation interview, the candidates were informed about the scope of the research; all the subjects gave written informed consent, and the study was approved by the Ethics Committee of (i) Azienda Sanitaria Locale Bari (protocol No.1050), (ii) Azienda Ospe-daliera Universitaria of Bologna (protocol No. 0018396), (iii) Province of Parma (protocol No. 22884) and (iv) the University of Torino (protocol No.1/2013/C).
Results
Plate counts
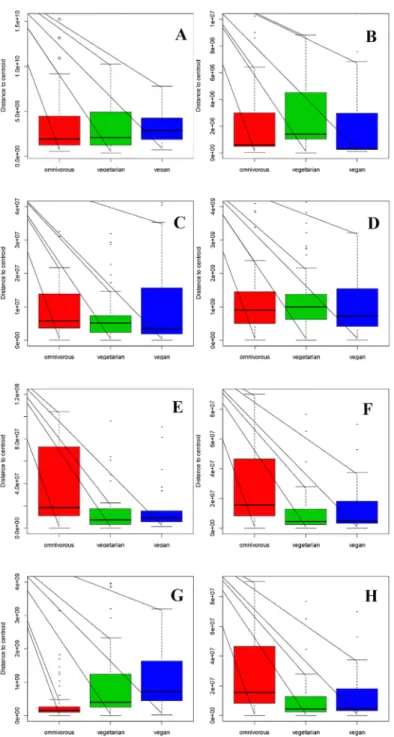
The results of the viable counts were all considered to calculate a data matrix, which was then processed by PLS-DA. Samples in the 3D dispersion picture (S1 Fig) may appear all closely grouped, but it was possible to find a certain degree of separation of the omnivore from the non-omnivore subjects. The viable count data were further analyzed using ANOVA, with diet being the main factor. The Duncan HSD test was applied when ANOVA revealed significant differences (P< 0.05). Only the results considered significant according to ANOVA were used to build the box plot (Fig 1). No significant discrimination was obtained when all the media were considered (Fig 1A). In the vegetarian group, only the counts on GSP agar (for detection of Pseudomonas sp. and Aeromonas sp.) showed significant differences (P< 0.05) when com-pared to omnivore and vegan groups, and they were approximately 1 Log higher than the other dietary groups (Fig 1B). Moreover, the Coliforms (Fig 1C) and Bifidobacterium sp. (Fig 1D) counts were lower in the vegan group than in the other two groups (P< 0.05). In addition, the microbial populations counted on MRS agar at 25°C and 37°C showed a remarkable similarity between the vegan and ovo-lacto-vegetarian diets, and a remarkable difference from the omni-vors (Fig1Eand1F). On the other hand, the Bacteroides and Prevotella load, which was moni-tored on Wilkins-Chalgren Anaerobe Agar plus G-N Anaerobe Supplement, showed a
significant reduction (P< 0.05) of about 1 Log in the omnivore group, compared to the vegans and ovo-lacto-vegetarians (Fig 1G).
The population counts of the Bacteroides fragilis group, (Fig 1H) in the omnivore group were higher than those of the other groups (P< 0.05).
DGGE analysis of the fecal microbiota
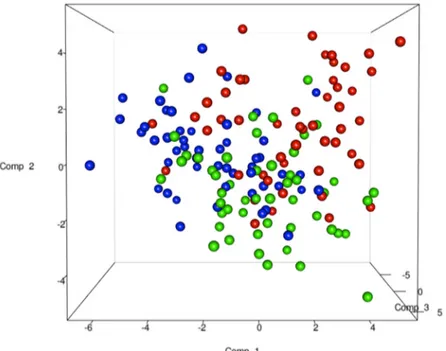
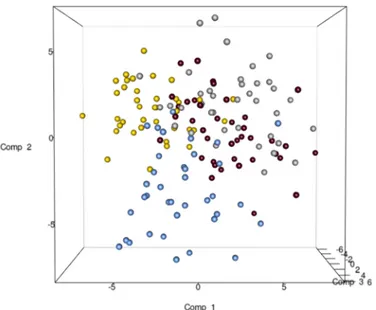
The total DNA and RNA extracted directly from the feces were employed to amplify the V3 and V9 regions of the 16S rRNA genes, and PCR products of approximately 250 bp, which were ana-lyzed by means of DGGE, were obtained. The DNA based DGGE analysis of the V3 region on average resulted in 22.5 bands per sample (min 7, max 31), while 14 bands per sample (min 3, max 25) (S2 Fig) were obtained for the V9 region. For the RNA based DGGE analysis, an aver-age of 9.8 (min 3, max 18) and 7.4 (min 2, max 22) bands per sample was observed for the V3 and V9 regions, respectively (S3 Fig). A combined data matrix of the fingerprints was produced using the two couples of primers. The similarity matrix generated through the Bionumerics soft-ware for the DNA and RNA samples was used to build a PLS-DA, as a function of the nucleic acids, and the results showed a clear separation between the RNA and DNA samples (Fig 2). As far as the dietary habits are concerned, it was only by using RNA data that it was possible to ob-serve a gradient of samples which indicated a certain degree of separation of the omnivore from the non-omnivore subjects (Fig 3), and for this reason, the DGGE profiles obtained from the RNA were subsequently considered. Analyzing the data from each geographical site separately, no differentiation was found between the three types of diet, although some separation was ob-served between diets in the samples from Torino (S4 Fig). Regardless of the dietary habits, the PLS models showed a separation of samples between Parma and the other recruitment sites (Fig 4). When the samples were grouped on the basis of dietary habits, the PLS-DA models showed a trend of differentiation according to the geographical origin of the samples in the om-nivore and vegan subjects (at least for Bari, Parma and Bologna), while the samples from Torino were only clearly separated in the case of the ovo-lacto-vegetarian population (Fig 5).
A binary band-matching table (for the V3 and V9 fingerprints) was analyzed in order to cal-culate the index of diversity (Shannon-Wiener diversity index H’). The H’ index was further
Fig 1. Distribution of the viable counts of the three diets according to the different culture media. Box plot interpretation: the central line indicates the median, upper and lower box lines of the first and third quartiles (Q1 and Q3), respectively, and the bars at the end of the whiskers represent the distribution extremities, while the dots indicate outliers. Plot A, all the media considered together; Plot B, GSP medium at 25°C; Plot C, Chromocult Coliform Agar at 37°C; Plot D, Bifidumbacterium Agar at 37°C; Plot E, MRS at 25°C; Plot F, MRS at 37°C; Plot G, Wilkins-Chalgren Anaerobe Agar + GN Supplement; Plot H, Bacteroides Bile Esculine Agar. For specifications on the counted microbial groups, reference can be made toTable 1. doi:10.1371/journal.pone.0128669.g001
analyzed using ANOVA, with diet or geographical site being the main factors. The Tukey HSD test was applied when ANOVA revealed significant differences (P< 0.05). The results, using only the data from the V3 region, revealed, on the basis of their geographical origin, that there was a significant biological diversity in the samples. In particular, the Parma group showed a
Fig 2. PLS-DA models based on the similarity distance matrix of DGGE built as a function of the nucleic acids. Data from DNA (blue) and RNA (yellow).
doi:10.1371/journal.pone.0128669.g002
Fig 3. PLS-DA models based on the RNA-DGGE similarity distance matrix as a function of the diet. Data from omnivore (red), ovo-lacto-vegetarian (green) and vegan (blue) individuals.
significant reduction in diversity H’ (P < 0.05) compared to the other groups. Moreover, Bari and Torino showed the highest diversity H’ (P < 0.05). No difference was found using diet as the main factor.
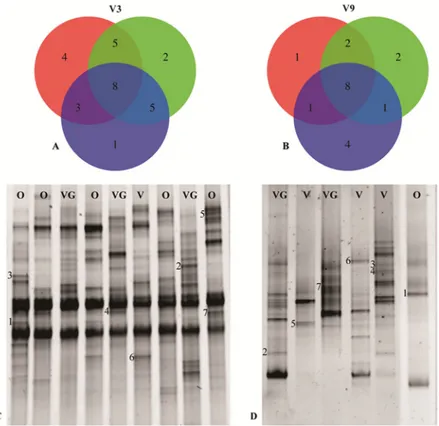
In order to identify patterns that could be correlated to dietary habits, bands present with a frequency of at least 20% (in at least 10 participants with the same diet) were searched. The re-sults of the band analysis are shown inFig 6AandFig 6B. As far as the V3 region is concerned,
Fig 4. PLS-DA models based on the RNA-DGGE similarity distance matrix as a function of the geographical site. The plot is color coded as a function of the city: Bari (silver), Bologna (gold), Parma (blue), Torino (maroon).
doi:10.1371/journal.pone.0128669.g004
Fig 5. PLS-DA models based on the RNA-DGGE similarity distance matrix from each diet group using the geographical site as the discriminating factor. Plot A, omnivore individuals; Plot B, ovo-lacto-vegetarian individuals; Plot C, vegan individuals. The samples are color coded according to the geographical site (Bari: silver; Bologna: gold; Parma: blue; Torino: maroon).
out of a total of 28 bands, 8 were in common for the 3 diets, while the specific bands for each diet were: 1 for the vegan group, 2 for the ovo-lacto-vegetarian group and 4 for the omnivore group. Five bands were shared between the omnivores and ovo-lacto-vegetarians, 3 between the omnivores and vegans and 3 between the vegans and ovo-lacto-vegetarians. Regarding the V3 region, the bands that appeared to be associated with the dietary habits were extracted from the gel, re-amplified and identified by means of sequencing. Representative RNA-DGGE
Fig 6. RNA-DGGE band distribution. Plot A and Plot B, Venn diagrams of the unique and overlapping bands present in the RNA-DGGE profile of the omnivore (red), ovo-lacto-vegetarian (green) and vegan (blue) individuals for the V3 and V9 regions, respectively; Plot C, RNA-DGGE fingerprints of the V3 amplicons, where the letters indicate the dietary groups: the omnivore (O), ovo-lacto-vegetarian (VG) and vegan (V) band identifications are reported inTable 2; Plot D, RNA-DGGE fingerprints of the V9 amplicons; the band identifications are reported inTable 3.
doi:10.1371/journal.pone.0128669.g006
Table 2. Microbial species identification after band sequencing of the variable V3 region of the 16S rRNA gene. Dietary habit-specific bands were se-lected and subjected to identification.
Band§ Closest relative Closest relative Accession No. Identity (%)
1 Bacteroides salanitronis NR074616 98 2 Prevotella micans NR113112 91 3 Uncultured bacterium LN681348 100 4 Bacteroides vulgatus NR074515 97 5 Bacteroides coprocola NR041278 100 6 Bacteroides salyersiae NR112942 96 7 Prevotella copri NR113411 93 §
The bands are indicated inFig 6, Plot C. doi:10.1371/journal.pone.0128669.t002
fingerprints of the V3 region are presented inFig 6C, while the results of band sequencing are shown inTable 2. The omnivore group showed the presence of bands identified as Bacteroides salanitronis and B. coprocola (bands 1 and 5, respectively) as well as Prevotella copri (band 7). One band was similar to the 16S rRNA gene sequences reported for an Uncultured bacterium (band 3). Prevotella micans and Bacteroides vulgatus were the specific bands for the vegetarian group (bands 2 and 4, respectively), while Bacteroides salyersiae (band 6) was the characteristic band for the vegan group.
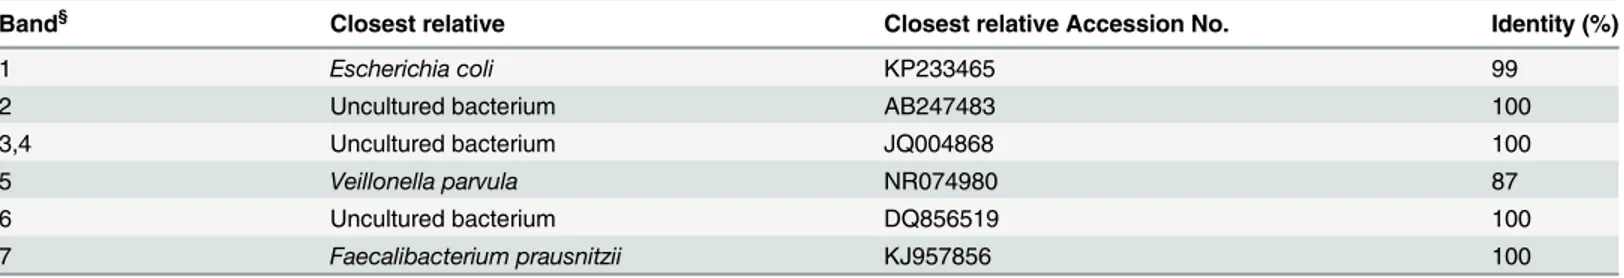
For the band analysis of the V9 region (Fig 6B), it emerged that 8 out of a total of 19 bands were shared by the 3 diets, and the diet-specific ones were: 4 for the vegan group, 2 for the ovo-lacto-vegetarian group and 1 for the omnivore group. Two bands were shared between the om-nivores and ovo-lacto-vegetarians, 1 between the omom-nivores and vegans and 1 was shared be-tween the vegans and ovo-lacto-vegetarians. The RNA-DGGE fingerprints of the V9 region are presented inFig 6D, while the band sequencing results are shown inTable 3. A specific band was identified for the vegan group, that is Veillonella parvula (band 5), while three bands were identified as Uncultured bacterium (bands 3, 4 and 6). The vegetarian group was characterized by the presence of Faecalibacterium prausnitzii (band 7) and Uncultured bacterium (band 2), while Escherichia coli (band 1) characterized the omnivore group.
Discussion
In this study, differences in fecal microbial composition, due to long-term dietary habits, have been investigated using classical plate counts and genetic fingerprinting techniques. It has fre-quently been reported that diet can influence gut microbiota. However, most studies have used a limited number of volunteers and have revealed only limited differences between the dietary habits. A few differences have recently been found between the gut microbiota of a small-size cohort of omnivore and vegan individuals in the USA [34].
Three large cohorts (51 subjects for each diet) with equal numbers of omnivores, ovo-lacto-vegetarians and vegans (age 30–50 years, male/female ratio ca. 1:1) have been employed for this study.
It was observed that the fecal microbiota of the ovo-lacto-vegetarian and vegan volunteers showed significantly lower microbial counts of the Bacteroides fragilis group. It has often been reported that long-term diets, associated with low levels of protein and animal fat intake, can decrease the levels of the Bacteroides genera [11]. A study on gut bacteria in children from Bur-kina Faso [8], who followed an agrarian diet, has shown a significant enrichment in Bacteroi-detes compared to European children. The authors speculate that the abundance of this group is a consequence of the higher fiber intake, and this link has been further confirmed in larger cohort studies [35].
Table 3. Microbial species identification after band sequencing of the variable V9 region of the 16S rRNA gene. Dietary habit-specific bands were se-lected and subjected to identification.
Band§ Closest relative Closest relative Accession No. Identity (%)
1 Escherichia coli KP233465 99
2 Uncultured bacterium AB247483 100
3,4 Uncultured bacterium JQ004868 100
5 Veillonella parvula NR074980 87
6 Uncultured bacterium DQ856519 100
7 Faecalibacterium prausnitzii KJ957856 100
§The bands are indicated inFig 6, Plot D.
The mesophilic/thermophilic LAB loads (on MRS agar) were also low in the vegan and ovo-lacto-vegetarian groups, in agreement with the findings of Zimmer et al. [35]. A simple expla-nation for this could be the absence of food containing LAB, such as yogurt, cheese and fer-mented meat products, in the vegan diet, as these foods can enrich gut LAB populations since these bacteria can easily survive gastric transit [14]. A few and, in some cases, controversial in vivo studies have pointed out a direct but causal relationship between microbes conveyed by fermented foods and gut microbiota. The consumption of raw milk cheese was given as one of the reasons [36]. During a 42 day post-antibiotic treatment, the levels of amoxicillin-resistant intestinal enterococci fell significantly in volunteers who consumed experimental raw milk cheeses instead of pasteurized hard cheeses. This positive and, probably, transitory effect was due to the higher level of mesophilic lactobacilli, propionibacteria and enterococci in the raw milk cheeses. David et al. [9] found that Pediococcus acidilactici and Staphylococcus taxa were high in omnivore subjects, due of the consumption of cured meats in animal-based diets, which are produced with starter cultures belonging to those species.
No significant difference between the ovo-lacto-vegetarian and omnivore groups was ob-served in relation to the Bifidobacterium load, although it was significantly lower in the vegan group. However, in a recent study it has been reported that there was no significant difference for Bifidobacterium between the three diets [35].
Few data are available regarding the significant reduction of Proteobacteria in vegans com-pared to ovo-lacto-vegetarians and omnivores. In addition, Proteobacteria prefer proteins as the main source of energy, which explains their higher counts in ovo-lacto-vegetarians and om-nivores. This evidence has also been reported by De Filippo et al. [8], who found that proteo-bacteria were present much less in a polysaccharide rich diet than in an animal protein diet. Prevotellacae counts have shown high loads in vegan and ovo-lacto-vegetarian diets, and it has been observed that Prevotella is sensitive to long-term fiber intake [8,11].
It is widely recognized that DGGE profiles can describe microbial composition and diversi-ty, as well as shifts within the communidiversi-ty, but they do not give information on the abundance and concentration of separate bacterial species [37]. For this reason, this limitation has partially been addressed here by conducting plate counts on several media. In addition, few studies have used RNA as a molecular marker to evaluate the metabolically active gut populations [29]. In this study, both DNA and RNA based DGGE fingerprints have been used and, through PLS-DA analysis, an impressive separation of the samples has been observed on the basis of the analyzed nucleic acid. Although the DNA fingerprints did not cluster according to the dietary types (data not shown), in agreement with a previous study [24], an approximate separation between the three diets was observed using RNA fingerprints. As a result, an analysis of the via-ble microbiota can contribute to the definition of the diversity of the gut environment. The spe-cific detection of mRNA or rRNA can be attempted to target viable bacteria, even though these molecules remain available for detection after bacterial death for some generally not predict-able time [27], especially for rRNA.
In addition to bacteria amplification, efforts have also been made to study fecal mycobiota, but only in 22.79% and 8.33% of the samples were DNA and cDNA obtained successfully (data not shown). These figures suggest that only a small number of yeast cells were present in the fecal samples employed in this study.
The samples were clearly separated in relation to the geographical site, and it was possible to find differences between samples from Bari (South Italy) and Parma (North Italy). This result was confirmed from an examination of the Shannon-Wiener indices. Parma had/showed the lowest diversity and Bari the highest. During the recruitment process, all the volunteers were selected in such a way as to obtain the same average age, BMI and male:female ratio in all the recruitment sites, and as a consequence, the obtained results suggest that the decrease/increase
in microbiota diversity may be due to differences in food, lifestyle and/or environment. It has recently been reported that communities from Russian regions displayed similarities within the bacterial taxa associated with the gut in each region [7]. Moreover, in another study [38], sub-stantial differences in the microbiota of healthy children and adults from Venezuela, Malawi and US metropolitan areas have been reported, although geographic differences cannot be ex-cluded as being of influence.
In addition, it was found that only a few of the bands in the DGGE profiles were different in the three studied dietary habits, and this result is in agreement with a recent report in which only 8 bands were determined to be different for dietary habits [4]. This evidence has also been found in this study, where a very few bands of both the V3 and V9 16S rRNA gene regions were characteristic for/of each dietary habit, with some of them being common to all the diets (Fig 6). The identification of dietary habit-specific bands showed the presence of members of the B. fragilis group in the omnivore samples (B. salanitronis and B. coprocola) and this result was in good agreement with the outcome from the plate counts. Prevotella copri was also found as a characteristic band of the omnivore subjects, and this evidence is in good agreement with the fact that it has recently been identified by DGGE in non-agrarian diets [25]. The ovo-lacto-vegetarian group was characterized by the presence of P. micans, B. vulgatus and Faecali-bacterium prausnitzii. In particular, B. vulgatus is recognized as being a species that is able to encode the largest number of enzymes which target the degradation of pectin, associated with an agrarian diet [39]. Faecalibacterium prausnitzii was found to be a characteristic species in the fecal samples of the subjects who followed a vegetarian diet [24], and it has recently been shown that it has the probiotic ability to produce vitamin B12 and to hydrolyze lactulose and galacto-oligosaccharides [40]. Faecalibacterium prausnitzii has also been recognized as being one of the most abundant butyrate producers in human feces. It has frequently been reported that short chain fatty acids are produced by intestinal microbiota during the fermentation of undigested polysaccharides. B. salyersiae and Veillonella parvula were the characteristic bands for the vegan groups, although the other sequences retrieved for this group showed greater sim-ilarity with uncultured bacteria, and this could be related to the difficulty of band isolation, which can result in too short sequences being retrieved to provide a robust phylogenetic analysis.
Conclusion
The results presented in this study are based on a large sample size (153 healthy subjects) from 4 different Italian locations. Excluding the obvious individual variability of the volunteers, dif-ferences in the fecal microbiota, and specifically in the viable populations, have been observed. The geographical area has been shown to influence the structure of gut microbiota, probably due to the different types of foods that have been consumed. Moreover, the abundance of the B. fragilis group in omnivores has been confirmed as well as several differences between vegans and ovo-lacto-vegetarians on the LAB load by means of plate counts and band identification. Overall, these findings confirm that, type of food consumed more that the dietary habits or geographical origin, can have an impact on fecal microbiota.
Supporting Information
S1 Fig. PLS-DA models based on viable counts.PLS-DA models based on similarity matrix data from plate counts built as a function of the diet: omnivore (red), ovo-lacto-vegetarian (green) and vegan (blue).
S2 Fig. Dendrogram of similarity generated from the digitized PCR-DGGE fingerprints of DNA.A combined data matrix of all the fingerprints for the V3 and V9 regions of 16S rRNA was obtained, while the dendrogram of similarity was obtained by means of the unweighted pair group method using an/the arithmetic average (UPGMA) clustering algorithm. Diet, sex, geographical site and sample codes are also reported.
(TIF)
S3 Fig. Dendrogram of similarity generated from the digitized PCR-DGGE fingerprints of RNA.A combined data matrix of all the fingerprints for the V3 and V9 regions of 16S rRNA was obtained, while the dendrogram of similarity was obtained by means of the unweighted pair group method using an/the arithmetic average (UPGMA) clustering algorithm. Diet, sex, geographical site and sample codes are also reported.
(TIF)
S4 Fig. PLS-DA models built on the similarity distance matrix on RNA-DGGE similarity matrix from each geographical site group using the diet as the discriminating factor.The samples are color coded as a function of the diet: omnivore (red), ovo-lacto-vegetarian (green) and vegan (blue).
(TIF)
Acknowledgments
This study was supported by the Italian Ministry of University and Research [MIUR] PRIN 2010–2011 program (http://www.diet4microgut.it). The funders played no role in the design of the study, the data collection and analysis, the decision to publish, or in the preparation of the manuscript. We are grateful to Marco Gobbetti for the coordination of the Diet4Microgut proj-ect and to Danilo Ercolini for his critical reading and improvement of the manuscript.
Author Contributions
Conceived and designed the experiments: RDC GC EN LC. Performed the experiments: IF MDA ST LV EB KR. Analyzed the data: IF GC. Contributed reagents/materials/analysis tools: MDA GC EN LC. Wrote the paper: IF RDC MDA ST LV KR GC LC.
References
1. O’Hara AM, Shanahan F. The gut flora as a forgotten organ. EMBO Rep. 2006; 7:688–93. PMID: 16819463
2. Eckburg PB, Bik EM, Bernstein CN, Purdom E, Dethlefsen L, Sargent M, et al. Diversity of the human intestinal microbial flora. Science. 2005; 308:1635–8. PMID:15831718
3. Lewis JD. Analysis of the human gut microbiome and association with disease. Clin Gastroenterol Hepatol. 2013; 11:774–7. doi:10.1016/j.cgh.2013.03.038PMID:23643636
4. Foerster J, Maskarinec G, Reichardt N, Tett A, Narbad A, Blaut M, et al. The Influence of Whole Grain Products and Red Meat on Intestinal Microbiota Composition in Normal Weight Adults: A Randomized Crossover Intervention Trial. PLoS One. 2014; 9:e109606. doi:10.1371/journal.pone.0109606PMID: 25299601
5. Agans R, Rigsbee L, Kenche H, Michail S, Khamis HJ, Paliy O. Distal gut microbiota of adolescent chil-dren is different from that of adults. FEMS Microbiol Ecol. 2011; 77:404–12. doi:10.1111/j.1574-6941. 2011.01120.xPMID:21539582
6. Claesson MJ, Jeffery IB, Conde S, Power SE, O’Connor EM, Cusack S, et al. Gut microbiota composi-tion correlates with diet and health in the elderly. Nature. 2012; 488:178–84. doi:10.1038/nature11319 PMID:22797518
7. Tyakht A V, Kostryukova ES, Popenko AS, Belenikin MS, Pavlenko A V, Larin AK, et al. Human gut microbiota community structures in urban and rural populations in Russia. Nat Commun. 2013; 4:2469. doi:10.1038/ncomms3469PMID:24036685
8. De Filippo C, Cavalieri D, Di Paola M, Ramazzotti M, Poullet JB, Massart S, et al. Impact of diet in shap-ing gut microbiota revealed by a comparative study in children from Europe and rural Africa. Proc Natl Acad Sci USA. 2010; 107:14691–6. doi:10.1073/pnas.1005963107PMID:20679230
9. David LA, Maurice CF, Carmody RN, Gootenberg DB, Button JE, Wolfe BE, et al. Diet rapidly and re-producibly alters the human gut microbiome. Nature. 2014; 505:559–63. doi:10.1038/nature12820 PMID:24336217
10. Mai V, McCrary QM, Sinha R, Glei M. Associations between dietary habits and body mass index with gut microbiota composition and fecal water genotoxicity: an observational study in African American and Caucasian American volunteers. Nutr J. 2009;84–9.
11. Wu GD, Chen J, Hoffmann C, Bittinger K, Chen Y-Y, Keilbaugh SA, et al. Linking long-term dietary pat-terns with gut microbial enterotypes. Science. 2011; 334:105–8. doi:10.1126/science.1208344PMID: 21885731
12. Jaquet M, Rochat I, Moulin J, Cavin C, Bibiloni R. Impact of coffee consumption on the gut microbiota: a human volunteer study. Int J Food Microbiol. 2009; 130:117–21. doi:10.1016/j.ijfoodmicro.2009.01. 011PMID:19217682
13. Le Huërou-Luron I, Blat S, Boudry G. Breast- v. formula-feeding: impacts on the digestive tract and im-mediate and long-term health effects. Nutr Res Rev. 2010; 23:23–36. doi:10.1017/
S0954422410000065PMID:20450531
14. Putignani L. Human gut microbiota: onset and shaping through life stages and perturbations. Putignani L, editor. Frontiers Media SA; 2013. doi:10.3389/fcimb.2012.00144PMID:23189272
15. Bianchi F, Rossi EA, Sakamoto IK, Tallarico Adorno MA, Van de Wiele T, Sivieri K. Beneficial effects of fermented vegetal beverages on human gastrointestinal microbial ecosystem in a simulator. Food Res Int. 2014; 64:43–52.
16. Chiba M, Abe T, Tsuda H, Sugawara T, Tsuda S, Tozawa H, et al. Lifestyle-related disease in Crohn’s disease: Relapse prevention by a semi-vegetarian diet. World J Gastroenterol. 2010; 16:2484–95. PMID:20503448
17. McEvoy CT, Temple N, Woodside J V. Vegetarian diets, low-meat diets and health: a review. Public Health Nutr. 2012; 15:2287–94. doi:10.1017/S1368980012000936PMID:22717188
18. Scott KP, Gratz SW, Sheridan PO, Flint HJ, Duncan SH. The influence of diet on the gut microbiota. Pharmacol Res. 2013; 69:52–60. doi:10.1016/j.phrs.2012.10.020PMID:23147033
19. Soare A, Khazrai YM, Del Toro R, Roncella E, Fontana L, Fallucca S, et al. The effect of the macrobiotic Ma-Pi 2 diet vs. the recommended diet in the management of type 2 diabetes: the randomized con-trolled MADIAB trial. Nutr Metab. 2014; 11:39. doi:10.1186/1743-7075-11-39PMID:25302069 20. Woodmansey EJ. Intestinal bacteria and ageing. J Appl Microbiol. 2007; 102:1178–86. PMID:
17448153
21. Hayashi H, Sakamoto M, Benno Y. Fecal microbial diversity in a strict vegetarian as determined by mo-lecular analysis and cultivation. Microbiol Immunol. 2002; 46:819–31. PMID:12597356
22. Kim M-S, Hwang S-S, Park E-J, Bae J-W. Strict vegetarian diet improves the risk factors associated with metabolic diseases by modulating gut microbiota and reducing intestinal inflammation. Environ Microbiol Rep. 2013; 5:765–75. doi:10.1111/1758-2229.12079PMID:24115628
23. Tap J, Mondot S, Levenez F, Pelletier E, Caron C, Furet J-P, et al. Towards the human intestinal micro-biota phylogenetic core. Environ Microbiol. 2009; 11:2574–84. doi:10.1111/j.1462-2920.2009.01982.x PMID:19601958
24. Matijašić BB, Obermajer T, Lipoglavšek L, Grabnar I, Avguštin G, Rogelj I, et al. Association of dietary type with fecal microbiota in vegetarians and omnivores in Slovenia. Eur J Nutr. 2014; 53:1051–64. doi: 10.1007/s00394-013-0607-6PMID:24173964
25. Ruengsomwong S, Korenori Y, Sakamoto N, Wannissorn B, Nakayama J, Nitisinprasert S. Senior Thai Fecal Microbiota Comparison Between Vegetarians and Non-Vegetarians Using PCR-DGGE and Real-Time PCR. J Microbiol Biotechnol. 2014; 24:1026–33. PMID:24743571
26. Francavilla R, Calasso M, Calace L, Siragusa S, Ndagijimana M, Vernocchi P, et al. Effect of lactose on gut microbiota and metabolome of infants with cow’s milk allergy. Pediatr Allergy Immunol. 2012; 23:420–27. doi:10.1111/j.1399-3038.2012.01286.xPMID:22435727
27. Ceuppens S, Li D, Uyttendaele M, Renault P, Ross P, Ranst M Van, et al. Molecular methods in food safety microbiology: interpretation and implications of nucleic acid detection. Compr Rev Food Sci Food Saf. 2014; 13:551–77.
28. Tannock G, Munro K, Bibiloni R. Impact of consumption of oligosaccharide-containing biscuits on the fecal microbiota of humans. 2004; 70:2129–36. PMID:15066805
29. Maukonen J, Mättö J, Satokari R, Söderlund H, Mattila-Sandholm T, Saarela M. PCR DGGE and RT-PCR DGGE show diversity and short-term temporal stability in the Clostridium coccoides-Eubacterium
rectalegroup in the human intestinal microbiota. FEMS Microbiol Ecol. 2006; 58:517–28. PMID: 17117993
30. Muyzer G, De Waal EC, Uitterlinden AG. Profiling of complex microbial populations by denaturing gradi-ent gel electrophoresis analysis of polymerase chain reaction-amplified genes coding for 16S rRNA. Appl Envir Microbiol. 1993; 59:695–700. PMID:7683183
31. Ferris MJ, Muyzer G, Ward DM. Denaturing gradient gel electrophoresis profiles of 16S rRNA-defined populations inhabiting a hot spring microbial mat community. Appl Envir Microbiol. 1996; 62:340–46. 32. Vauterin L, Vauterin P. Computer-aided objective comparison of electrophoresis patterns for grouping
and identification of microorganisms. Eur. J. Clin.Microbiol. 1992:37–41.
33. HammerØ, Harper D a. T, Ryan PD. Paleontological statistics software package for education and data analysis. Palaeontol Electron. 2001; 4:9–18.
34. Wu GD, Compher C, Chen EZ, Smith S a., Shah RD, Bittinger K, et al. Comparative metabolomics in vegans and omnivores reveal constraints on diet-dependent gut microbiota metabolite production. Gut. 2014;1–10. doi:10.1136/gutjnl-2014-307480PMID:25183202
35. Zimmer J, Lange B, Frick J-S, Sauer H, Zimmermann K, Schwiertz a, et al. A vegan or vegetarian diet substantially alters the human colonic faecal microbiota. Eur J Clin Nutr. 2012; 66:53–60. doi:10.1038/ ejcn.2011.141PMID:21811294
36. Bertrand X, Dufour V, Millon L, Beuvier E, Gbaguidi-Haore H, Piarroux R, et al. Effect of cheese con-sumption on emergence of antimicrobial resistance in the intestinal microflora induced by a short course of amoxicillin-clavulanic acid. J Appl Microbiol. 2007; 102:1052–59. PMID:17381749 37. Gafan G, Lucas V, Roberts G. Statistical analyses of complex denaturing gradient gel electrophoresis
profiles. J Clin Microbiol. 2005; 43:3971–78. PMID:16081938
38. Yatsunenko T, Rey FE, Manary MJ, Trehan I, Dominguez-Bello MG, Contreras M, et al. Human gut microbiome viewed across age and geography. Nature. 2012; 486:222–27. doi:10.1038/nature11053 PMID:22699611
39. Hobbs ME, Williams HJ, Hillerich B, Almo SC, Raushel FM. l-Galactose metabolism in Bacteroides vul-gatus from the human gut microbiota. Biochemistry. American Chemical Society; 2014; 53:4661–70. 40. Cecchini D, Laville E, Laguerre S, Robe P, Leclerc M, Doré J, et al. Functional metagenomics reveals
novel pathways of prebiotic breakdown by human gut bacteria. PLoS One. 2013; 8:e72766. doi:10. 1371/journal.pone.0072766PMID:24066026