ArcHistoR EXTRA 6 (2019)
www.archistor.unirc.it
La Mediterranea verso iL 2030
studi e ricerche sul patrimonio storico e sui paesaggi antropici, tra conservazione e rigenerazione
a cura di Marina Mistretta, Bruno Mussari, Adolfo Santini
t h e M e d i t e r r a n e a t o w a r d s 2 0 3 0 s t U d i e s a n d r e s e a r C h o n h i s t o r i C a L h e r i t a G e a n d a n t h r o P i C L a n d s C a P e s , C o n s e r vat i o n a n d r e G e n e r at i o n ISSN 2384-8898 ISBN 978-88-85479-08-1 Supplemento di ArcHistoR 12/2019
Vincenzo Barrile, Antonino Fotia
[email protected], [email protected]
Rischio sismico: monitoraggio GPS/GIS e applicazioni di reti neurali per il controllo di una faglia attiva nell’area di Castrovillari
Il monitoraggio dei fenomeni geodinamici è sempre in continua evoluzione. La disponibilità di big data acquisiti nel tempo, consente di creare modelli specifici in grado di simulare la situazione in questione, tuttavia la predizione dei terremoti è ancora scientificamente impossibile. I terremoti si presentano a grappoli e le scosse di terremoto maggiori sono preceduti da piccole scosse. L’applicazione di appositi modelli matematici ai dati ricavati dalla misurazione degli sciami, potrebbe fornire come risultato un valore percentuale relativo alla probabilità che in una determinata regione possa accadere un evento sismico di data rilevanza. Un sistema di previsione probabilistico dei fenomeni sismologici può aiutare le autorità e le amministrazioni pubbliche a prendere decisioni pratiche o fare scelte decisive per la vita dei cittadini o di gestione del patrimonio culturale. L’obiettivo del seguente lavoro è quello di analizzare i risultati di uno sperimentale sistema predittivo sviluppato dal Laboratorio di Geomatica di Reggio Calabria. Tale sistema, basato su reti neurali, è stato sviluppato in modo da calcolare la probabilità di accadimento di un evento sismico in funzione degli scostamenti superficiali di punti di una rete di monitoraggio in relazione ad eventi avvenuti nel loro intorno. A tale scopo sono stati utilizzati i dati in possesso dell'istituto Nazionale di Geofisica e Vulcanologia correlati con i dati rilevati da una sperimentale rete GPS di monitoraggio, posizionata a cavallo della faglia attiva di Castrovillari (Calabria, Italia).
t h e M e d i t e r r a n e a t o w a r d s 2 0 3 0
s t U d i e s a n d r e s e a r C h o n h i s t o r i C a L h e r i t a G e a n d a n t h r o P i C L a n d s C a P e s , C o n s e r vat i o n a n d r e G e n e r at i o n
Seismic Risk: GPS/GIS Monitoring and Neural Network
Application to Control Active Fault in Castrovillari Area
(South Italy)
Vincenzo Barrile, Antonino Fotia
italy is one of the countries with the greatest seismic risk in the Mediterranean, due to the frequency of earthquakes that have historically affected its territory and the intensity that some of them have reached, resulting in significant social and economic impact. Given the importance of the artistic and architectural heritage present on the peninsula, the focus is on new strategies for reducing risk from natural disasters.
The prediction of earthquakes is still scientifically impossible: the earthquake shock is the result of a complex system of factors and events that occur well below the earth’s crust. the magnitude and timing of a seismic event depends, for example, on the energy accumulated at a fault point and the level of “stress” reached at that precise point in the earth’s crust. obtaining precise measurements of these values would require mileage drilling beneath the Earth’s surface and the installation of very sophisticated sensors, which are not yet developed1.
However, earthquakes occur in clusters: the major aftershocks are preceded by small “warning” tremors. when the intensity, frequency and proximity of these tremors increases, there is a seismic
swarm, a real wake-up call for seismologists and experts in natural disasters. it is not uncommon, in the same way, to measure surface movements of well-defined points, perhaps straddling active faults. Applying, therefore, special mathematical models to the data obtained from the measurement of swarms and the displacements of cornerstones placed on a fault, it can be possible to obtain the probability that in a certain region a major seismic event can happen.
Using all this data, the proposed tool would allow the assessment of “short-term seismic hazard” thus obtaining a percentage value relative to the probability of an earthquake occurring in each region, shown in a Gis system.
The potential of the instrument would allow the authorities, to prepare the emergency response in time and to ensure the physical safety of citizens, and for citizens to be informed about the risks that occur on a daily basis.
Geo-Topographical Characteristics of the Castrovillari Fault
As known, Calabria is in a very complete geo-dynamic position and at high seismic risk. It has, in fact, a very high seismic hazard (for the frequency and intensity of the phenomena that occurred in the historical era), a very high vulnerability (for fragility of buildings, infrastructure, industrial, productive and a very high exposure (for density of housing and the presence of a historical, artistic and monumental heritage in areas affected by active faults). For this reason, it is therefore at high seismic risk, in terms of casualties, damage to buildings and direct and indirect costs are expected as a result of a strong earthquake2.
Calabria is crossed by a system of faults in full activity (red lines in the fig. 1), which develop from the Crati Valley, passes through the Strait of Messina and ends in eastern Sicily. These faults represent sectors of high seismic risk and almost all of the catastrophic earthquakes that hit Calabria in the historical era have originated here: the earthquake of the Crati Valley of 1183, the earthquake of Reggio and Messina in 1908, the crisis southern Calabria earthquakes of 1783, earthquakes in central Calabria in 1638 and 1905, the “cosentino” earthquakes of 1835, 1854 and 18703.
the Castrovillari Fault is the most northerly Calabrian fault, it is located on the southwest side of the Pollino range and consists of three main trend nnw escarpments, facing the southwest,
2. d’Amico et alii 2009. 3. Barzaghi 2002.
Seismic risk
Figure 1. Calabria’s active faults (red) and Earthquake (yellow) (Geomatics Lab - DICEAM Mediterranea University).
stretching for 10-13 km. Grading tracks have a complex geometry: they are parallel to each other through an area 1-2 km wide and form a step pattern.
GPS /GIS Data (Castrovillari GPS’ Network)
As part of a project to monitor the active faults, starting from the network established in collaboration with the Polytechnic of Milan (that installed the first GPS network in Castrovillari), the laboratory of Geomatics of Mediterranean University, right on the Castrovillari fault placed a GPs network whose points are constantly detected from 2007 to date (weekly/monthly basis).the network counts some points straddling the Castrovillari active fault and another three on exteriors area, located in the stable area, including two on the east side and one on the west side4.
table 1. Global parameters of compensation.
As known (with particular reference to active fault monitoring and control networks) a rigorous data acquisition would involve simultaneous use of a number of GPS receivers coinciding with the number of network cornerstones and materialisation on rock of the measuring points via pillars in order to reduce below the millimetre the centering error (the use of a steel antenna door, properly designed, ensures the stringent requirements mentioned above) performing measurements for consecutive days, with eight-hour observation windows for each day, 15-degree cut off angle and 15-hour sampling time5.
Unfortunately, due to the lack of funds, instrumentation (3 GPS receivers) and staff availability for such a long period of time, the measurement campaigns carried out by the Geomatics Laboratory (from 2007 to date on a monthly and/or weekly basis), used the triangulation method from time to time on three network points (without, however, performing the centering with steel antenna as originally designed), although it still used the same test network initially materialised.
although the survey methodology used provides lower precision than originally designed (refer to the bibliography for a comprehensive description)6, it still guarantees high standards for subsequent
global compensation analyses of the test network. 5. Barrile et alii 2016.
Seismic risk
Figure 2. Example of representation of displacements between 2018 and 2019 (Geomatics Lab - DICEAM Mediterranea University). The accurate data processing and the global compensation of the entire network furnishes the coordinates of the network at a given time of measurement and therefore the use of proven observation processing algorithms subsequently determines the significance of network point coordinate changes resulting from repeated GPS surveys over time without prior information on their stability (the ultimate goal of the analysis)7.
The statistics and parameters obtained from the processing and compensation of data acquired in the years 2007 to date are reported in tab. 1, as an example.
Depending on the results obtained by setting different offsets for the common datum, it also was possible to create a diagram illustrating the movements. In fig. 2, for example, movements occurring between 2018 and 2019 are shown.
The above activities implemented within a GIS8, demonstrate the meaningfulness of the
movement on GPS network testing repeated over that time, that have common points without a priori information on the stability of the network point coordinates. In detail, an assigned series of GPS data repeated over that time, through the GIS potentiality it is possible to obtain:
7. Barbarella, Crespi, Fiani 1995. 8. Barrile, Meduri, Bilotta 2014.
Figure 3. Transformation and calculus movement with a strict adjustment in the Datum (Geomatics Lab - DICEAM Mediterranea University). - a free adjustment of the single networks;
- the Geodetic Datum’s choice (set of the network points statistically stable) through statistical test;
- the estimate of the new coordinates of the network points on identified Datum (transformation);
- a constrained networks adjustment, singularly in the identified Datum; - calculation displacements of the network points.
In fig. 3, the proposed GIS for the above purposes is also reported Seismic Data
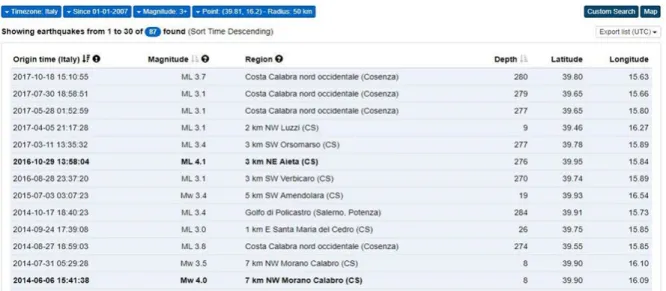
The seismic data used in our work (figg. 4-6) are those provided by the National Institute of Geophysics and Volcanology (seismic surveys carried out 24 hours a day, 7 days a week throughout the country), related to:
Seismic risk
Figure 4. Example of events that occurred around (radius 50 km) of Castrovillari (elaborated from INVG website). - events that occurred around (radius 50 km of) Castrovillari;
- a time window from 2007 to the present day; - seismic events with a magnitude greater than 3; - seismic events with magnifier less than 3. Predicting Large Aftershock Sequences
at this point, using a neural network, we tried to link the displacement data to the seismic data, to verify the possibility to establish a risk map, which can indicate the probability of a new earthquake occurring and its magnitude (greater or less than 3), in a defined area, at the occurrence of a seismic event.
the occurrence of a large main-shock earthquake is typically triggers a secondary seismic shock, known as an aftershock. Aftershocks resemble the behaviour of a decaying probability model and are said to be just as dangerous as main-shock sequences. The magnitude of an aftershock depends significantly on the time of occurrence and the magnitude of the main-shock.
Above, figure 5. Seismic events with a magnitude greater than 3 from 2007 to date (elaborated from INVG website); below, figure 6. Seismic events with a magnitude lower than 3 from 2007 to date (elaborated from INVG website).
Seismic risk
Analysis of the data shows how the highest aftershock reading was observed away from the ruptured main shock, suggesting that the transfer of stress from the main shock to the aftershock is static. From a statistical study of the aftershock sequences, we found that they are generally surface-oriented events, although with magnitudes below the surface of the earth9.
Neural networks are non-linear structures of statistical data organised as modelling tools. They can be used to simulate complex relationships between inputs and outputs that other analytical functions fail to represent.
Our goal was to test a machine learning classifier that predicts the correct class (low entity or high entity) based on x and y coordinates (network points’ displacement and epicentre earthquake)
we built a 3-layer neural network with an input layer, a hidden layer, and an output layer. the number of nodes in the input layer is determined by the dimensionality of our data. similarly, the number of nodes in the output layer is also determined by the number of classes that we have. the network input are x and y coordinates (network points’ displacement and epicentre earthquake) and its output will be two probabilities, one for class 0 (“magnitude < 3”) and one for class 1 (“magnitude > 3”).
the learning used to train the network is “reinforcement learning”, in which an appropriate algorithm aims to identify a certain modus operandi, starting from a process of observation of the external environment; each action has an impact on the environment, and the environment produces feedback that guides the algorithm itself in the learning process. such a class of problems posits an agent, endowed with perception skills, who explores an environment in which he takes a series of actions. The environment itself provides an incentive or disincentive in response, as appropriate. The reinforcement learning algorithms ultimately attempt to determine a policy to maximise the cumulative incentives received by the agent during his exploration of the problem. Reinforcement learning differs from supervised learning because no input-output pairs of known examples are ever presented, nor explicitly suboptimal actions be corrected. In addition, the algorithm is focused on online performance, which involves balancing exploration of unknown situations with exploitation of current knowledge10.
we can choose the dimensionality (number of nodes) of the hidden layer. the more nodes we insert into the hidden layer the more complex functions that we will be able to adapt. But greater dimensionality has a high computational cost. In fact, we need more computation to make predictions
9. Aslani, Miranda 2005. 10. D’Amico et alii 2009.
Figure 7. Forward propagation scheme(Geomatics Lab - diCeaM Mediterranea University).
and learn network parameters. More parameters also mean that we are more inclined to outperform our data.
For our hidden layer, we chose the “tanh” activation function. It is an non-unilinear activation feature that allows us to adapt nonlinear assumptions. One positive property of these functions is that their derivative can be calculated using the value of the original function.
Since we require our network to generate probabilities, the activation function for the output layer will be softmax, which is simply a way to convert raw scores into probabilities.
Our network makes predictions using forward propagation, which is a series of array multiplications and the application of the activation functions that we defined above. We have to find parameters that minimise the error on our training data, to learn parameters for our network. To define the error we use a common choice with the softmax output function (the categorical cross-entropy loss also known as negative log likelihood). The second step is done by the sum of our training examples and added to the loss if we predicted the incorrect class. the further away the two probability distributions y (the correct labels) and (our predictions) are the greater our loss will be. By finding parameters that minimise the loss we maximise the likelihood of our training data.
So, bearing in mind the large amount of network point displacement data resulting from GPS/GIS data processing and the equally large amount of earthquake data resulting from INGV), the neural network tested, therefore, returns, in a given region (study area) the probability of a seismic event
Seismic risk
Figure 8. Map of risk (green area: area with a probability of magnitude<3, Blu area: area with a probability of magnitude>3; red: earthquake magnitude<3; dark blue: earthquake magnitude >3) (Geomatics Lab - DICEAM Mediterranea University).
of magnitude less or greater than 3 in relation to the occurrence of an event recorded by INGV in the approximately 50 km from the study area.
The result can be displayed on GIS through suitable functions (fig. 8).
Clearly the results obtained are only in the initial experimental phase. It must be said that, as we know it is not possible to predict earthquakes and that surely the unique link or correlation between surface movements and earthquakes is certainly reductive entering into play (in the field of prevention) a lot of parameters (geophysical precursors: anomalies in the speed and characteristics of seismic waves P and S - variations in the magnetic and electrical characteristics of rocks and the atmosphere; seismological precursors: before a major seismic event a series of micro-tremors can occur, detectable only through instruments, or a change in the distribution of seismicity; geodesic precursors: changes in altitude, position, tilt of parts of the ground surface and speed of measured displacements; geochemical precursors: variation in the concentration in groundwater and ground
gases of certain radioactive chemical elements, including radon gas; hydrological precursors: variation in the level of the aquifer subsoil, as measured in the wells, and so on). It is also worth noting that the neural network used and implemented for this work comes from an experimental test, initially built and tested with different data and application finalities that are also different) and therefore it is alsocertainly susceptible to more improvements and enhancements to achieve better and reliable results. However, the experimentation carried out, although requiring further testing and analysis (both on the quantification of GPS data and their accuracy), to date, unexpectedly even for the writer, has nevertheless shown that, (maybe at random?) a certain link would seem to exist between displacements and earthquakes (which needs to be further investigated and ascertained in order to contribute to the definition of the mechanism of propagation of earthquakes) although applied to the forecasting of earthquake date intensity after verification. Conclusion
The large number of GPS data acquired over time makes it possible to highlight a speed of displacement of the earth’s crust in the active fault Castrovillari; this shift is in the order of 30 (mm/year). Geological studies carried out in the subsoil show a moving speed of 3-9 (mm/year). The ambitious study of the surface deformation of the crust in the area of Castrovillari aims to highlight the possibility of a scientific comparison between subsurface deformations and surface deformations, in order to improve the knowledge of the geo-structural fault active. Furthermore, the area of Castrovillari, for the presence of such active faults, should be considered as a potential generating future earthquake with higher magnitude.
through the appropriate use of a neural network specially trained and tested on historical data made available by INGV, it was possible to estimate, for every earthquake considered separately, its tracking of isoseismic lines beginning from known data and the intensity of the earthquake itself, both the geomorphological characteristics of the studied area. It was thus possible to implement a GIS layer of artificial intelligence called Overlay AI that, intersecting in a relevant way the isosisme, gives sufficient information about the seismic risk of the area analysed. That achieved an acceptable preliminary result because, if properly overlaid with layers depicting such socio-economic characteristics present therein, can adequately explain the experimental methodology for obtaining a preliminary map of seismic hazard at detailed scale directly integrated in Gis environment, for the purposes of decision support to the various local authorities for the protection and safeguarding of the public.
Seismic risk
Bibliography
Aslani, Miranda 2005 - H. Aslani, E. Miranda, Probabilistic Earthquake Loss Estimation and Loss Disaggregation in Buildings (stanford, Ca, Usa, department of Civil and environmental engineering, stanford University, report no. 157 https://searchworks.stanford.edu/view/kw177ns9250 (accessed 21 February 2019).
Barbarella, Crespi, Fiani 1995 - M. Barbarella, M.Crespi, M. Fiani, Analisi statistica della significatività degli spostamenti, in Atti del 13º Convegno del Gruppo Nazionale di Geofisica della Terra Solida, (Roma, 23-25 novembre), Esagrafica Roma 1994, pp. 319-330.
Barrile, Crespi 1995 - V. Barrile, M. Crespi, Compensazioni ed analisi di rilievi GPS per il controllo di deformazioni nell’area Etnea, in Atti del 14º Convegno del Gruppo Nazionale di Geofisica della Terra Solida, (Roma, 23-25 ottobre 1995), Esagrafica Roma 1995, pp. 309-318.
Barrile, Meduri, Bilotta 2014 - V. Barrile, G.M. Meduri, G. Bilotta, Monitoring and GPScontrols, over time, of theactive fault in Castrovillari. Latest Trends, in Energy, Environment And Development, Proceedings of 7th International Conference On Environmental And Geological Science And Engineering (EG ‘14) (Salerno, 3th-5th of June 2014), Energy, Environmental And Structural Engineering Series, Atlantis Press, Paris 2014, pp. 169-175.
Barrile, Meduri, Bilotta 2014 - V. Barrile, G.M. Meduri, G. Bilotta, An open GIS for the significance analysis of displacements arising from GPS networks repeated over time: an application in the area of Castrovillari, in «WSEAS Transactions on Signal Processing», 2014, 10, pp. 582-591.
Barrile et alii 2016 - V. Barrile et alii, GPS- GIS and Neural Networks for Monitoring Control, Cataloging the Prediction and Prevention in Tectonically Active Areas, in «Procedia - Social and Behavioral Sciences», 2016, 223, pp. 909-914.
Barzaghi 2002 - R. Barzaghi, Determinazione dello stile di deformazione e dello stato di sforzo dell’arco Calabro. Framework Program 2000–2002, Annual Report –1st Year Of Activity, ftp://ftp.ingv.it/pro/gndt/Att_scient/Pe2001_RelAnn/Barzaghi/ PE2001_RelAnn_Barzaghi_ita.pdf (accessed 12 January 2019).
Betti, Crespi, Sguerso 1994 - B. Betti, M. Crespi, D. Sguerso, Stabilità del sistema di riferimento nella determinazione di reti GPS, in «Bollettino Sifet»,1994, 4, pp. 67-88.
Bernardini et alii 2007 - A. Bernardini et alii, Vulnerabilità e previsione di danno a scala territoriale secondo una metodologia macrosismica coerente con la scala EMS-98, in L’ingegneria Sismica in Italia, anidis, Xii Convegno nazionale (Pisa 10-14 giugno 2007), Edizioni Plus, Pisa 2007, pp. 1-9.
Cinti et alii 2002 - F.R. Cinti et alii, New constraints on the seismic history of the Castrovillari fault in the Pollino Gap(Calabria, Southern Italy), in «Journal of seismology», 2002, 6, pp. 199-217.
D’Amico et alii 2009 - S. D’Amico et alii, Heuristic Advances In Identifying Aftershocks, in «seismic sequences. Computers & Geosciences», 2009, 35, pp. 245-254.
D’Amico et alii 2011 - S. D’Amico et alii, A seismic vulnerability model for urban scenarios. Quick method for evaluation of roads vulnerability in emergency, in «Ingegneria Sismica», 2011, 28, pp. 31-43.
Parrillo et alii 2015 - Parrillo et alii, Neural Networks Radial Basis Function and Method Delta/Sigma for the Forecast of Strong Replicas, Atti del 34° Convegno del Gruppo Nazionale di Geofisica della Terra Solida, (Trieste, 17-19 novembre), Esagrafica, Roma 2015, pp. 197-200.