arXiv:astro-ph/0412057v1 2 Dec 2004
Josep M. Paredes
Departament d’Astronomia i Meteorologia, Universitat de Barcelona, Av. Diagonal 647, 08028 Barcelona, Spain
September 10, 2004
Abstract. The extragalactic analogs of the microquasars, the quasars, are strong γ-ray emitters at GeV energies. It is expected that microquasars are also γ-ray sources, because of the analogy with quasars and because theoretical models predict the high-energy emission. There are two microquasars that appear as the possible counterparts for two unidentified high-energy γ-ray sources.
Keywords:X-rays: binaries - stars: individual: LS 5039, LS I +61 303 - gamma-rays: observations
1. Introduction
The microquasar phenomenon has grown in prominence recently, as it has been found that most X-ray binaries show radio emission, associ-ated with jets - collimassoci-ated beams of relativistic plasma. The ejection takes place in a bipolar way perpendicular to the accretion disk as-sociated with the compact star, a black hole or a neutron star. The word microquasar itself was chosen by the analogy of these astro-nomical objects with quasars and other active galactic nuclei (AGNs) at cosmological distances (Mirabel & Rodr´ıguez 1999). The analogy quasar-microquasar goes beyond a simple morphological resemblance. Today, there is growing evidence to think that the physics involved in both types of objects is the same, or at least very similar. The key difference would be the distinct order of magnitude of the most significant parameters, especially the mass of the compact object.
2. AGNs as γ-ray sources
AGNs are extragalactic sources whose spectra extend from radio waves to γ-rays. Thanks to the Compton Gamma Ray Observatory (CGRO) it is now well established that AGNs are strong γ-ray emitters. The Energetic Gamma Ray Experiment (EGRET) on board the CGRO produced the 3rd EGRET catalogue (Hartman et al. 1999) that con-tains 271 sources detected at energies > 100 MeV. Most of them (about 168 sources) remain unidentified and 72 of these unidentified sources
are at absolute Galactic latitudes lower than 10◦. The identified sources
are mainly AGNs (Thomson et al. 1995), and more AGNs are expected to be found among the still unidentified sources with high Galactic lat-itude. All of these detected AGNs are blazars; no radio-quiet AGNs has been identified so far in the EGRET data. In fact this is not surprising because blazars are able to generate high-energy particles that can pro-duce γ-rays via inverse Compton (IC) scattering, as well as present rel-ativistic beaming, which is important to avoid photon-photon collision and amplify the flux.
More than two dozen jets have been detected at X-rays in AGNs, with most of them being radio galaxies (both FRI and FRII). Although synchrotron self Compton (SSC) models cannot generally explain the level of X-ray emission, those models based on the IC scattering of seed photons of the nucleus and the CMB radiation by the relativistic electrons in the jet not only can better explain such X-ray levels but also can produce efficiently high-energy γ-ray emission (Tavecchio et al. 2000, Celotti et al. 2001).
3. X-ray binaries and microquasars
The most recent catalogue of High Mass X-ray Binaries (HMXBs) con-tains 131 sources (Liu et al. 2000), while the catalogue of Low Mass X-ray Binaries (LMXBs) amounts to 149 objects (Liu et al. 2001). Con-sidering both catalogues together, there are a total of 43 radio emitting sources. Some of these sources, those which we define as microquasars, show direct evidence for a relativistic radio jet (Rib´o 2002, Rib´o 2004), while many others show radio emission which is also almost certainly associated with a jet (Fender 2004).
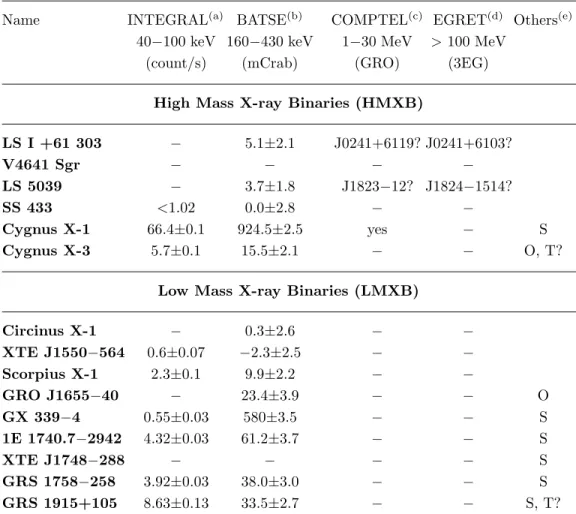
At the time of writing, a total of 15 microquasar systems have been identified. The observational data of these microquasars at energies from soft to very high-energy γ-rays, are quoted in Table I.
The top part of the table is reserved for HMXBs, while the bottom part contains those of low mass. In the second column of Table I we list their flux (count/s) and error or upper limit in the energy range of 40−100 keV obtained with the IBIS γ-ray imager on board INTEGRAL, covering the first year of data (Bird et al. 2004).
The Burst and Transient Source Experiment (BATSE), aboard the CGRO, monitored the high energy sky using the Earth occultation technique (EOT). A compilation of BATSE EOT observations has been published recently (Harmon et al. 2004). From this catalogue we have selected the data on microquasars in the energy range 160−430 keV in mCrab units and is listed in the third column.
Table I. High energy emission from microquasars
Name INTEGRAL(a) BATSE(b) COMPTEL(c) EGRET(d) Others(e)
40−100 keV 160−430 keV 1−30 MeV >100 MeV
(count/s) (mCrab) (GRO) (3EG)
High Mass X-ray Binaries (HMXB)
LS I +61 303 − 5.1±2.1 J0241+6119? J0241+6103? V4641 Sgr − − − − LS 5039 − 3.7±1.8 J1823−12? J1824−1514? SS 433 <1.02 0.0±2.8 − − Cygnus X-1 66.4±0.1 924.5±2.5 yes − S Cygnus X-3 5.7±0.1 15.5±2.1 − − O, T?
Low Mass X-ray Binaries (LMXB)
Circinus X-1 − 0.3±2.6 − − XTE J1550−564 0.6±0.07 −2.3±2.5 − − Scorpius X-1 2.3±0.1 9.9±2.2 − − GRO J1655−40 − 23.4±3.9 − − O GX 339−4 0.55±0.03 580±3.5 − − S 1E 1740.7−2942 4.32±0.03 61.2±3.7 − − S XTE J1748−288 − − − − S GRS 1758−258 3.92±0.03 38.0±3.0 − − S GRS 1915+105 8.63±0.13 33.5±2.7 − − S, T?
Notes:(a) The first IBIS/ISGRI soft gamma-ray galactic plane survey catalog
(Bird et al. 2004).(b)BATSE Earth occultation catalog, Deep sample results
(Harmon et al. 2004).(c)The first COMPTEL source catalogue (Sch¨onfelder
et al. 2000). (d) The third EGRET catalog of high-energy γ-ray sources
(Hartman et al. 1999).(e)S: SIGMA instrument onboard GRANAT satellite;
O: OSSE; T: TeV source.
Among the sources detected by the instrument COMPTEL (Sch¨onfelder et al. 2000), also aboard the CGRO, there is the microquasar Cygnus X-1, as well as two sources, GRO J1823−12 and GRO J0241+6119, pos-sibly associated with two other microquasars. See fourth column in Table I.
4. Microquasars associated with EGRET sources
According to the quasar-microquasar analogy (Mirabel & Rodr´ıguez 1999), one could also expect the jets in microquasars to be GeV emit-ters. Several models aimed to predict the high-energy γ-ray emission from microquasars have been developed during the last years. A general description of such models can be found in Romero (2004). Up to now, there are two HMXB microquasars, LS 5039 and LS I +61 303, that are associated with two EGRET sources.
4.0.1. LS 5039 / 3EG J1824−1514
The discovery of the microquasar LS 5039, and its possible association with a high-energy γ-ray source (E >100 MeV), provides observational evidence that microquasars could also be sources of high-energy γ-rays (Paredes et al. 2000). It is important to point out that this was the first time that an association between a microquasar and a high-energy γ-ray source was reported. This finding opened up the possibility that other unidentified EGRET sources could also be microquasars. LS 5039 is the only X-ray source from the bright ROSAT catalogue whose position is consistent with the high energy γ-ray source 3EG J1824−1514. LS 5039 is also the only object simultaneously detected in X-rays and radio which displays bipolar radio jets at sub-arcsecond scales. New observa-tions conducted with the EVN and MERLIN confirm the presence of an asymmetric two-sided jet reaching up to ∼1000 AU on the longest jet arm (Paredes et al. 2002, Rib´o 2002).
Recently, Collmar (2003) has reported the detection of an uniden-tified γ-ray source, GRO J1823−12, at galactic coordinates (l=17.5◦,
b=−0.5◦) by the COMPTEL experiment. This source is among the
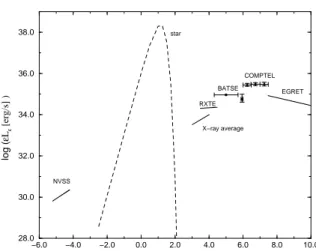
strongest COMPTEL sources. The source region, detected at a high significance level, contains several possible counterparts, LS 5039 being one of them. It is also worth noting that BATSE has detected this source at soft γ-rays (see Table I). Taking into account these observa-tional evidences, from radio to high-energy γ-rays, LS 5039 appears to be a very likely counterpart of the EGRET source 3EG J1824−1514. Figure 1 shows the observed spectral energy distribution of LS 5039.
4.0.2. LS I +61 303 / 3EG J0241+6103
After the discovery of relativistic jets in LS I +61 303, this source has been classified as a new microquasar (Massi et al. 2001, Massi et al. 2004). This object has also been proposed to be associated with the γ-ray source 2CG 135+01 (=3EG J0241+6103) (Gregory & Taylor 1978, Kniffen et al. 1997). Although the broadband 1 keV–100 MeV spectrum of LS I +61 303 remains uncertain, because OSSE and
COMP-−6.0 −4.0 −2.0 0.0 2.0 4.0 6.0 8.0 10.0 28.0 30.0 32.0 34.0 36.0 38.0 log ( ε Lε [erg/s] ) NVSS star X−ray average RXTE BATSE COMPTEL EGRET
Figure 1. Observed spectral energy distribution of LS 5039.
TEL observations were likely dominated by the quasar QSO 0241+622 emission, the EGRET angular resolution is high enough to exclude this quasar as the source of the high-energy γ-ray emission (Harrison et al. 2000). BATSE marginally detected the source, the quasar also being excluded as the origin of this emission (see Table I).
Recently, Massi (2004) has carried out a timing analysis of pointed EGRET observations (Tavani et al. 1998) suggesting a period of 27.4±7.2 days, in agreement with the orbital period of this binary system, of 26.496 days. This result, if confirmed, would clearly support the asso-ciation of LS I +61 303 with 3EG J0241+6103.
This microquasar also seems to be a fast precessing system. MER-LIN images obtained in two consecutive days show a change in the direction of the jets of about 50◦ that has been interpreted as a fast
precession of the system (Massi et al. 2004). If this is confirmed, it could solve the puzzling VLBI structures observed so far, as well as the short term variability of the associated γ-ray source 3EG J0241+6103. Up to now, the only existing radial velocity curve of LS I +61 303 was that obtained by Hutchings and Crampton (1981). Recently, after a spectroscopic campaign, an improved estimation of the orbital pa-rameters has been obtained (Casares et al. 2004). Here, we will just mention the new high eccentricity (e=0.72±0.15) and the periastron orbital phase at ∼0.2. These values are a key information for any interpretation of the data obtained at any wavelength.
Hall et al. (2003) gave upper limits on the emission associated to LS I +61 303 / 3EG J0241+6103 at very high-energy γ-rays from obser-vations performed by the Cherenkov telescope Whipple. Several models have been proposed to explore the high energy emission of this source
−6.0 −4.0 −2.0 0.0 2.0 4.0 6.0 8.0 10.0
log (Photon energy [eV] )
28.0 30.0 32.0 34.0 36.0 38.0 log ( ε Lε [erg/s] ) VLA I VLA II ROSAT ASCA STAR BATSE OSSE COMPTEL EGRET
Figure 2. Observed spectral energy distribution of LS I +61 303.
(e.g. Taylor et al. 1996, Punsly 1999, Harrison et al. 2000, Leahy 2004). The most recent theoretical work has been presented by Bosch-Ramon & Paredes (2004), who explore with a detailed numerical model if this system can both produce the emission and present the variability de-tected by EGRET (>100 MeV). Figure 2 shows the observed spectral energy distribution of the microquasar LS I +61 303.
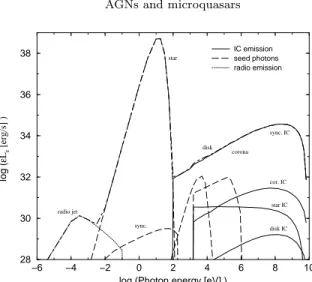
Bosch-Ramon et al. (2004) developed a detailed numerical model that includes both external and SSC scattering. The computed spec-tral energy distribution of a EGRET source high-mass microquasar is presented in Figure 3. Looking at the Figures 1 and 2, and comparing them with Figure 3, it is seen how the IC jet scenario reproduces fairly well the data, giving further suport to the proposal of microquasars as γ-ray sources.
5. VHE γ-ray sources
The very high energy sky map contains a reduced number of sources. The number of confirmed and probable catalogued sources presently amounts to fourteen (6 AGN, 3 pulsar wind nebulae, 3 supernova remnants, 1 starburst galaxy, and 1 unknown) (Ong 2003). Some micro-quasars have been observed in the energy range of TeV γ-rays with the imaging atmospheric Cherenkov telescopes, but none of them has been detected with high confidence yet. Historically, Cygnus X-3 was widely observed with the first generation of TeV instruments. Some groups claimed that they had detected Cygnus X-3 (Chadwick et al. 1985) whereas other groups failed to detect it (O’Flaherty et al. 1992). As the
−6 −4 −2 0 2 4 6 8 10 log (Photon energy [eV] )
28 30 32 34 36 38 log ( ε Lε [erg/s] ) IC emission seed photons radio emission disk IC star IC cor. IC sync. IC corona disk star sync. radio jet
Figure 3. Spectral energy distribution model of a high mass microquasar (Bosch-Ramon et al. 2004).
claimed detections have not been confirmed, and the instrumentation at this epoch was limited, these results have not been considered as positive detections by the astronomical community. The HEGRA ex-periment detected a flux of the order of 0.25 Crab from GRS 1915+105 during the period May-July 1996 when the source was in an active state (Aharonian & Heinzelmann 1998). This source has also been observed with Whipple, obtaining a 3.1σ significance (Rovero et al. 2002). More recently, an upper-limit of 0.35 Crab above 400 GeV has been quoted for GRS 1915+105 (Horan & Weekes 2003). LS I +61 303 was observed too, but was not detected in the TeV energy range (see Section 4).
Acknowledgements
I acknowledge partial support by DGI of the Ministerio de Ciencia y Tecnolog´ıa (Spain) under grant AYA2001-3092, as well as partial sup-port by the European Regional Development Fund (ERDF/FEDER).
References
Aharonian, F.A., Heinzelmann, G., 1998, Nucl. Phys. B., 60B, 193 Bird, A.J., Barlow, E.J., Bassani, L., et al., 2004, ApJ, 607, L33
Bosch-Ramon, V., Paredes, J.M., 2004, A&A, in press, [astro-ph/0407016]
Bosch-Ramon, V., Romero, G.E., Paredes, J.M., 2004, A&A, in press, [astro-ph/0405017]
Casares, J., Ribas, I., Paredes, J., Mart´ı, J., Allende Prieto, C., 2004, MNRAS, submitted
Chadwick, P.M., Dipper, N.A., Dowthwaite, J.C., et al., 1985, Nature, 318, 642 Celotti, A., Ghisellini, G., Chiaberge, M., et al., 2001, MNRAS, 321, L1
Fender, R.P., 2004, to appear in “Compact Stellar X-ray Sources,” (astro-ph/0303339)
Collmar, W., 2003, Proc. 4th Agile Science Workshop, Frascati (Rome) on 11-13 June 2003
Gregory, P. C. & Taylor, A. R. 1978, Nature, 272, 704
Hall, T.A., Bond, I.H., Bradbury, S.M., et al., 2003, ApJ, 583, 853 Harmon, B.A., Wilson, C.A., Fishman, G.J., et al., 2004, ApJS, 154, 585 Harrison, F.A., Ray, P.S., Leahy, D.A., et al., 2000, ApJ, 528, 454 Hartman, R.C., Bertsch, D.L., Bloom, S.D., et al., 1999, ApJS, 123 79 Horan, D., Weekes, T., 2003, private communication
Hutchings, J.B., Crampton, D., 1981, PASP, 93, 486
Kniffen, D.A., Alberts, W.C.K., Bertsch, D.L., et al., 1997, ApJ, 486, 126 Leahy, D.A., 2004, A&A, 413, 1019
Liu, Q.Z., van Paradijs, J., van den Heuvel, E.P.J. 2000, A&AS, 147, 25 Liu, Q.Z., van Paradijs, J., van den Heuvel, E.P.J. 2001, A&A, 368, 1021 Massi, M., Rib´o, M., Paredes, J.M., et al., 2001, A&A, 376, 217
Massi, M., Rib´o, M., Paredes, J.M., et al., 2004, A&A, 414, L1 Massi, M., 2004, A&A, 422, 267
Mirabel, I.F., & Rodr´ıguez, L.F. 1999, ARA&A, 37, 409
O’Flaherty, K.S., Cawley, M.F., Fegan, D.J., et al., 1992, ApJ, 396, 674 Ong, R.A., 2004, astro-ph/0304336
Paredes, J.M., Mart´ı, J., Rib´o, M., & Massi, M., 2000, Science, 288, 2340 Paredes, J.M., Rib´o, M., Ros, E., et al., 2002, A&A, 393, L99
Punsly, B., 1999, ApJ, 519, 336
Rib´o, M., 2002, PhD Thesis, Universitat de Barcelona
Rib´o, M. 2004, in ASP Conference Series: ”Future Directions in High Resolution Astronomy: A Celebration of the 10th Anniversary of the VLBA”, J. D. Romney & M. J. Reid (eds.), [astro-ph/0402134]
Romero G.E., 2004, ChJAA, in press., [astro-ph/0407461] Rovero, A.C., Fegan, S., Weekes, T.C., 2002, BAAA, 45, 66
Sch¨onfelder, V., Bennett, K., Blom, J.J., et al., 2000, A&AS, 143, 145 Tavani et al., 1998, ApJ, 497, L89
Tavecchio, F., et al., 2000, ApJ, 544, L23