UNIVERSITY
OF TRENTO
DIPARTIMENTO DI INGEGNERIA E SCIENZA DELL’INFORMAZIONE
38050 Povo – Trento (Italy), Via Sommarive 14 http://www.disi.unitn.it
D6.8: SUMMATIVE REPORT ON THE USE OF OPENKNOLEDGE FRAMEWORK IN E-RESPONSE: INTEGRATION AND EVALUATION RESULTS
Gaia Trecarichi, Veronica Rizzi, Lorenzino Vaccari and Maurizio Marchese
February 2009
OpenKnowledge
FP6-027253
D6.8: Summative report on the use of
OpenKnoledge framework in e-Response:
integration and evaluation results
Gaia Trecarichi1, Veronica Rizzi1, Lorenzino Vaccari1, Maurizio Marchese1 1 University of Trento
{gtrecari;vrizzi;vaccari;marchese}@disi.unitn.it
Report Version: final
Report Preparation Date: 31/12/08 Classification: deliverable 6.8
Contract Start Date: 1.1.2006 Duration: 36 months
Project Co-ordinator: University of Edinburgh (David Robertson) Partners: IIIA(CSIC) Barcelona
Vrije Universiteit Amsterdam University of Edinburgh KMI, Open University University of Southampton University of Trento
Abstract
This deliverable aims at investigating the capability of the Open-Knowledge framework to support centralised as well as decentralised architectures for information gathering in emergency response man-agement. For this purpose, we developed an agent-based e-Response simulation environment fully integrated with the OpenKnowledge in-frastructure and through which existing emergency plans are modelled and simulated. Preliminary results show (1) the overall scalability of the OpenKnowledge kernel to realistic use cases; (2) the capability of the OpenKnowledge framework in supporting the two afore-mentioned architectures and, under ideal assumptions, a comparable performance in both cases.
1
Introduction
All phases of emergency response management - that in the following we will reference as emergency response (e-Response) activities - depend on data from a variety of sources. Moreover, during an emergency it is critical to have the right data, at the right time, displayed logically and contextually, to respond and take the appropriate actions. At present, most of the informa-tion management infrastructures required for dealing with emergencies are based on centralised architectures that (i) are specifically designed prior to the emergency, (ii) gather centrally the available information, (iii) distribute it upon request to the appropriate agents (e.g., emergency personnel, doctors, citizens). While centralised infrastructures provide a number of significant advantages (in terms of quality control, reliability, trustworthiness, sustain-ability, etc.), they also present some well-known intrinsic problems (e.g., physical and conceptual bottlenecks, communication channel overloads, sin-gle point of failure). All these issues are taken into account in the design and deployment of current mission-critical centralised systems. However, infor-mation sharing breakdowns are still possible and have occurred also in recent emergency events, such as the catastrophic passage of Hurricane Katrina in New Orleans in 20051. Alternative data management (both for gathering and
providing information) infrastructures are currently being explored, studied and analyzed ([1], [2], [3]) in order to support data sharing also in the ab-sence of a centralised infrastructure. In this study, we explore the flexibility and adaptability of the OpenKnowledge framework in the context of an e-Response scenario. This framework provides a distributed infrastructure, that enable peers to find and coordinate with each other by publishing, dis-covering and executing interaction models, i.e. multi party conversational protocols written in the Lightweight Coordination Calculus (LCC)[4]; the key novelty of the approach is that no a-priori agreement or knowledge of the conversation partners is needed to have meaningful interactions. In this
work, the proposed OpenKnowledge (OK) infrastructure is used to explore its capability to support both centralised and decentralised architectures for information gathering in open environments. For this purpose, we built a simulation-based test-bed fully integrated with the OK platform. The fi-nal goal of such virtual environment is to evaluate this framework in the e-Response domain. In particular, we implemented an e-e-Response simulation environment through which existing emergency plans based on real-data are modelled and simulated. Moreover, a suite of experiments has been designed and run to evaluate the performance of the OK e-Response system under specific assumptions. Preliminary results show the system’s capability of supporting the two afore-mentioned architectures and a comparable perfor-mance in both cases. To summarize, the main contributions of the present deliverable are:
• The full use and testing of the current release of the OpenKnowledge infrastructure in a realistic and demanding use case;
• The provision of an agent-based simulation environment in which to evaluate interaction models, coordination tasks and diverse emergency information-gathering models;
• A preliminary analysis and comparison between the effectiveness of the OpenKnowledge infrastructure in centralised (hierarchical) and decen-tralised (p2p) information gathering in e-Response management activ-ities.
The idea to explore and test the effectiveness of different data manage-ment architectures in ”real-world” e-Response setting is not new. It is recog-nized [5] that realistic computer simulations can be a valuable tool to investi-gate innovative solutions, such as new collaborative information systems, new cooperation configurations and communication devices. In fact, several multi agent-based simulation applications have been developed in diverse domains ([6], [5], [7], [8], [9]). Related research projects are either specifically devised for the emergency management area or focused more on the architectural aspect. In particular, CASCOM2, WORKPAD3, EGERIS4, EUROPCOM5, POMPEI6, POPEYE7 and WIN8 are among such projects. For example,
in the CASCOM project (Context-Aware Business Application Service Co-ordination in Mobile Computing Environments) an intelligent agent-based peer-to-peer (Ip2p) environment was developed [10]. Also, in the FireGrid project [11], a software architecture to help fire-fighters in e-Response events
2http://www.ist-cascom.org 3http://www.workpad-project.eu/description.htm 4http://www.egeris.org 5http://www.ist-europcom.org 6http://www.pompei-eu.com 7http://www.ist-popeye.org 8http://www.win-eu.org
has been built. They realized an integrated system where real-time sensor data are processed using sophisticated models, running on High Performance Computing (HPC) resources accessed via a Grid interface, and finally pre-sented to humans using a command-and-control multi-agent system. In this case, a mechanism based on the OpenKnowledge approach would allow each agent to execute, and eventually modify, the workflow, thanks to the sharing of the multi-agent protocol.
In what follows, we first introduce the e-Response test-bed (Section 2). We then present, in Section 3, the e-Response case study used to experiment the OK framework. Next, in Section 4, we describe the e-Response simula-tion environment architecture and, in Secsimula-tion 5, we present the experimental summative experiment designed for the evaluation; preliminary results of centralised vs. decentralised information management architectures are also discussed. In Section 6, we draw our conclusion and future work. Section 7 contains akcnowledgments. Finally, in Appendixes A-1 and A-2, we provide a technical documentation of all the interaction models developed for the various experiments.
2
The e-Response Test-bed
The developed e-Response test-bed consists of an agent-based e-Response simulation environment fully integrated with the OpenKnowledge infrastruc-ture and through which existing emergency plans are modelled and simulated. In particular, with such test-bed we:
• Simulate significant e-Response use-cases using the OK infrastructure; • Investigate how the OK framework is capable of supporting emergency activities coordination (centralised vs. decentralised information gath-ering);
• Test the robustness of the OK kernel by exploring two dimensions: (1) the number of peers involved in a simulated coordination task and (2) the number of interaction models;
The e-Response test-bed is composed of the following main components which will be described through the rest of the deliverable:
1. A Simulator capable of modelling a flood event in Trentino, using real GIS/flood data (see section 4.2);
2. Suite of LCC interaction models (ca.13) supporting three different peer coordination strategies: baseline, centralised and decentralised coordi-nation. These strategies will be discussed in section 3.2.2; full details on the interaction models are given in appendixes A-1 and A-2;
3. Suite of OpenKnowledge components (ca. 25) enabling emergency peer types. Such peer types are described in section 3;
4. Suite of Peers (ca. 300) modelling emergency agents;
5. Suite of experiments aimed at testing the OK kernel (more details in section 5);
6. ICT Infrastructure to support the experiments (DBs,servers,script); de-tails on part of the infrastructure can be found in section 5.3.
3
The e-Response Case Study
In this section, we describe the case study where the OpenKnowledge frame-work has been applied: an emergency response scenario. The nature of the specific e-Response domain is such that a structured coordination is neces-sary in order to prevent chaotic and uncontrolled conditions. Nevertheless, taking into account flexibility is fundamental to handle unexpected situa-tions (e.g., sudden road blockage, fast and unpredicted events, etc) which will most likely happen in emergency situations. While the general vision of interaction protocols accounts for the structured coordination requirement of the problem, the adoption of models specifically designed to explicit interac-tions in a p2p fashion and passed through an underling open infrastructure accounts for the support of flexibility and dynamicity.
We applied the OpenKnowledge framework in the case study of a flooding disaster in Trento (Italy). The work moved its steps from a preliminary anal-ysis on this kind of disaster. The available analanal-ysis resulted from documents related to the current flood emergency plan in the Trentino region and from interviews with experts. We individuated emergency peers (e.g., firemen, police, medical, bus/ambulance agents, etc.), the main organization involved (e.g., Emergency Coordination Center, Fire Agency, Civil Protection Unit, Provincial Health Agency, etc.), a hierarchy between the actors (e.g., emer-gency chief, subordinate peers, etc.), service peers (e.g., water level sensors, route services, weather forecast services, GIS services, etc.) and a number of possible scenarios, that is, possible interactions among the agents and their assigned tasks. The peers can be distinguished into two main categories: service peers and emergency peers. While the former are basically peers pro-viding services under request, the latter are peers often acting on behalf of emergency human agents that are in charge of realizing the emergency plan. A comprehensive description of all peers and tasks can be found in previous OpenKnowledge deliverables ([12],[13]). Figure 1 recalls the richness of all scenarios and interactions possibly involved. The areas circled in red, con-cern the scenarios actually modeled in terms of LCC interactions. In what follows, we illustrate only such scenarios. The upper part of the figure repre-sents the pre-alarm phase of the emergency plan foreseen by the Autonomous Province of Trento. The down part relates to the evacuation phase.
Figure 1: The overall e-Response use case
In the prealarm phase are mainly involved service peers which are, as has been previously said, peers providing all that information needed to enact the emergency plan or not. The pre-alarm phase thus involves mainly service peers which provide information useful for decision making. The pre-alarm phase eventually results in the evacuation phase. Such phase regards all the activities needed to move people to safe places. In such phase, the key peers are emergency peers, that is, all the peers in charge of helping in the evacua-tion of citizen: emergency coordinators, firemen, government agencies (e.g., civilian protection department), real-time water level data reporters (e.g., people, sensors). Of course, the emergency peers are supported by service peers such as route services, sensors scattered across the emergency area, etc. Figure 2 gives a schematic view of the two phases involved in our case study. It shows the involved actors (denoted by round circles), their in-teractions and the kind of information exchanged. The smooth rectangle denotes the simulator, that is, the virtual environment where all the peers act; obviously, it doesn’t correspond to any entity in the reality, therefore, we don’t describe it in this context. However, the simulator is essential for the simulation-based test-bed and will be illustrated in detail in the next section 4.
The figure also shows two different evacuation sub-scenarios: in both of them, a peer needs to get information on route’s practicability but while in one case (area above the red line) such moving peer (MP) gets route information by asking the Civil Protection (CP), in the other one (area below the red line) it interacts directly with reporters (r1,r2,r5) physically present at the locations of interest. These two ways of gathering information are
referred to as centralised and decentralised strategies.
Figure 2: The implemented e-Response scenarios
3.1
Prealarm scenario
In the pre-alarm phase, the water level of critical points along the river is constantly monitored by an emergency monitoring system (EMS). Such system also checks weather information in order to enrich the data needed to predict the evolution of a potential flooding. When a critical situation is registered, the emergency chief is notified in order to be able to take the proper actions.
3.1.1 Peer types
The peer types involved in the pre-alarm scenario are the following:
• Emergency Monitoring System (EMS): such system represents the server station where all the information which are critical to the emergency are collected. In particular, the system:
– collects weather forecast information;
– collects water level information from sensors located along the Adige river;
– analyses the previous information;
– when needed, sends a proper alarm message to the emergency chief;
• Water Level Sensor(S): represents a water level sensor placed in one of the four strategic points along the Adige River; provides water level information registered at the location where it is placed;
• Weather Forecast Provider (WFP): provides weather conditions (i.e., temperature, rain probability, wind strength) given a specific location. • Emergency Chief (EC): the top-level autority which is notified by the
EMS and is in charge of making decisions.
As can be noticed, the majority of the above peers are mainly what we denoted as “service” peers.
3.1.2 Prealarm interactions
The main interactions pertaining the prealarm phase - and which are modeled in terms of LCC interaction models - are essentially three. A short description for each of them follows:
1. Water level sensors monitoring: a central monitoring system (EMS) requests continuously the level of water registered at critical positions along the river. Such information, together with the one about the precipitation rate in the next days, is crucial to enact the evacuation plan;
2. Weather information collection: the emergency chief requests periodi-cally a weather forecast (i.e., rain and temperature) in order to make previsions and therefore decisions on the actions to take.
3. Alarm message generation: when certain water thresholds and weather conditions are detected, an alarm is sent to the emergency chief. Appendix A-1 contains a more detailed description and the LCC code relative to the above interactions.
3.2
Evacuation scenario
As anticipated before, the evacuation plan consists of peers (e.g., firemen, buses, citizen) moving to safe locations. In order to move, such peers need to perform some activities, i.e., choosing a path to follow (usually by asking a route service), checking if the path is practicable (usually by interacting with the Civilian Protection or with available reporters distributed in the area), proceeding along the path. The Civilian Protection can deliver information on the blockage state of some given path to a requester. It is able to do that since it is continuously gathering information from reporters scattered around the emergency area. Such reporters inform on the water level registered at their locations.
3.2.1 Peer types
The peer types involved in this scenarios are the following:
• Emergency Chief (EC): such peer is responsible for the coordination of all the emergency activities, from the propagation of the alarm to its subordinates, to resources allocation. Specifically, it:
– receives different levels of emergency alarm messages from the EMS;
– collects GIS information;
– collects specific weather information (e.g., temperature, rain prob-ability, wind strength, etc.)
– sends directives to its subordinates (e.g., move to a specific point, close a meeting point)
• Moving Peer (MP): it is a peer (e.g., an emergency subordinate as a fireman, a bus, a citizen) that needs to move to a specific location; • Route Service (RS): provides a route connecting two given locations; it
can also provide a route that does not pass by a given set of undesired locations;
• Civil Protection (CP): it is responsible for giving information on the blockage state of a given path;
• Reporter (R): it is responsible for giving information on the water level registered at its location. It could be either a citizen or a sensor device permanently placed at a given location. In our simulations, we consider reporters as fixed sensor devices.
3.2.2 Information gathering strategies
An important part of the evacuation scenario consists of checking whether a given route is practicable or not. However, in our simulation, we foresee also the case in which the peer chooses to directly move along the route without getting any information on its blockage conditions. This scenario, in which no strategy is adopted in order to gather useful information, con-stitutes the baseline scenario: a route is taken without checking a priori its conditions. The difference between this baseline scenario and the one de-veloped in Deliverable 6.7 lies in the complete integration of the e-Response simulation environment with the OK kernel: all peers are now equipped with OKCs components and execute LCC interactions by exploiting the search-and-discover, the matching and the trust functionalities provided by the OK kernel.
Aside from focusing on porting the OK kernel into the simulation environ-ment, the main effort of this year activity has been to design and implement experiments testing the capability of the OpenKnowledge platform to sup-port two different information gathering strategies. These strategies relate to how a moving peer gather information on the route practicability, more specifically:
• Centralised strategy : a moving peer obtains information on the blockage conditions of a given route after consultation with the Civil Protection CP (see Figure 2 - area above the red line);
• Decentralised strategy : a moving peer obtains information on the blockage conditions of a given route by gathering water level informa-tion from a selected group of reporters (see Figure 2 - area below the red line).
More details on how the moving peer reasons about the information thus gathered is given in section 4.1, where the peer-network component of the e-Response simulation system is described.
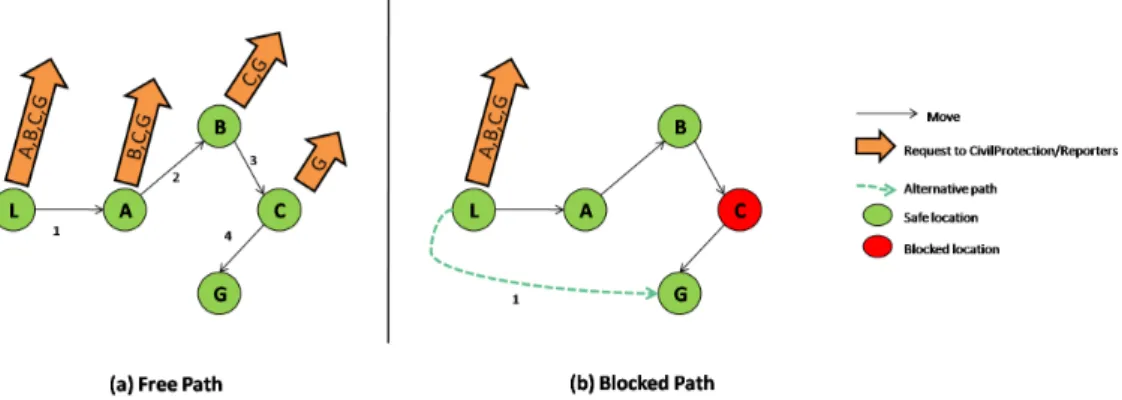
What we want to underline here is that the adoption of an information-gathering strategy (either centralized or decentralized) supports the peer in performing its task. Figure 3 shows the behaviour adopted by the moving peer while moving along a path. Every time it reaches a location, the peer gets information on the blockage state of the route ahead. Notice that, when the path is blocked because of an excessive level of water in a location, the moving peer is aware of that in advance and is thus able to find an alternative path before approaching the blocked location.
Figure 3: Evacuation phase: moving peer behaviour
3.2.3 Evacuation interactions
The main actions involved in the evacuation phase are shortly described below:
1. Start evacuation: describes how an evacuation plan evolves. An emer-gency coordinator alerts members to go to a specific destination. Each member finds a path to reach the destination, checks its status and eventually moves along the path;
2. Find a route: describes the interaction needed to retrieve a path from a route service;
3. Check path status with CP : describes the interactions with the Civilian Protection needed to know the blockage state of a path;
4. Gather real-time data from reporters: a peer asks information about the water level to a group of reporters.
The above actions correspond respectively to the “Evacuation”, “Find-Route”, “Check-Route-State” and “Querier-Reporter” LCC interaction mod-els. More information on the LCC-specifications used to describe the above scenarios and a full explanation of the LCC code can be found respectively in section 4.1 and Appendix A-2.
4
The e-Response System Architecture
To fully use and test the current release of the OpenKnowledge infrastructure in the realistic use case previously described, we built an e-Response simu-lation environment. The current simusimu-lation environment is based on the system presented in [14] and extends it both in a complete integration with the OpenKnowledge kernel and in the inclusion of a realistic flood-simulator. In particular, the following features can be found in this current version of our e-Response simulation system:
1. Full integration with the OK kernel: the previous prolog simulation was ported and further extended into Java so to make full use of the Open-Knowledge components: the LCC Interpreter, the Discovery Service, the Trust, Matching and GEA modules;
2. Dynamic evolution of flood: while in the previous simulation the block-age state of a node was fixed a priori, a realistic flood simulation is embedded in the current system;
3. Modular/simple IMs: in the current simulation environment, about ten single and independent interaction models are used, instead of a unique and relatively complex one (as in the previous simulation);
4. Increased peer’s types: the current simulation system extends the previ-ous one in the number of peer types involved in the emergency scenario. New peer types such as Reporters, Civil Protection Unit, Weather Ser-vices, Emergency Monitoring Systems are considered;
5. Different information gathering strategies: the current simulation sys-tem extends the previous one in the scenarios involved; while, previ-ously, the moving peer was meant to go directly to the destination assigned, in the current simulation the peer can adopt two different information-gathering strategies to ask for the route conditions. The test-bed is used to evaluate interaction models, coordination tasks and the diverse emergency information-gathering models; through simula-tions, it is possible to estimate how the platform could perform in realistic emergency scenarios. The developed e-Response simulation system is used to: (1) model the behaviour of each peer involved in an e-response activity, (2) execute predefined interaction models within a p2p infrastructure and (3) visualize and analyze a simulated coordination task through a Graphical User Interface (GUI). The e-Response system is composed of two main com-ponents: the peer network and the e-Response simulator. Figure 4 sketches its overall architecture. All peers are equipped with their own OpenKnowl-edge plug-in component(s); each black arrow represents a different interac-tion model, which also represents the flow of informainterac-tion between peers; the greys arrows indicate interactions among network peers only. In the next three subsections, we illustrate the peer network, the e-Response simulator and the reuse of OK-components respectively.
Figure 4: The e-Response system’s architecture
4.1
The peer network
The peer network represents the group of agents involved in a simulated coor-dination task. An agent in the peer network can interact with other agents, perform some actions (e.g., moving along a road) and gather information. (e.g., sense the water level in its vicinity).
In order to perform an action or receive sensory information near its location, a peer must connect to the simulator by enacting the “Connect” interaction model. Once added to the simulation, the connected peer period-ically receives sensory information from the simulator via the “Sensory-Info” interaction model; finally, to perform an action, a connected peer enacts the “Perform-Action” interaction model which models the action coordination with the simulator. The connected network peers are called physical peers (shaded ellipses in Figure 4).
Not all peers must connect to the simulator: non-physical peers, such as a route service that provides existing routes, do not need to communicate with the controller but only with other peers in the peer network. In the real world such peers would not actually be in the disaster area and could not affect it directly, but could provide services to peers that are there. Non-physical peers are represented as not shaded ellipses in Figure 4.
In what follows, we describe in more details those interactions between the network peers which regard the evacuation phase, that is, the phase which was simulated in order to test the OK infrastructure and compare the men-tioned information gathering strategies. Figure 5 shows the architecture of the system where the main interactions between network peers are specified.
Figure 5: Evacuation phase: network peer’s interactions
The whole coordination task evolves through the following ordered se-quence of steps:
1. Send directive: the emergency chief EC sends the directive to move to a given destination to a moving peer MP ;
2. Ask route: the MP asks a path to the route service RS ; 3. Return route: the MP receives a path from RS ;
4. Check route state: the MP checks the route state with either the Civil Protection CP (centralised scenario) or the reporters r (decentralised scenario);
5. Perform action: the MP checks the feasibility of the (move) action; 6. Return action feasibility: the MP comes to know whether the action
has been performed or stopped.
Eventually, steps 2 through 6 are repeated until the final destination is reached. The above sequence of actions is coded in terms of the “Evacuation” interaction model9 which represents the “main” one in that it captures the
whole evacuation scenario. In Figure 5, grey arrows refer to activities entirely performed within the “Evacuation” IM while the black arrows shaded in grey indicate that the associated steps are executed by solving LCC constraints (in the main IM) which, in their core part, enact separate LCC interaction models. This is a key functionality of the OK platform, since it allows to write simple, modular and reusable LCC specifications. We tell something more on this later in this section.
Here, the “Evacuation” IM is described in its main parts, however, a detailed description can be found in appendix A-2.2.1. It simulates the evac-uation phase and can be used in all those sitevac-uations where an emergency chief sends the directive of reaching specific locations to its subordinates. In short, an emergency subordinate ES10 receives an alert message from the chief and
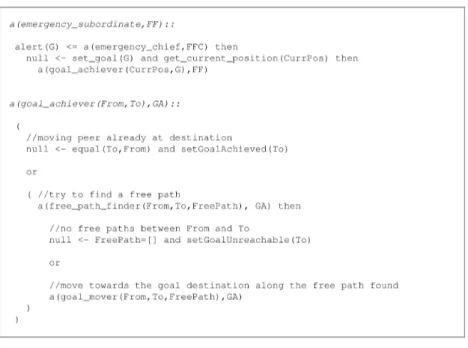
resolves some constraints in order to set the goal to be achieved (reach the goal destination G) and get the current position. The activities of ES thus evolve through three key LCC roles: the goal achiever role which abstractly models the activity of searching for a path and moving towards the goal; the free path finder role which defines the operations needed to find a free path; the goal mover role which models the actions needed to move towards the goal destination. Figures 6-7 show LCC code snippets for two of the key roles. The constraints specified in bold are the ones enacting separate interaction models. For example, the steps 2-3 mentioned above are performed in the constraint find path(From,To,Path) of Figure 7. Such constraint enacts the “Find-Route” IM whose details can be found in appendix A-2.2.2. Step 4 is performed within the constraint request path state(Path,PathState) shown in the same figure. Such constraint eventually enacts either the “Check-Route-State” or the “Querier-Reporter” IM, this depending on the information gathering strategy adopted. Finally, steps 5-6 are performed in the constraint try move action of the goal mover role11; it enacts the “Perform-Action” IM
(see appendix A-2.1.7 for more details).
In what follows, we describe in details the activity of checking the path state, since it represents the core part of our simulation. The constraint
9In what follows, we will give to “interaction model” the short name “IM”. 10Here the emergency subordinate ES is what we denoted as moving peer. 11This role is fully explained in appendix A-2.2.1.
Figure 6: LCC fragment for the “goal-achiever” role
Figure 7: LCC fragment for the “free-path-finder” role
request path state(Path,PathState) of Figure 7 performs two activities: (a) enaction of a separate LCC interaction model in order to get key informa-tion on the route state; (b) deducinforma-tion of the route practicability from the information acquired. Activity (a) is carried out in the case where one in-formation gathering strategy is adopted: the “Check-Route-State” and the “Querier-Reporter” IMs will be respectively enacted in centralised and decen-tralised scenarios. When the moving peer moves ahead without first checking the route state (no information gathering strategies are adopted), the activ-ity (a) won’t be performed and the route will be assumed to be practicable. Activity (b) will start after completion of the interaction eventually enacted
in activity (a) and will usually need the information acquired by the moving peer during such interaction. The problem of accessing persistent information acquired during execution of separate interactions is addressed by the OK kernel through a “peer access mechanism” which allows an OpenKnowledge Component12 (OKC) to access the local knowledge of the peer by invoking
methods declared in a specific “PeerAccess” Java class13.
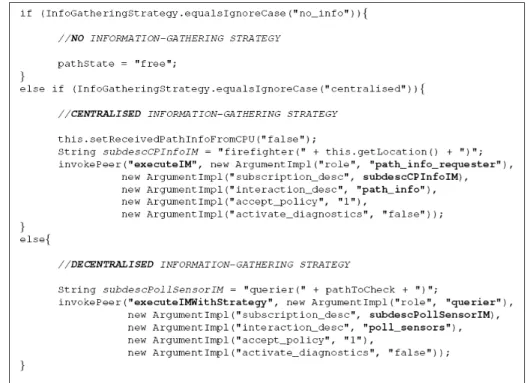
Figure 8 shows the Java code of the OKC’s method associated to the request path state constraint that implements the activity (a) mentioned be-fore. It can be noticed how, depending on the current strategy, the peer either enacts one of two interaction models or sets the route state as “free”. The enaction of a separate interaction model exploits the “peer access mech-anism” and specifically takes place by invoking either the executeIM method or the executeIMWithStrategy method. The latter method differs from the former in that it performs a preliminary filtering of the peers subscribed to the IM to be executed. In the specific, before execution of the “Querier-Reporter” IM, the peer selects a group of reporter peers. More details on this selection mechanism are given later in this section.
Figure 8: Java code for OKC method “request path state”: interaction model enaction
In what follows, we give some details on both the centralised control be-haviour and the decentralised control bebe-haviour.
12More details on OpenKnowledge components can be found in [15].
13More details on how to access the peer state can be found in:
Centralised Control Behaviour
The centralised scenario is characterized by the presence of the Civil Pro-tection peer who acts as the unique provider of route state information and relies on reporters, i.e., the main sources of such information. The behaviour of the main actors is the following:
• The Civil Protection is subscribed to the querier role in the “Querier-Reporter” IM and to the path info provider role of the “Check Route State” IM. It maintains a database of current statuses of locations and answers requests from moving peers for status information;
• Each Moving Peer is subscribed to a emergency-subordinate role in the “evacuation” interaction (see A-2.2.1) and to the path info requester role of the “Check Route State” IM. Initially at a given location L, this peer performs the following steps in order to reach the goal destination G :
1. If L = G then stop 2. Otherwise:
(a) Get one path P from L to G (P =[Phead | Ptail ])
(b) Check that P is free by interacting with Civil Protection i. If the path is free then
A. move from Phead to next location Ln B. Back to step (b) with P =Ptail
ii. Otherwise back to step (a) to get an alternative path from L to G
• Each Reporter is subscribed to a reporter role in the “Querier-Reporter” IM. It responds to requests for water level information from a querier (e.g., Civil Protection).
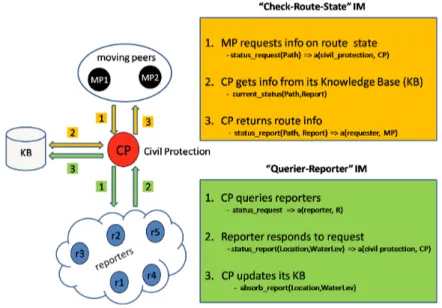
Figure 9 schematizes the main interactions between the peers. Full de-tails on “Check Route State” and “Querier-Reporter” interaction models are given in appendixes A-2.2.3 and A-2.2.4 respectively.
Decentralised Control Behaviour
The decentralised scenario is characterized by the direct interaction tween a moving peer and a suitably selected group of reporters. The be-haviour of such peer is as below:
• Each Moving Peer is subscribed to an emergency-subordinate role in the “evacuation” interaction (see A-2.2.1) and to the querier role of the “Querier-Reporter” IM. Initially at a given location L, this peer performs the following steps in order to reach the goal destination G :
Figure 9: Information Gathering: centralised interactions 1. If L = G then stop
2. Otherwise:
(a) Get one path P from L to G (P =[Phead | Ptail ])
(b) Subscribe to the role of querier with subscription description querier(Ptail)
(c) Choose reporters according to path P
(d) Check that P is free by interacting with the selected reporters i. If the path is free then
– Move from Phead to next location Ln – Back to step (d) with P =Ptail
ii. Otherwise back to step (a) to get an alternative path from L to G
• Each Reporter at location N subscribes to the reporter role in the “Querier-Reporter” IM with a subscription description of “reporter(N)”. It responds to a request for status information from a querier (e.g., moving peer).
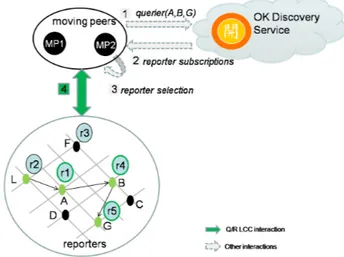
In the above, the key point is how the moving peer selects a suitable group of reporter peers. Suppose the peer has to move from location L to location G through path P = [L,A,B,G ]. Here, A and B represent intermediate locations (or nodes). Assume reporters R1, R2, R3, R4 and R5 are at nodes A, L, F, B and G respectively and they are subscribed to the reporter role as specified above. Figure 10 shows the selection process as a sequence of steps. In step 1, the moving peer MP subscribes to the querier role with subscription description querier(A,B,G). This means that it is interested in
interacting with only those reporters which are present at the location A,B,G specified. In step 2, MP receives a list R of all reporters subscriptions from the OK Discovery Service [16]. In this example, such list would be R = [R1 (A),R2 (L),R3 (F ),R4 (B ),R5 (G )]. In step 3, MP selects the reporters of interest, that is, R1, R4 and R5. In step 4, the MP starts interacting via the “Querier-Reporter” IM with the selected reporters (green-bordered circles with blue fill).
Figure 10: Decentralised Information Gathering: selection of reporters
4.2
The e-Response simulator
The simulator is designed to represent the environment where all the involved agents act. It is composed of three modules which are themselves peers: the controller, the flood sub-simulator, and the visualiser (see Figure 3). The controller regulates the simulation cycles and the management of the simu-lated agent activities; the flood sub-simulator - at present - reproduces the actual evolution of the 1966 flood in Trento; the visualiser stores simulation information used by the GUI to view a simulation run in a step-by-step way. The simulator does not interfere or help coordinate peer’s actions in the peer network. It is used to simulate the real world.
4.2.1 Controller
The controller is the core of the simulator: it drives the simulation cycles and keeps track of the current state of the world. In order to achieve that, it needs to know what changes are happening to the world and updates its state accordingly. After updating its state, it also informs the relevant peers of these changes. The simulation thus evolves through cycles (or time-steps). A simulation cycle foresees two main operations:
• Gathering changes: the controller receives information about the changes that happened to the world: (a) it receives the disaster (e.g.,
flood) changes from the disaster sub-simulator via the specific interac-tion model and (b) it serves requests of performing (move) acinterac-tions with the “Perform-Action” interaction model (see Figure 4). In this latter interaction, the controller verifies whether certain actions are legal or not before they are performed, and if a certain action is illegal, the peer is informed of the reason of failure;
• Informing peers: the controller sends information about the changes that happened in the world: (a) it sends, at each time-step, local changes to each connected peer via the “Sensory-Info” interaction model and (b) it sends to the visualiser information on - (i) the locations of all connected peers; (ii) the status of the reporter peers (e.g., available, responding to requests) and (iii) the water level registered; here, the “Visualiser” interaction model is used.
Before a simulation cycle commences, some preliminary activities are per-formed such as: establishing key parameters (e.g., maximum number of sim-ulation cycles, timeouts, water level thresholds), connecting with the flood sub-simulator, sharing with it the initial topology of the world, and adding connecting peers. Once a simulation cycle terminates, the controller updates the time-step and starts the next cycle. Notice that, due to the modularity of the above architecture, it is reasonably easy to add as many disaster sub-simulators (e.g., landslides, earthquake, volcanic eruption, etc.) as needed.
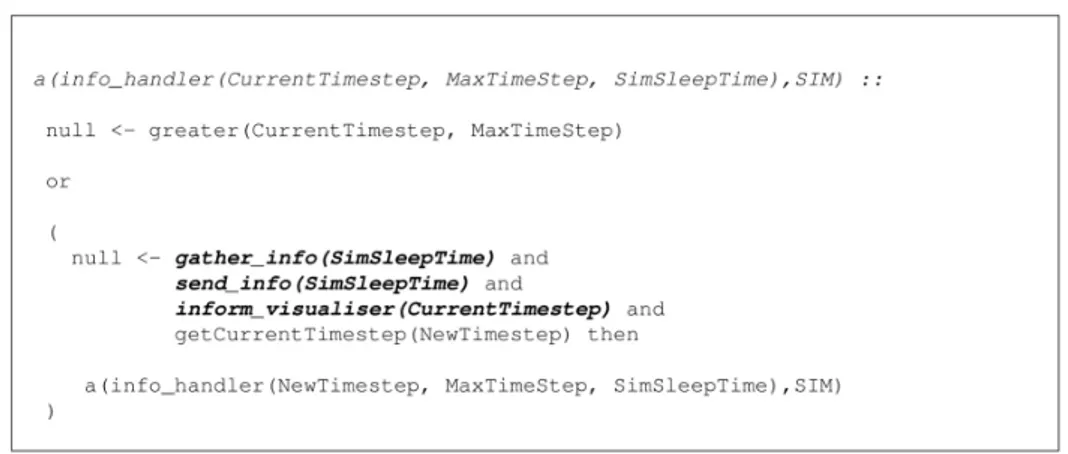
To simulate the afore-mentioned activities, the single interaction model “Simulation-Cycles” is designed14. An LCC code snippet is given in Figure
11. It only shows the key role of the controller. The constraints specified in bold are solved by executing the “Flood”, “Sensory-Info” and “Visualiser” interaction models15 respectively.
Figure 11: LCC fragment for the “info-handler” role taken by the controller
14See appendix A-2.1.1 for full details on this interaction model.
15The “Flood”, “Sensory-Info” and “Visualiser” IMs are fully explained in appendixes
4.2.2 Flood Sub-Simulator
The flood sub-simulator goal is to simulate a flood in the town of Trento (Italy). The equation defined in its core OKC is based on flooding levels and flooding timings resulted from a flood simulation for the town of Trento, developed by the International Institute for Geo-Information Science and Earth Observation and by the University of Milano-Bicocca [17].
This study is based on a very detailed digital terrain model of the river Adige valley, on historical hydrological data of the flood experienced in Trentino in 1966 and on the localization of ruptures of the river’s dike. It also takes in consideration floodplain topography changes from year 1966 to year 2000 caused by modifications in vegetation spaces, in agricultural regions, in industrial zones, in urban areas and in infrastructures. A two-dimensional finite element flood propagation model is used to reconstruct the 1966 flood and to show how the terrain alterations affects the flood behaviour. This 2-D model, at regular time intervals, generates two maps for both the water height and the flow velocity. Once such maps are created, they are then transformed into five indicator maps, which are shown in Figures 12 through 16. These indicators are:
• Maximum water level : the maximum level (in meters) reached by the flood;
• Maximum flow velocity: the maximum speed (in meters per second) of the water flow;
• Maximum impulse: the maximum amount of water that has been moved (maximum water level x maximum flow velocity);
• Maximum water level rising speed : the maximum increase of the water depth (in meters per hour) ;
• Arrival time of the first water : the time when the flood arrives at a given position.
To the purpose of our test-bed, the territory is divided into flooded areas: each area is characterised by the maximum water height reached during the inundation and the time when this level is touched. These flooded areas are obtained by digitizing the indicator maps of Figures 12 and 16. To maintain our simulation realistic but simple, we have assumed that each area reached its maximum flooding level in one hour.
Figures 18 and 17 show a zoom on the north region of Trento. In partic-ular, they depict the maps of the flooded areas and represent, respectively, the maximum water level and the time when it is reached. Such maps are used in our test-bed in order to create two different tables in a geographical database.
Each table has a field, called node, representing x,y cordinates of digi-talized points. Moreover, the first table has a field, called MaxWL (Maximum
Figure 12: Maximum water level [17] Figure 13: Maximum flow velocity [17] Figure 14: Maximum impulse [17] Figure 15: Maximum
speed of rising of the wa-ter level [17]
Figure 16: Arrival time of the first flood waters [17]
Water Level), that is the maximum water height for a node. The second ta-ble, instead, has a field, called MT(Maximum Time), that describes the time, in hours, at which the flood reaches the maximum water level at a node. This value is calculated digitalizing the map showing the time arrival of the first water (see Figure 16) and making the assumption that the time required to culminate the flood is always one hour. Finally, at OK-simulation16 time,
only the selected data of the topology of the region interested by the current simulation are joined in a single table using an Open Geospatial Consortium standard spatial SQL query.
Given the data stored in the two tables of the geographical database, and assuming that the time required to culminate the flood is one hour, the flooding law used during the OK-simulation to calculate the flood changes for a given node at a time-step t is:
f (t) = 0 if t < (M T − 1) ∗ T f (t + 1) = f (t) + (M axW L)T if (M T − 1) ∗ T <= t < M T ∗ T f (t) = f (M T ∗ T ) if t >= M T ∗ T (1)
16We denote our test-bed simulation as the “OK-simulation”, in order to distinguish it
Figure 17: Maximum water level in the north of Trento town
Figure 18: Time when maximum water height is reached in the north of Trento town
where T is the number of time-steps per hour.
In Figure 19, we can see that the flood level is 0 from the beginning of the OK-simulation to one hour before MT, i.e., the time at which the flood reaches the maximum level. Then, in an hour the flood increments from 0 to M axW L and finally it stays to M axW L until the end of the OK-simulation. The time at which the water level starts to decrement is not considered since the number of hours the flood stays at its maximum level is sufficiently high for the purpose of our simulation.
Figure 19: Flooding Law
The flood sub-simulator is developed in Java and is fully integrated into the OpenKnowledge kernel. The main component is an OpenKnowledge peer FloodPeer, that subscribes to two interaction models, the “Flood Sub-Simulator Connection” IM and the “Flood” IM, and stores its core OKC component FloodSubSimulatorOKC. These two interaction models are very simple. The “Flood Sub-Simulator Connection” IM (see A-2.1.2) is enacted
just once at the beginning of the simulation by the connectWithSubSimula-tors constraint in the “Simulation Cycles” IM (see section A-2.1.1). This interaction model has two main goals:
• sharing the topology of the world between the controller and the flood sub-simulator peers;
• storing, in the controller peer local knowledge, the connection state of the sub-simulator peer.
The second interaction model (see A-2.1.4) is used by the controller at each time-step, in order to get from the flood sub-simulator the changes of the flood level of the nodes in the area interested by the simulation. The core parts of this interaction model are the floodChanges(Time,Changes) con-straint (in the ‘flood-simulator’ role) and the updateFloodChanges(Changes) constraint (in the ‘controller’ role). The first constraint implements the flood-ing law (1); the second one performs an update of the water level of only those nodes which were interested by flood changes during the last time-step. 4.2.3 Visualiser
This component enables the GUI used to visualise the simulation. In partic-ular, the GUI shows the information provided by the controller through the “Visualiser” interaction model. At every time-step, the visualiser receives the changes and updates its history according to the new information. The update results in a change on the GUI. Figure 20 shows the appearance of the GUI at the first time-step of the simulation.
Figure 20: Emergency GUI
A green dot represents a reporter peer available for giving information on the water level registered; a grey dot represents a reporter agent giving this
information; the water level at a location is depicted as a blue circle, which size depends on how high the water level is; the hat represents the emergency subordinate.
For more detailed information on the interaction models used to imple-ment the simulator, please refer to the appendix A-2.1.
4.3
Reuse of OpenKnowledge components
To build the e-Response simulation system described in the previous sec-tion, we strongly benefit from the possibility of reusing OK components. In particular, the components reused to implement both centralised and decen-tralised scenarios are LCC specifications and OKC plug-in. Figure 21 shows a complete list of all interaction models implemented for both the pre-alarm and the evavuation phase of the considered use case. It shows also the type of peers involved and the separated interactions called by a constraint in a given IM. The last column of the table indicates for which kind of informa-tion gathering strategy a given IM is used. As can be noticed from the table, all the interaction models are used in both centralised (C ) and decentralised (D ) scenarios, but one: the “Check Route State” IM, which is only used to interact with the central peer CP.
Figure 21: e-Response Interaction Models
The table therefore shows that the interaction models are modular and reusable in different contexts.
Reuse of the “Querier-Reporter”interaction model
From the point of view of the information gathering strategy, the key interaction model is the “Querier-Reporter”. Thus, it is interesting to de-scribe the mechanism through which this very same specification is used to enable both centralised and decentralised scenarios (see Figure 22). In the centralised scenario the Civil Protection peer subscribes to this IM with the subscription description querier(all). This makes the CP peer interacting with all the reporters. Moreover, the CP peer enacts the interaction continu-ously, i.e., at each time-step. On the other hand, in the decentralised scenario the moving peer subscribes to the same interaction with the subscription de-scription querier(Path) as already described in section 4.1. Finally, the peer MP enacts this interaction only when needed, i.e., when it has to move.
Figure 22: The “Querier-Reporter” IM Reuse Reuse of OKC methods
Beside reusing the interaction models, the e-Response system implemen-tation was aided by the reuse of OKC components, even though in a minor degree. From one side, we have different peers using exactly the same OKC. For example, the UtilOKC Java class provided by the OK kernel was a use-ful OKC component shared by all peers in our simulation. Such component provides basic methods for variable increment, decrement, comparison and so on. On the other side, we have OKC components organized in a hierar-chical way. Exploiting the Java’s inheritance mechanism is, in fact, possible to define OKC components which will be used by many peer types only once. For example, the OKC component ConnectOKC used to include all the methods needed to solve the constraints in the “Sensory-Info” IM, is stored by the peers previously denoted as physical peers and, where needed, it is extended. In our case, while the Civil Protection peer needs to enact the
“Querier-Reporter” IM every time it receives sensory info from the controller, the moving peer does not. The former peer will therefore use an OKC com-ponent which extends the Java class ConnectOKC and contains a method, namely “update info”, that overrides the one defined in the base class and includes the enaction of the “Querier-Reporter” interaction model.
5
The e-Response Summative Experiment
In this section we describe the evaluation of the OK framework in the e-Response domain. We designed a series of experiments with a three-fold aim:
1. Show the OpenKnowledge system in action, illustrating that all parts of the system are capable of working cohesively in the desired manner; 2. Demonstrate that the technology provided by OpenKnowledge sup-ports different models of information sharing (centralised vs decen-tralised scenario);
3. Establish whether the OpenKnowledge paradigm can make positive dif-ferences in performance between such disaster scenarios. In particular, what is expected (and desirable) is to have the OK p2p framework com-parable in performance to traditional centralised systems and, when specific fault conditions arise, improving such conventional systems. While the achievement of the first two objectives depends on an appropri-ate and efficient design of the OK components (IMs, OKC’s), the third goal is less straightforward and hides a certain complexity. Since it is the core of the whole e-Response summative experiment, it deserves a more punctual explanation. We started from the following general evaluation hypotheses:
There exists some combination of interaction model sharing, ontology matching and trust assessment capable in a highly distributed and peer to peer architecture of rivalling the emergency response performance we would expect in a traditional centralised planning model; furthermore, the perfor-mance of the peer-to-peer system is more robust in the presence of failure of components.
This general hypothesis is insufficiently precise to be tested directly so we consider a more specific hypothesis:
In simulations using the OpenKnowledge kernel for coordination, Trentino GIS/flood data to represent world state and locational information about peo-ple and resources, there exists some combination of OpenKnowledge inter-action model sharing, ontology matching and trust assessment capable with a decentralised peer-to-peer system of coordination (relying on the ontology
matching and trust mechanisms) and of moving similar numbers of people to safe sites during a simulated flood event as we observe in simulations with a centralised system of coordination. Furthermore the performance of the peer-to-peer system is more robust to the failure of sensors and breakdown of communication channels.
The above hypothesis is quite plausible but nevertheless compound. In order to investigate it, we built up a framework consisting of four steps: (i) analysis of the variables involved; (ii) determination of meaningful assump-tions; (iii) definition of experiments in all their details; (iv) specification of expected results; (v) design of a supporting ICT infrastructure; (vi) experi-ment execution. These steps will be described in the next sections. However, it is worth to anticipate here that two main types of experiments are de-signed: experiments simulating emergency scenarios in presence of ideal and fault conditions.
Once the framework is established and its phases completed, the final task is to run each experiment. In order to prove the hypothesis, it is crucial to run each experiment a significant number of times. This is probably the most timeconsuming and burdensome task since the number of peers involved is considerable and the current version of the OK kernel is not yet definitively stable with a relative high number of peers and concurrent interaction models. For this reason, for this deliverable, we focused on collecting a significant number of runs of the first type of experiments (centralised and decentralised e-Response scenarios without fault conditions). We will focus on statistically interpretable results for the experiments with faults cases in future work.
5.1
Performance Measurement and Involved variables
In the context of our experiments, what we measure as performance is: (a) the percentage of moving peers arriving at destination; (b) the number of timesteps needed to arrive at destination.
The above indicators will be used to compute the results of the experi-ments and to make a comparison among them.
As already anticipated, the first step needed to develop the evaluation is to carry out an analysis of the variables involved. Notice that for each experiment designed, a certain number of runs need to be made. A list of the variables considered in the experiments follows:
A. Number of moving peers: the number of peers moving to a specific destination. Since the main aim of the summative experiment is to compare two different strategies (centralised vs decentralised) rather than making a realistic simulation, it is reasonable to fix this variable to 1 in all experiments. By running an experiment a certain number of times, we can then compute the performance (a) of the simulated scenario;
B. Paths: these are the routes in the topology considered in the experi-ments. In order to have significant results, it is important to consider, for each experiment type, a meaningful set of routes, that is, routes covering both flooding and non-flooding areas.
C. Flooding law : models how the flood evolves over time. The flooding law markedly affects the outcome of an experiment run. For example, the moving peer may either arrive at destination or be blocked dependently on how rapidly the flood propagates along the route taken. In our experiments, the flooding law is fixed and follows the equation 1 of section 4.2.2.
D. Number of nodes: locations included in the topology and whose status can be reported by some peer. Incrementing this number is useful to test the capacity of the OK kernel to support many peers. In our testbed, this variable is the number of nodes composing only those routes involved in a given experiment.
E. Number of (reporter) peers per node: the number of reporters located in one node. As before, this variable is useful to test the robustness of the OK kernel and, moreover, the effectiveness of some of its modules (e.g., the trust module [18]). Since dedicate experiments already exist which test such modules (see [19] for more details) and given that our summative experiment aims to discover, if some, eventual benefits of a p2p coordination strategy over a more standard centralised one, we fixed this variable to 1.
F. Degradation of the CPU communication channel : measured as the like-lihood of a fault in the communication channel of the Civilian Protec-tion Unit peer. For example, having a degradaProtec-tion of the 80% means to have this peer serving incoming requests only the 20% of the times. This variable plays a role in the experiments which foresee the presence of inaccurate signaling. In particular, by setting this variable, a specific type of fault (channel fault ) and its severity can be simulated.
G. Degradation of reporter communication channels: defines, for all re-porter channels, the probability of their disruption. For example, hav-ing a degradation of the 30% means to have each reporter peer servhav-ing incoming requests with the likelihood of the 70%. This variable plays a role in the experiments which foresee the presence of channel fault conditions. As for the previous parameter, the setting of this variable determines the degree of severity of the channel fault.
H. Distribution of trustworthy (reporter) peers: defines the number of re-porter peers having a trustworthy behaviour, that is, peers which al-ways report accurate water level values. It is expressed as the percent-age over the total number of reporter peers. This variable plays a role
in the experiments which foresee the presence of fault conditions. In particular, by setting this variable, a specific type of fault (fault due to inaccurate info), its location and its severity can be simulated. In the implemented experiments, we assumed all peers were trustworthy.
5.2
Experiment design
A suite of experiments is defined in order to investigate whether the OK framework is capable of supporting emergency evacuation activities which adopt two different models of information sharing (centralised vs distributed strategy). Furthermore, we want to compare the performances of these strategies according to our previously defined indicators. We designed two main classes of experiments:
- Experiments with No Fault Conditions: set of experiments sim-ulating both centralised and decentralised scenarios which evolve under ideal conditions: the absence of faults (e.g., failures in communication, inaccurate signaling) is assumed.
- Experiments with Fault Conditions: set of experiments simulat-ing both centralised and decentralised scenarios where the presence of faults (e.g., failures in communication, inaccurate signaling) is assumed. Before moving to describe the experiments in more details, it is important to mention here the assumptions made to interpret the results in a reasonable way. Moreover, such assumptions are driven by the current number of peers involved and the actual mechanism of the simulation. They are:
I) The Civilian Protection Unit (CPU) peer has infinite resources (under ideal conditions). This means that the peer is able to serve any number of simultaneous requests and the communication channel never breaks. Therefore, under this assumption, bottleneck problems due to over-whelming requests and/or communication overloads never occur. II) A querier, asking a certain number of reporters for information, will
receive all the answers within a timestep. This is due to how the timestep interval is set: the value is such that the time elapsing between one timestep and the next one is sufficiently high to guarantee the replies from all the reporters.
By making these assumptions, we simulate a real case scenario where pros and cons of both centralised and decentralised architecture are balanced.
In the next sub-sections, we first describe the experiments without con-sidering the fault conditions. Then, we introduce different types of faults and, finally, we illustrate the experiments where these faults are injected.
5.2.1 Experiments with No Fault Conditions
In this first suite of experiments we assume that there are not faults neither on civil protection communication channel nor on reporters communication channels and that all peers are trustworthy. Since moving peers do not interact (at present), the following experiment settings are equivalent:
(A) Running an experiment only one time with many peers that are moving from different locations to different destinations;
(B) Running many times each experiment with only a peer that is moving from a different location to a different destination at each run.
Below we describe how some of the previously defined variables were in-stantiated, adopting the experiment setting (B). In this case, centralised and decentralised simulations have the same configuration apart the experiment type.
• Number of moving peers (A): one moving peer per run;
• Paths (B): at each run the moving peer has to cover a different distance; • Flooding law (C): the equation is fixed;
• Number of nodes (D): we don’t have a reporter peer on each node of the topology, but we locate, at each run, 70 reporters in different nodes; • Number of (reporter) peers per node (E): one reporter peer per node.
Variable Settings
Exp No Information Gathering Runs A B C D E
1 centralised 10 1 1 distance x run fixed 70 x run 1
2 decentralised 10 1 1 distance x run fixed 70 x run 1
Table 1: Experiments configuration (no fault conditions)
Table 1 summarizes the experiment configuration: each experiment is run 10 times; at each run, the only variables that change are the distances that should be covered by the moving peer and the locations where reporters are present. Such locations are determined according to the set of routes associated with the destination assigned to the peer and its starting position. The flooding law, the number of emergency subordinates and the number of reporters remain unchanged during all runs.
Running the above experiments and under the assumptions (I) and (II), we expect that the results we obtain are similar and therefore we should be able to conclude that the OpenKnowledge framework is capable of supporting centralised and decentralised architectures with comparable performance.
5.2.2 Introducing fault conditions
We constructed a basic fault tree analysis for the e-Response simulation in order to identify the types of failures and their relation with events that can occur in our simulation. We did not associate probabilities to faults in order to estimate likelihoods of these events; rather, we performed this analysis only as a means to guide us in the experiment design. In our simulations, we considered two primitive faults:
• Communication failures: the channels are broken;
• Inaccurate signaling: the water level is inaccurately reported.
In Figure 23, a possible fault tree17 is shown. In the graph, primitive
faults (represented as rectangles) are applied to two different initial condi-tions (represented as circles): safe water level or unsafe water level. In the first case, an inaccurate information reporting results from a sensor signaling an unsafe water level, while, in the second case, it is due to a sensor signaling a safe water level. Starting from the right upper part of the graph, i.e., from the “Sensor fails to communicate” fault and the “Unsafe water level” top condition, the bottom event “Person does not reach safe area” is deduced from the intermediate “No hazard signal” condition and the “Person guided to unsafe area” event. The above depicted path represents the case in which, if the water is at unsafe level and the communication channel is broken, the person may not reach a safe location.
To simulate these faults we changed the behavior of reporter and civil protection peers, that is, we changed the Java methods in the related OKC components. An inaccurate information reporting from a sensor peer can be simulated by introducing some noise in the real water level received from the simulator as described in [19]. It can be noticed that this fault is restricted to sensor peers, since we assume that, in the centralised scenario, the CP is always trustworthy. A broken channel, instead, can be simulated for both sensor and CP peers by not sending a response message when the peer in question is queried. The faults above can occur with different frequencies: their probabilities are modeled using the variables described in section 5.1 (Distribution of trustworthy (reporter) peers , Degradation of the CPU com-munication channel and Degradation of reporter comcom-munication channels).
5.2.3 Experiments with Fault Conditions
In our overall work in the e-Response scenario, we have considered two fault conditions, namely: (1) inaccurate and false signaling form the reporters and (2) degradation of communication channels. The inaccurate signaling fault has been explored in detail in the evaluation of the Trust component in Deliverable 4.9 [19]. The main result there is that the use of the OK
Figure 23: Basic fault tree graph for e-Response simulation
framework, and specifically the OK Trust component, provide a relevant improvement in the performance of the selection of the most reliable peers to interact with.
Here, we have focused our attention on the second type of fault condition, i.e. degradation of communication channels. To this end, we have designed the following four types of experiments:
• Experiment 1 : centralised scenario with perfect CPU and fixed degra-dation of sensor communication channels;
• Experiment 2 : centralised scenario with CPU channel degraded at 30% and fixed degradation of sensor communication channels;
• Experiment 3 : centralised scenario with CPU channel degraded at 80% and fixed degradation of sensor communication channels;
• Experiment 4 : decentralised scenario with a fixed degradation of sensor communication channels.
Figure 24 facilitate to visualise the experiments described above. In par-ticular, it shows where the communication channel faults could be located.
Also for this suite of experiments, we adopt equivalence (B) and we con-figure variables as described in section 5.2.1. Here, however, we consider two more variables: Degradation of the CPU communication channel (F) and Degradation of reporter communication channels (G).
Table 2 summarizes the experiment configuration when a broken chan-nel fault is injected into the system. In this table, Number of moving peers,
Figure 24: Communication channel faults: centralised and decentralised strategy Variable Settings
ExpNo Info Gathering Runs F G
1 centralised 10 0% 30%
2 centralised 10 30% 30%
3 centralised 10 80% 30%
4 decentralised 10 not applied 30%
Table 2: Experiments configuration (with fault conditions)
Paths, Flooding law, Number of nodes and Number of (reporter) peers per node variables are not shown since they are instantiated as described in sec-tion 5.2.1. Briefly we remark that each experiment is run 10 times and that, at each run, only the Paths variable changes.
Regarding the new variables (F and G), we designed the experiment by chang-ing only the probability of breakdowns in the CP communication channel since we want to explore how severe is the impact of faults at the central-ising element. If we also want to explore the impact of faults in the sensor communication channels, we have to repeat the above defined experiments modifying the variable G.
5.3
Experiment setup and launch
In this section we present details of the architecture used to run experiments for the e-Response testbed. In order to run an experiment, a process for each involved peer needs to be launched. For this purpose, we developed a Java program that reads the selected configuration variables from a database and then launches the processes with different combination of parameters. Some features of the peer processes are dynamically set up at run time, reading configuration parameters from a database, according to the case we want to test. This mechanism exploits the distributed nature of the OK platform. For example, while the Discovery Service (DS) [16] is run in one server, the processes associated with the reporter peers are launched in a different machine. Peers involved in the experiment are:
• Discovery Service: it is an OK infrastructure peer. We launch only one DS peer.
• Simulator : it starts the whole simulation and it plays the controller role in many interaction models. For each experiment run we launch one simulator peer. When we launch this peer we set up the following parameters that are used in the initialization phase of the Simulation Cycles interaction model (see A-2.1.1):
– Experiment id : it identifies the current e-Response experiment. It is used to read configuration settings and to store results in the database;
– Run count : it identifies the particular run number for the above specified e-Response experiment;
– Max number of simulation cycles: it represents the duration of the simulation. It has to be sufficiently high to guarantee that all moving peers have enough time-steps to reach their destinations; – Expected number of peer connections and average peer connection time: these two parameters are used to calculate the maximum amount of seconds the simulator has to wait for connecting peers before reaching a connection timeout and going on with the exe-cution of the interaction model;
– Water level threshold : this value sets the minimum water level beyond which a road is considered blocked. It strongly affects the outcome of an experiment run.
• Flood sub-simulator : it is the peer that simulates the flood evo-lution event in Trento. We only have one flood sub-simulator peer. At run time we dynamically set up a parameter in the flooding law implementation that regulates the flood evolution rate for the current simulation: we decide how many time-steps correspond to one hour in the real world.
• Emergency Chief : it starts the evacuation phase by sending to a moving peer the directive to go to a specific destination. This goal, for each moving peer involved in the current run, is set up dynamically reading the experiment configuration in the database. We have only one peer of this class.
• Moving peer : it is the peer that during the simulation goes from a starting node to a specific destination. In all experiments we ran we have only a moving peer but the database schema and the Java program are designed to launch any number of peers in parallel. This program is also used to configure other parameters like the peer name, the peer selection strategy (randomly, trust score based, user based,
etc.), its initial position and the experiment type (i.e. centralised or decentralised).
• Route Service: it provides a route that connects two given locations. We have only one peer of this class.
• Civil Protection: it gives information on the blockage state of a given path. For this peer we dynamically set up the peer selection strategy and the state of the communication channel. In the suite of experiments run, the channel is always ideal (with infinite band and without breakdowns), but the database is designed to have any probability of errors in the transmission. We have only one peer of this class.
• Reporters network : it is a collection of peers that gives informa-tion on the water level registered at their locainforma-tion. In our experiments it turns to be a service peers network, i.e., a set of sensors perma-nently placed at a location. We launch about 70 sensor peers using the methodology described in [19].
5.3.1 Database description
Figure 25: Entity-Relationship diagram for the e-Response experiment
The entity-relationship (ER) diagram of Figure 25 represents the overall logical structure of the database used in the e-Response summative experi-ment. It shows only the most meaningful entities and relationships.
The most important entity is experiment . It is defined by a description, the total number of runs for each experiment, the total number of sensor peers that will be launched, the maximum duration of the simulation expressed in