2017
Publication Year
2020-08-27T14:11:17Z
Acceptance in OA@INAF
The active nucleus of the ULIRG IRAS F00183-7111 viewed by NuSTAR
Title
Iwasawa, K.; Spoon, H. W. W.; COMASTRI, Andrea; GILLI, Roberto; LANZUISI,
Giorgio; et al.
Authors
10.1051/0004-6361/201730950
DOI
http://hdl.handle.net/20.500.12386/26894
Handle
ASTRONOMY & ASTROPHYSICS
Journal
606
Number
DOI:10.1051/0004-6361/201730950 c ESO 2017
Astronomy
&
Astrophysics
The active nucleus of the ULIRG IRAS F00183–7111 viewed
by NuSTAR
?
K. Iwasawa
1, 2, H. W. W. Spoon
3, A. Comastri
4, R. Gilli
4, G. Lanzuisi
4, 5, E. Piconcelli
6, C. Vignali
4, 5, M. Brusa
4, 5,
and S. Puccetti
71 Institut de Ciències del Cosmos (ICCUB), Universitat de Barcelona (IEEC-UB), Martí i Franquès, 1, 08028 Barcelona, Spain e-mail: [email protected]
2 ICREA, Pg. Lluís Companys 23, 08010 Barcelona, Spain
3 Cornell University, Astronomy Department, Ithaca, NY 14853, USA
4 INAF–Osservatorio Astronomico di Bologna, via Gobetti, 93/3, 40129 Bologna, Italy
5 Dipartimento di Fisica e Astronomia, Università di Bologna, via Gobetti, 93/2, 40129 Bologna, Italy 6 INAF–Osservatorio Astronomico di Roma, via Frascati 33, 00040 Monteporzio Catone, Italy 7 Agenzia Spaziale Italiana-Unità di Ricerca Scientifica, via del Politecnico, 00133 Roma, Italy Received 6 April 2017/ Accepted 8 August 2017
ABSTRACT
We present an X-ray study of the ultra-luminous infrared galaxy IRAS F00183–7111 (z= 0.327), using data obtained from NuSTAR, ChandraX-ray Observatory, Suzaku and XMM-Newton. The Chandra imaging shows that a point-like X-ray source is located at the nucleus of the galaxy at energies above 2 keV. However, the point source resolves into diffuse emission at lower energies, extending to the east, where the extranuclear [O
iii
]λ5007 emission, presumably induced by a galactic-scale outflow, is present. The nuclear source is detected by NuSTAR up to the rest-frame 30 keV. The strong, high-ionization Fe K line, first seen by XMM-Newton, and subsequently by Suzaku and Chandra, is not detected in the NuSTAR data. The line flux appears to have been declining continuously between 2003 and 2016, while the continuum emission remained stable to within 30%. Further observations are needed to confirm this. The X-ray continuum below 10 keV is characterised by a hard spectrum caused by cold absorption of NH∼ 1 × 1023cm−2, compatible to that of the silicate absorption at 9.7 µm, and a broad absorption feature around 8 keV which we attribute to a high-ionization Fe K absorption edge. The latter is best described by a blueshifted, high-ionization (log ξ ∼ 3) absorber with a column density of NH∼ 1 × 1024cm−2, similar to the X-ray high-velocity outflows observed in a number of active nuclei. No extra hard component, which would arise from a strongly absorbed (i.e. Compton-thick) source, is seen in the NuSTAR data. While a pure reflection scenario (with a totally hidden central source) is viable, direct emission from the central source of L2−10 keV ' 2 × 1044erg s−1, behind layers of cold and hot absorbing gas may be an alternative explanation. In this case, the relative X-ray quietness (Lx/Lbol,AGN≤ 6 × 10⁻³), the high-ionization Fe line, strong outflows inferred from various observations, and other similarities to the well-studied ULIRG/QSO Mrk 231 point that the central source in this ULIRG might be accreting close to the Eddington limit.Key words. galaxies: active – galaxies: individual: IRAS F00183–7111 – X-rays: galaxies
1. Introduction
IRAS F00183–7111 is an ultra-luminous infrared galaxy (ULIRG) with log L(1–1000 µm) = 9.9 × 10¹² L
(Spoon et al. 2009) at z = 0.327 and shows an archetypal absorption-dominated mid-infrared spectrum with no polycyclic aromatic hydrocarbon (PAH) feature detected at 6.2 µm (Spoon et al. 2004). The silicate absorption depth at 9.7 µm is however shal-lower than those in the branch of deeply obscured sources (e.g. NGC 4418, IRAS F08572+3915) in the “fork diagram” of Spoon et al. (2007). This apparent shallowness of the silicate depth could be a result of dilution by the continuum which leaks through ruptured absorbing screen, and it led Spoon et al. (2007, 2009) to suggest that IRAS F00183–7111 may be in the early phase of disrupting the nuclear obscuration to evolve into the quasar regime. The fast outflow signatures found in the mid-infrared lines (Spoon et al.2009) and the VLBI-scale radio jets
? This research has also made use of data obtained from ESO tele-scopes at the La Silla Paranal Observatory. The ESO VLT data are under programme IDs 386.B-0346, 088.B-0405, and 090.B-0098.
(Norris et al.2012) appear to support this picture. The radio lu-minosity is in the range of powerful radio galaxies and the ra-dio excess with respect to the infrared emission (Roy & Norris 1997; Drake et al.2004) indicates presence of a powerful ac-tive galactic nucleus (AGN). A XMM-Newton observation de-tected a hard-spectrum X-ray source with a 2–10 keV luminos-ity of ∼1044 erg s−1. The X-ray spectrum shows a strong Fe K feature, suggesting that a Compton thick AGN with a much larger luminosity is hidden in this ULIRG (Nandra & Iwasawa 2007; Ruiz et al.2007). The Fe K line is, however, found at the rest-frame 6.7 keV, indicating Fe
xxv
, i.e. highly ionized line-emitting medium, which is unusual for an obscured AGN as it normally shows a Fe K feature dominated by a 6.4 keV line from cold Fe (less ionized than Fexvii
).The fast outflow signature of IRAS F00183–7111 was first identified by the optical [O
iii
]λ5007 kinematics and the ionized gas extends by ∼10 arcsec to the east of the nucleus (Heckman et al. 1990). Much more enhanced outflow signatures were found in the blueshifted mid-IR lines of [Neii
]λ12.81 µm and [Neiii
]λ15.56 µm with velocity widths of FWZI ∼ 3000 km s−1A&A 606, A117 (2017) Table 1. Observation log of IRAS F00183–7111.
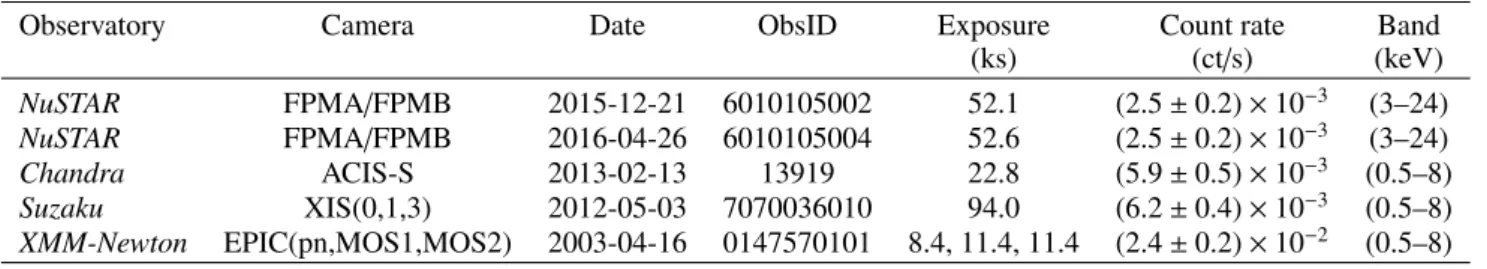
Observatory Camera Date ObsID Exposure Count rate Band
(ks) (ct/s) (keV) NuSTAR FPMA/FPMB 2015-12-21 6010105002 52.1 (2.5 ± 0.2) × 10−3 (3–24) NuSTAR FPMA/FPMB 2016-04-26 6010105004 52.6 (2.5 ± 0.2) × 10−3 (3–24) Chandra ACIS-S 2013-02-13 13919 22.8 (5.9 ± 0.5) × 10−3 (0.5–8) Suzaku XIS(0,1,3) 2012-05-03 7070036010 94.0 (6.2 ± 0.4) × 10−3 (0.5–8) XMM-Newton EPIC(pn,MOS1,MOS2) 2003-04-16 0147570101 8.4, 11.4, 11.4 (2.4 ± 0.2) × 10−2 (0.5–8)
Notes. The NuSTAR count rates are measured with a single detector in the associated band. The Suzaku count rate shows a sum of the three detectors. The XIS2 has already ceased its operation when the observation was carried out and no data are available. The XMM-Newton count rate is the sum of the three EPIC cameras.
(Spoon et al.2009), which presumably occur in the region close to the nucleus where dust obscuration hides the optical signa-tures from our view. Weak soft X-ray emission appears to be displaced from the hard X-ray position by ∼5 arcsec towards the east and is possibly associated with the extended outflow structure.
We newly acquired X-ray data from Chandra X-ray Obser-vatory (Chandra) and NuSTAR to study further the X-ray prop-erties of IRAS F00183–7111. The arcsec resolution of Chandra imaging was used to investigate the extended soft X-ray emis-sion hinted by the XMM-Newton observation. The hard X-ray spectrum obtained from NuSTAR was examined for constraining the properties of the obscured active nucleus. The Fe K emission is a key diagnostic for the nuclear obscuration and the physical condition of the nuclear medium, for which data of better quality are desired. The existing XMM-Newton data and the Suzaku data from the public archive are supplemented to study the Fe K band spectrum.
The cosmology adopted here is H0 = 70 km s−1 Mpc−1, ΩΛ = 0.72, ΩM = 0.28 (Bennett et al. 2013). For the redshift of IRAS F00183–7111 (z = 0.327), the luminosity distance is DL = 1723 Mpc and the angular-scale is 4.7 kpc arcsec−1. 2. Observations
X-ray observations of IRAS F00183–7111 with four X-ray ob-servatories, XMM-Newton, Chandra, Suzaku and NuSTAR are listed in Table 1. Our NuSTAR data of a total exposure time of 105 ks were taken in two occasions separated by four months. The data were calibrated and cleaned, using the NuS-TARDAS included in HEASOFT (v6.19). In addition to the de-fault data cleaning, some time intervals near the south atlantic anomaly (SAA) passage with elevated background were dis-carded by applying the screening with SAAMODE=optimized and TENTACLE=yes, which removed further 4 ks for the first observation. On inspecting the 3–20 keV light curve obtained from the whole field of view, short intervals (≤2 ks in total) of solar flares were noted during the first observation, which may affect the background subtraction around 10 keV (Lanzuisi et al. 2016). However, as no notable effect was found in the spectrum of the first observation, the intervals were not excluded. The NuSTARspectra obtained from the two detector modules FPMA and FPMB and the two observations agree with each other within error, and the four datasets are combined together for the anal-ysis below. The Chandra and XMM-Newton data were reduced using the standard software CIAO (v4.8) and XMMSAS (v15.0), respectively. The Suzaku data (PI: E. Nardini) were taken from the public archive and reduced using XSELECT of HEASoft.
All the spectral data were analysed using the spectral analysis package XSPEC (v12.9).
3. Results
3.1. Chandra imaging
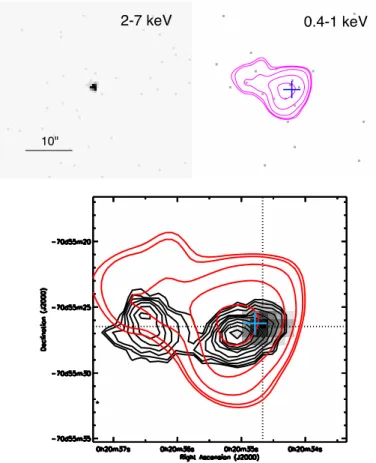
The arcsecond resolution of the Chandra image localizes an X-ray source at the position of the IRAS F00183–7111 nucleus (Fig. 1a). The source at energies above 2 keV is point-like. How-ever, the point-like source disappears below 1 keV, leaving only faint emission which extends to the east up to ∼15 arcsec, as suggested by the overlaid contours (Fig. 1b). With the expo-sure time of 23 ks, 9 counts are detected along this eastern extension in the 0.4–1 keV band outside of the 2 arcsec from the nucleus position. When the annulus of 2–18 arcsec from the nuclear position is divided azimuthally to four quadrants, the eastern quadrant contains these 9 counts and the other three con-tain 2 (northern), 3 (southern) and 1 (western). The background counts are estimated to be 1.7 ± 0.1 counts for each quadrant. The eastern region has 5 times excess counts of the background while the other regions have counts comparable to the back-ground. While we can thus only remark that detected counts are clustered on the eastern side of the nucleus, the small de-tected counts do not warrant any further imaging analysis. The one-sided extension is compatible with the eastern offset seen in the soft X-ray image of XMM-Newton (Nandra & Iwasawa 2007). The mean surface brightness of this extended emission is ∼2 × 10⁻¹⁷erg s−1cm−2arcsec−2.
It has been known that [O
iii
]λ5007 emission extends towards the east in this ULIRG (Heckman et al.1990). Our recent VLT VIMOS observation reveals more details of the optical extended nebula (Spoon et al., in prep.), and the [Oiii
] contours overlaid onto the continuum image, obtained from the VIMOS data, is shown in Fig. 1c. Note that the scale of this image differs from the X-ray images (a factor of ∼2 smaller). It is unclear whether this optical emission-line nebula is closely related to the ex-tended soft X-ray emission. They both extend towards the east and some soft X-ray photons are detected along the [Oiii
] exten-sion. However, the [Oiii
] image shows a distinctive, bright knot at 8 arcsec from the nucleus (with PA ' 270◦), which has no X-ray counterpart. In contrast, the soft X-ray emission is diffuse and the general direction of the extension may be slightly tilted towards north (PA ∼ 250◦) from that of [Oiii
].3.2. X-ray spectrum
We present results on the X-ray spectrum of IRAS F00183–7111 as follows. The iron K emission line was investigated combining
0 3.3 6.6 9.9 13 17 20 23 26 30 3
0.4-1 keV 2-7 keV
10"
+
Fig. 1.Upper-left: a) 2–7 keV Chandra image of IRAS F00183–7111. The X-ray source is point-like and coincides with the nuclear posi-tion of the ULIRG; upper-right: b) 0.4–1 keV Chandra image of the same area. The blue cross indicates the position of the 2–7 keV source. The magenta contours for a smoothed version of the same image are overlaid. The image is elongated towards the eastern direction; lower panel: c) [O
iii
]λ5007 contours (black) are overlaid on the 5007 Å con-tinuum in greyscale. The images were taken by VLT/VIMOS (Spoon et al., in prep.). The displacement between the [Oiii
] and the continuum is considered to be due to obscuration in the nucleus, as discussed in Spoon et al. (2009). The soft X-ray contours are also overlaid in red, and the 2–7 keV image centroid is marked in blue. An eastern [Oiii
] knot is seen at 8 arsec from the nucleus.the data from XMM-Newton, Chandra and Suzaku, as they have a comparable spectral resolution (Sect. 3.2.1). Then the flux vari-ability of the Fe line (Sect. 3.2.1) and the underlying 2–8 keV continuum emission (Sect. 3.2.2) between the observations was measured including the NuSTAR data. The 2–20 keV contin-uum spectrum can be described by an absorbed power-law and the cold absorbing column is constrained well, combining the NuSTAR data with the low-energy data from the other instru-ments. Then the broad-band NuSTAR spectrum was investigated for the hard band spectral properties (Sect. 3.2.3).
3.2.1. Fe K line
A line feature at 5 keV was detected by the XMM-Newton obser-vation and identified with an iron K line of Fe
xxv
at the rest-energy of 6.7 keV (Nandra & Iwasawa2007; Ruiz et al.2007). We inspected the presence of the Fe K line by further adding the data from the Chandra ACIS-S and the Suzaku XIS, which have similar spectral resolutions to that of the XMM-Newton EPIC cameras. The 3.7–7 keV (5–9 keV in the rest-frame) spectrum of a 100 eV resolution, obtained by combining XMM-Newton,5 6 7 8 9
0
5
10
FE
Rest energy (keV)
Fig. 2. Rest-frame Fe K band spectrum of IRAS F00183–7111. Data obtained from XMM-Newton EPIC cameras, Chandra ACIS-S, SuzakuXIS, were combined. The data are in flux density in units of 10−14erg s−1cm−2keV−1. The Fe line feature peaks at 6.7 keV and has a moderate width of σ ∼ 0.15 keV. For reference, the blueshifted absorp-tion model for the NuSTAR spectrum discussed in Sect. 3.2.3 (IABS2 in Table 2), supplemented by a Gaussian line for the Fe K feature, is over-plotted by the histogram in grey. The continuum level is corrected for the flux difference (see Sect. 3.2.2). The blueshifted Fe
xxv
absorption line at 8 keV predicted by the absorption model seems to be matched by the data.Chandraand Suzaku, after correcting for the respective detector responses is shown in Fig. 2 (note that this plot is only for dis-playing purposes). The plotted data were averaged with weight-ing by the signal to noise ratio. The line is now detected at 4σ significance above the neighbouring continuum in the 3.7–7 keV range with average intensity of (2.1±0.5)×10−6ph cm−2s−1. Fit-ting a Gaussian to the line feature in all the spectral data jointly gives the centroid energy of 6.69 ± 0.04 keV in the galaxy rest-frame. The line feature is resolved: σ = 0.16 ± 0.03 keV in Gaussian dispersion, which is significantly broader than that ex-pected from a Fe
xxv
complex (σ ∼ 0.02 keV). The calibration errors in energy scale for respective instruments are at the level of<10 eV (M. Guainazzi, priv. comm.), which cannot account for the broadening. The line detection and the above results on the line parameters are robust against continuum modelling (see below).The equivalent width of the line feature with respect to the local continuum is 1.3 ± 0.3 keV (the mean of the three obser-vations, corrected for the galaxy redshift). No clear 6.4 keV cold Fe K line is seen. The 90% upper limit on a narrow line at rest-frame 6.4 keV is 0.16 keV.
The Fe K line is however not detected in the NuSTAR data. We believe that the lower resolution of the detector (0.4 keV in FWHM) is unlikely to be the reason for the non detection, since it is compatible with the line width measured above and would instead be optimal for a detection. The Fe K band data with, say, 200 eV intervals, which moderately oversample the detector res-olution reveal no excess emission at around 5 keV while it would be easily detectable if the line flux remains the same. The 90% upper limit of line intensity is 1.9 × 10⁻⁶ph cm−2s−1, if the line energy and width of the XMM, Chandra and Suzaku combined spectrum are assumed. A possible line-like excess (unresolved) is instead seen at 5.4 keV (7.28 ± 0.15 keV in rest energy) with an intensity of (1.2 ± 0.5) × 10−6ph cm−2s−1, but its detection is uncertain (∼2σ). The apparent lack of the Fe K feature prompted
A&A 606, A117 (2017) 1 2 5 10 − 4 10 − 3 0.01 Ct/keV/s a) XMM 1 2 5 b) Chandra 1 2 5 10 − 5 10 − 4 10 − 3 Ct/keV/s Energy (keV) c) Suzaku 10 5 20 Energy (keV) d) NuSTAR
Fig. 3. Energy spectra of IRAS F00183–7111, observed with four X-ray observatories: a) XMM-Newton: EPIC pn (open squares) and EPIC MOS1 and MOS2 combined (solid circles); b) Chandra ACIS-S; c) Suzaku XIS0 (solid circles); XIS1 and XIS3 combined (open squares); and d) NuSTAR: FPMA and FPMB combined. The dotted-line histogram in each panel indicates the best-fit model of an absorbed power-law plus a Gaussian for the 2–20 keV data obtained by fitting to all the datasets jointly (see text). Spectral parameters are identical be-tween the observatories apart from the normalizations of the power-law and the Gaussian line. Emission below 2 keV originates from an ex-tended extranuclear region (Fig. 1). Note that the model for Fe K in (d) shows a line feature with its intensity observed with XMM-Newton for a comparison with the data.
us an investigation of line variability, as the X-ray observations of this ULIRG span over 13 yr (Table 1).
We performed a joint fitting of a Gaussian to the Fe K feature again, but the line intensity was left independent be-tween different observations. The continuum was modelled by an absorbed power-law and its normalization was left indepen-dent likewise (see Sect. 3.2.2) while power-law slope and ab-sorbing column of cold absorption were kept common between the observations. We used the 3–20 keV data from NuSTAR and 2–8 keV data from the other instruments jointly (Fig. 3). The photon index and absorbing column density as measured in the galaxy rest-frame are found to be Γ = 2.3 ± 0.2 and NH= (1.3 ± 0.3) × 1023 cm−2. The line centroid and the width, common to all the observations, are found identical to those re-ported above. The line intensity variability is plotted in Fig. 4a. The line flux appears to decline monotonically since the first ob-servation with XMM-Newton in 2003. The line flux observed with Suzaku and Chandra in 2012–2013 is about half the flux measured by XMM-Newton and the NuSTAR measurement is further down. With the four data points, the hypothesis of lin-early declining line flux, for example, is favoured by F test to a constant line flux at ∼98% confidence. However, we have only four measurements, three of which are close together. The pu-tative line variability largely relies on the high flux measured by XMM-Newton. While the consistently strong line fluxes mea-sured with the two different detectors of XMM-Newton, the pn and MOS cameras, support the reliability of the strong XMM-Newton flux, another data point after the NuSTAR observation with good quality is desirable to verify the trend of fading Fe line. 024 IFe (10 − 6 ph/s/cm 2) XMM Suzaku Chandra NuSTAR 2005 2010 2015 0.5 1 1.5 F2 − 8 Year
Fig. 4.Light curves of Fe K line (a: upper panel) and the 2–8 keV continuum (b: bottom panel) of IRAS F00183–7111, observed with four X-ray observatories over 2003–2016. The continuum flux is in units of 10−14erg s−1cm−2. Note that the joint fit determines the continuum shape better than in an individual fit, helping reducing the uncertainties of the line fluxes. The line flux appears to decrease continuously by factor of ∼4 since the first observation with XMM-Newton while the continuum flux remains at comparable level within 30%.
3.2.2. 2–8 keV continuum
In contrast to the Fe K emission, the neighbouring continuum remains at similar flux level (Fig. 4b). Fluxes of the four obser-vations derived from the joint fit in which the power-law normal-izations were left independent between the observations are used to plot Fig. 4b.
All the four measurements agree within 30%. Given the sta-tistical uncertainties of individual measurements of ∼15–20% and the general cross-calibration error of ∼10% (Ishida et al. 2011; Kettula et al. 2013; Madsen et al.2015), no significant variability in continuum flux can be observed. The most devi-ated NuSTAR flux is ∼30 ± 20% above the mean value of the other three. Even if this real, its variability is contrary to the de-clining Fe K line flux.
3.2.3. NuSTAR Hard X-ray spectrum
Here, we investigate the hard X-ray spectrum of IRAS F00183– 7111 obtained from NuSTAR (Fig. 5) which has the sensitivity at energies above 8 keV where the other instruments do not cover. With the reflection scenario in mind (Sect. 1), the original aim of this NuSTAR observation was to see whether a strongly absorbed component emerges in the hard X-ray band. Apparently, there is no such an extra hard-component above 8 keV (see Sect. 4.1 and Fig. 6 for details). A question is then whether the observed hard X-ray emission is reflected light of a totally hidden central source or its direct radiation modified by moderate absorption, which we examine here using the NuSTAR data.
The 3–20 keV data are binned so that each spectral bin has more than 14 net counts after background correction (Fig. 5a), and the χ2 minimisation was used to search for the best fits. A117, page 4 of9
10
− 510
− 410
− 3Ct/keV/s
a)
0.5
1
1.5
2
Ratio
b)
10
5
20
0.5
1
1.5
2
Ratio
Energy (keV)
c)
10 5 20 10 − 4 5×10 − 5 2×10 − 4 EF E Energy (keV)d)
APL IREFL IABS2 APL IREFL IABS2Fig. 5.a) NuSTAR count rate spectrum of IRAS F00183–7111 in the 3–20 keV band. The three solid-line histograms plotted along the spec-tral data show best-fit models of the absorbed power-law (black, APL in Table 2) and the reflection spectrum computed by xillver (red, IREFL) and the ionized absorption spectrum (blue, IABS2). All the models are folded through the detector response; b) data/model ratio for the APL model in (a); c) for IREFL (open squares) and IABS2 mod-els (filled circles); and d) three modmod-els shown above, without response folding and plotted in flux units.
The hard spectrum measured with XMM-Newton, Chandra and Suzaku is presumably caused by cold absorption of NH∼ 1 × 1023 cm−2 (Sect. 3.2.2). Since this degree of absorption can-not be constrained well by the NuSTAR data alone, because of the limited low-energy coverage (down to 4 keV in the rest frame), we impose cold absorption with NH= 1.3×1023cm−2, as
1 10 0.1 1 10 FE (10 − 14 erg/s/cm 2/keV)
Rest energy (keV)
F00183 1 10 FE (arbitrary unit) Energy (keV) fntmp.qdp NGC1068 NGC4945 F05189 Pre 2015
Fig. 6.Broad-band X-ray spectra of IRAS F00183–7111 and three ob-scured AGN with different degrees of absorption for a comparison: NGC 1068, a (cold) reflection-dominated spectrum without a trans-mitted component of the obscured nuclear source (NH≥ 1025 cm−2); NGC 4945, a reflection-dominated spectrum below 10 keV with a transmitted component of the central source emerging above 10 keV (NH∼ 3.5 × 1024cm−2); IRAS F05189–2524, moderately absorbed nu-clear source (NH∼ (6–9) × 1022 cm−2). The 0.6–8 keV data for IRAS F00183–7111 are obtained by combining the XMM-Newton, Chandra and Suzaku data. For the other three, XMM-Newton data are used for the 0.6–10 keV band. Their spectra at higher energies are all obtained from NuSTAR. All the comparison spectra show Fe K emission peaking at 6.4 keV as indicated by the dotted line whereas that in IRAS F00183– 7111 peaks at 6.7 keV (see Sect. 3.2.1). NGC 1068 and NGC 4945 ex-hibit excess features in the NuSTAR band due to a cold reflection hump and an absorbed component, respectively.
obtained from the joint fitting with the low-energy instruments (Sect. 3.2.2), in the following spectral analysis.
A simple power-law modified by the fixed cold absorption yields a photon index ofΓ = 2.39±0.16 (Table 2). This fit leaves systematic wiggles in the deviation of the data from the model as shown in Fig. 5b, indicating possible presence of an Fe K absorption edge, which corresponds to the broad deficit around 8 keV. A sharp deficit at the observed energy of 10 keV may
A&A 606, A117 (2017) Table 2. NuSTAR spectrum of IRAS F00183–7111.
Model Γ log ξ log NH,i χ2/d.o.f.
(1) (2) (3) (4) (5)
APL 2.32+0.16−0.16 – – 22.5/17
IREFL 2.08+0.11−0.12 3.5+0.3−0.2 – 15.0/16 IABS1 2.38+0.17−0.18 3.1+0.2−0.3 24+0−0.4 19.8/15 IABS2† 2.45+0.15−0.15 3.0+0.1−0.2 24+0−0.2 9.6/14
Notes. The NuSTAR 3–20 keV spectrum was fitted with various models. (1) Fitted models, APL: a power-law modified by cold absorption with NH= 1.3 × 1023cm−2, which is included in all the models; IREFL: an ionized reflection spectrum computed by xillver; IABS1: a power-law modified by ionized absorption computed by XSTAR (warmabs version 2.2); and IABS2: same as IABS1 except that a velocity shift of the absorber is permitted (†
the best fitted value indicates a blueshift of −0.18+0.02−0.01c). (2) Photon index; (3) logarithmic value of the ionization parameter ξ of reflecting medium or absorber in units of erg cm s−1; (4) logarithmic value of column density of the ionized absorber NH,iin units of cm−2; (5) χ2over degrees of freedom.
be an artefact due to background (NuSTAR Observatory Guide 2014). Including an absorption edge model, edge, improves the fit and gives an edge threshold energy of ∼7.5 keV (9.9±0.3 keV in the rest frame) with an optical depth of τ = 0.9 ± 0.3. The edge energy suggests highly ionized Fe. However, a sharp, single edge, as described by the edge model, is inappropriate for high-ionization Fe, as an absorption spectrum would instead consist of a series of absorption features from a range of ionization (Kallman et al.2004), which has to be computed by photoion-ization models like XSTAR (Kallman & Bautista2001). Alter-natively, such an absorption feature appears also strongly in a reflection spectrum when reflection occurs in an optically thick, ionized medium. Below we test the two hypotheses of ionized reflection and direct emission modified by an ionized absorber.
We first compare the data with the ionized reflection spec-trum computed with xillver of García et al. (2013). A thick slab assumed for reflecting medium, e.g. an accretion disc, in xillver is an approximation to the relatively thick reflecting medium. In fitting to the XMM-Newton, Chandra and Suzaku spectra, the Fe line feature drives the fit and gives the ionization parameter of the reflecting medium of log ξ = 3.2 ± 0.1. Fitting it to the NuSTAR data alone finds a higher value of ionization pa-rameter, log ξ= 3.5+0.3−0.2, which has the reduced sharp line and the increased Compton-broadened component, matching better the broad hump around 5 keV and the weak line (IREFL in Table 2, Fig. 5).
Secondly, the absorption model is tested, introducing an ion-ized absorber to account for the high-ionization Fe K edge fea-ture in addition to the cold absorber. No Fe emission line is in-cluded. We used the analytic XSTAR model warmabs (Kallman 2016) to compute an ionized absorption spectrum to compare with the data. Since no obvious absorption lines of Fe
xxv
and Fexxvi
are visible in the NuSTAR data, we assumed that these lines are too narrow to be resolved and chose a small turbulent velocity of vturb= 200 km s−1.Fitting the ionization parameter and the column density of the ionized absorber gives log ξ = 3.1 ± 0.2 and NH,i = 1 × 1024 cm−2. (Note the best-fit column density is just below the maximum value computed for the model and the upper bound of the error is not obtained.) When the ionized absorber is allowed
to be blueshifted (IABS2), as expected for a high-velocity out-flow, the fit improves with similar absorber parameters and the blueshift of −0.18+0.02−0.01c(Table 2, Fig. 5).
The residuals of the fits with IREFL and IABS2 are shown in Fig. 5c to compare with Fig. 5b from the absorbed power-law (APL). Those three spectral models before folding through the detector response are shown in Fig. 5d, illustrating that the Fe absorption-edge feature and its shift to the higher energy is a key to match the data. Between the reflection and absorption models, the (blueshifted) absorption model gives a better fit than the reflection model but with more free parameters. Given the fitting quality, we cannot say the absorption model is strongly preferred over the reflection model, e.g. a test by Bayesian in-formation criterion (BIC, Schwarz1978) favours the absorption model but the difference in BIC (∆BIC = 2.6) indicates its pref-erence is positive but not sufficiently strong (Kass & Raftery 1995). A critical test would be a detection of the Fe absorp-tion lines with higher-resoluabsorp-tion data. The CCD resoluabsorp-tion, e.g. FWHM ∼ 150 eV, would suffice if they exist. We returned to the XMM-Newton, Chandra and Suzaku data to see whether one of the absorption features due to Fe
xxv
at the observed energy of 6 keV is present. There is marginal (2σ) evidence of an ab-sorption line at 6.07 ± 0.05 keV (the rest-frame 8.05 ± 0.07 keV, see Fig. 2), when all the datasets are jointly fitted by a Gaussian. The line is unresolved (the 90% upper limit of the dispersion is 0.35 keV) and the intensity is (−3.2±1.6)×10−7ph cm−2s−1, cor-responding to the equivalent width with respect to the neighbour-ing continuum is EW = −0.16±0.08 keV. The IABS2 model ob-tained for the NuSTAR data, adjusted to the continuum level and with the Gaussian for the Fe K emission, is shown in Fig. 2. The data are compatible in the line energy and its depth predicted by the absorption model. The unresolved line is consistent with the small turbulent velocity chosen for the model. Albeit the detec-tion is inconclusive, the possible absorpdetec-tion line is found where the blueshifted absorption model predicts.4. Discussion
4.1. Nuclear obscuration
The NuSTAR spectrum of IRAS F00183–7111 reported in this paper shows no spectral hardening at high energies (>8 keV, as shown by the spectral fits in Sect. 3.2.3), which would be observed if either reflection from cold medium, expected from a Compton thick AGN, or direct emission from a central source modified by a large absorbing column of NH> 1024cm−2 is present. This is illustrated by Fig. 6, where the rest-frame broad-band X-ray spectrum of IRAS F00183–7111 is com-pared with three obscured AGN with different degrees of ab-sorption. The spectrum of IRAS F00183–7111 is composed of the 0.6–10 keV data, made from the XMM-Newton, Chan-dra and Suzaku data, and the 8–20 keV NuSTAR data while those of NGC 1068 (Marinucci et al.2016), NGC 4945 (Puccetti et al. 2014) and IRAS F05189–2524 (Teng et al. 2015) are
XMM-Newton and NuSTAR combined data. Observed below
10 keV in NGC 1068 and NGC 4945 are reflected light only and their spectra show upturns at energies above 10 keV due to a reflection hump (Matt et al. 1997) and a strongly ab-sorbed continuum (NH' 3.5 × 1024 cm−2), respectively. Such a spectral upturn lacks in the hard-band spectrum of IRAS F00183–7111, which rather resembles the moderately absorbed spectrum of IRAS F05189–2524. It leaves two possible in-terpretations for the origin of the hard X-ray emission from the ULIRG. Firstly, it could be reflected light of a hidden
10 15 40 42 44 46 log ν Lν [erg/s] log νrest [Hz] F00183 Mrk231 Arp220
Fig. 7.Radio to hard X-ray spectral energy distribution (SED) of IRAS F00183–7111 (in red). The radio data, submillimetre to infrared data, and the optical to UV data are taken from Norris et al. (2012, references therein), Spoon et al. (2009) and NED, respectively. For comparison, the SEDs of Arp 220 and Mrk 231, normalised to the far-infrared peak of IRAS F00183-7111, are overplotted in light grey and blue, respectively. This gives a convenient way to see the spectral differences between the three SEDs. The Spitzer IRS low-resolution spectra of the three sources are also included. Strong radio and X-ray excess emission from the ac-tive nucleus and the mid-IR emission from hot dust are evident in IRAS F00183–7111 and Mrk 231, relative to Arp 220. Note that Mrk 231 is becoming more radio-loud in recent years than those the data plotted (Reynolds2017).
AGN from a highly ionized medium, as originally suggested by Nandra & Iwasawa (2007) and Ruiz et al. (2007). Direct emission from the central source has to be totally suppressed by cold gas of an extremely large absorbing column, e.g., NH≥ 1025cm−2. Reflection off a highly ionized medium would have a continuum spectrum similar to the direct emission (e.g., García et al. 2013), keeping the NuSTAR band spectral slope steep, as observed. It naturally explains the strong Fe
xxv
line observed with XMM-Newton, Chandra and Suzaku. Secondly, the hard X-ray emission could be of a moderately absorbed cen-tral source which we see directly, as suggested by resemblance of the overall spectral shape with that of IRAS F05189–2524 with the absorption column density of NH' (0.6–0.9) × 1023 cm−2 (Severgnini et al.2001; Imanishi & Terashima2004; Ptak et al. 2003; Grimes et al.2005; Iwasawa et al.2011; Teng et al.2015). Spectral fitting based on these two interpretations were made against the NuSTAR spectrum in Sect. 3.2.3. Here we discuss their likelihoods, combining with other information.4.1.1. Reflection scenario
Detection of a strong Fe line is generally considered to be good evidence for a Compton thick AGN, as it leaves a reflection-dominated spectrum below 10 keV. We refer to Nandra & Iwasawa (2007) for detailed discussion of the reflection sce-nario. Here, we look into a few outstanding problems with this interpretation.
One peculiar feature in IRAS F00183–7111 (as a Compton thick AGN) is the high-ionization (Fe
xxv
) Fe line. Normally, the Fe K feature in Compton thick AGN is dominated by a cold line at 6.4 keV, which originates from a Compton-thick absorberitself. Even when any high-ionization lines are present (e.g. in NGC 1068, Iwasawa et al. 1997), they are minor components of the Fe K complex and the 6.4 keV line is always the ma-jor feature. On the contrary, a cold Fe line is not detected in IRAS F00183–7111 (see Sect. 3.2.1). In the reflection scenario, the central source is assumed to be hidden from our direct view by cold gas of an extreme thickness (thus invisible). Irradiation of the obscuring gas by the central source however produces re-processed X-ray emission characterised by, e.g. a 6.4 keV Fe line, and part of it enters our view, unless obscuration is very thick and the coverage is complete. This may occur in nuclear sources of some extreme objects like Arp 220 (Scoville et al. 2017). However, in IRAS F00183–7111, AGN-heated hot dust emission clearly visible in infrared (Spoon et al.2004), for ex-ample, provides evidence against such an extreme form of ob-scuration (see the SED comparison in Fig. 7 for the strong con-trast of mid-IR dust emission between IRAS F00183–7111 and Arp 220). Thus the lack of reprocessed X-ray features from cold gas of a putative Compton thick absorber is somewhat puzzling in the reflection scenario.
Another critical issue is the line variability (Sect. 3.2.1). If the line were indeed variable, the disconnected variability be-tween the line and continuum would give a problem with the reflection scenario, since both originate in the same process and they should vary in unison. A further line flux measurement with, e.g., XMM-Newton, will provide a critical test against it.
The fit to the NuSTAR data (Sect. 3.2.3) shows that the re-flection model is still viable. In that case, the ionized reflecting medium has to be sufficiently optically thick (NH≥ 1024 cm−2) to produce the edge absorption feature. The observed silicate depth might be diluted by leaked IR continuum emission and the true column density of cold clouds responsible for the silicate absorption could then be much larger than the apparent value NH' 1.7 × 1023cm−2(Spoon et al.2004) to provide a Compton-thick absorption towards the central X-ray source.
4.1.2. Direct emission scenario
In the direct emission scenario, absorption by cold gas is moder-ate (NH' 1.3 × 1023cm−2), but in addition to that, a blue-shifted, highly ionized absorber with a large column NH∼ 1024 cm−2 is required to account for the absorption feature around 8 keV observed in the NuSTAR spectrum (Sect. 3.2.3, Table 2). The column density of the cold absorber is compatible with that in-ferred from the silicate absorption (Spoon et al.2004). The high-ionization absorber has an high-ionization parameter of log ξ ∼ 3 and is only detectable in X-ray. The inferred blueshift v ' 0.18c lies in the range of high-velocity outflows found in growing number of Seyfert galaxies and quasars (e.g., Tombesi et al.2010). Given the presence of powerful outflow signatures observed in mid-IR (Spoon et al.2009), optical (Heckman et al.1990) and possibly radio (Ruffa et al., in prep.) bands, detection of X-ray outflowing gas comes as no surprise.
The 2–10 keV luminosity corrected for both cold and high-ionization absorption is found to be 2.1 × 1044erg s−1. Discount-ing the ∼14% starburst contribution (the star formation rate, SFR of 220 M yr−1, Mao et al.2014; 230 M yr−1, Ruffa et al., in prep.), we estimate the AGN bolometric luminosity of IRAS F00183–7111 to be 3.3 × 1046f−1 erg s−1, where f (<1) is a covering factor of obscuring dust shrouds which absorb radia-tion from the central source and reemit in infrared. This gives
L2−10/Lbol,AGN ∼ 6 × 10⁻³f (or the X-ray bolometric
correc-tion kbol ∼ 150 f−1). This value is smaller than that of typical AGN, e.g., ∼0.02 for a normal quasar with a similar bolometric
A&A 606, A117 (2017)
luminosity (Marconi et al.2004), but comparable to those mea-sured in local U/LIRGs, including IRAS F05189–2524 (e.g. Imanishi & Terashima2004) or in AGN accreting at a high Ed-dington ratio (λ = Lbol,AGN/LEdd). We will return to the latter point later.
The absorption model fit applied to the NuSTAR spectrum ig-nores the Fe emission-line observed with XMM-Newton, Chan-draand Suzaku. Unless the line-emitting gas is hidden from our view by some contrived change in the nuclear obscuration, e.g. a passage of a Compton thick cloud (Sanfrutos et al. 2016), the Fe line strength needs to be explained by the illumination of the central source. The observed mean line luminosity is (7 ± 2) × 1042 erg s−1. XSTAR predicts, with the enhanced flu-orescence yield of high-ionization Fe (e.g., Matt et al. 1996), compatible line luminosity can just be produced by photoioniza-tion of thick medium of NH∼ 1×1024cm−2with log ξ= 3 by the central source discussed above, under favourable conditions, e.g. a large covering factor, without suppression by the ionized ab-sorber. Unlike the absorbing gas, the line emitter has to be bound in the nucleus as it is observed at the rest energy while their ion-ization states are similar. The line emitter could be the accre-tion disc surface or the dense, base part of the outflowing wind. Alternatively, it could also be optically thin gas on a pc-scale. Although the line flux variability is not conclusive (Sect. 3.2.1), its decline might be reverberation if a large flare of the central source occurred before the 2003 XMM-Newton observation. 4.2. Similarities to Mrk 231, high accretion rate
Besides the high infrared luminosity, strong outflow signatures (Spoon et al.2009; Heckman et al.1990) and the high-ionization gas inferred from the X-ray Fe features hint that the black hole in IRAS F00183–7111 may be accreting close to the Eddington limit (λ ∼ 1), although there is no reliable way to measure its black hole mass. If the above hypothesis of a moderately ab-sorbed source is correct, the nuclear source is relatively X-ray quiet, which means a large X-ray bolometric correction, kbol, or a steep optical/UV to X-ray spectral slope. In the correlation di-agram of kbol−λ for the COSMOS Type I AGN (Lusso et al. 2010), kbolof IRAS F00183–7111 corresponds to λ ∼ 1.
We noticed that IRAS F00183–7111 shares interesting mul-tiwavelength properties with the well-studied local ULIRG/BAL quasar, Mrk 231. Mrk 231 exhibits strong galactic-scale out-flows (Feruglio et al. 2010; Fischer et al. 2010; Cicone et al. 2012; Veilleux et al.2016) as well as X-ray high-velocity winds (Feruglio et al. 2015), has an X-ray quiet nuclear source (log (L2−10/Lbol) ∼ −3), shows an Fe
xxv
emission-line (Reynolds et al.2017; Teng et al. 2014), and has a compact pc-scale ra-dio source (Reynolds et al.2013). We note that the L2−10/Lbol estimated for IRAS F00183–7111 (Sect. 4.1.2) becomes even closer to that of Mrk 231, if the covering factor f is smaller than unity. Mrk 231 was not as radio-loud as IRAS F00183–7111 (Fig. 7) but is becoming more radio-loud in recent years with el-evated radio activity (Reynolds et al.2017). Curiously, the mid-IR AGN tracer [Nev
]λ14.32 µm is not detected in either objects (Armus et al.2007; Spoon et al.2004, 2009). Contrary to the common wisdom for AGN being variable X-ray sources, both IRAS F00183–7111 and Mrk 231 show stable intrinsic bright-ness over years.The black hole mass and the AGN bolometric luminosity of Mrk 231 have been estimated in various methods but with large uncertainties. Among the black hole mass measurements rang-ing from 1.3 × 10⁷ M to 6 × 10⁸ M (Tacconi et al. 2002; Davies et al.2004; Dasyra et al. 2006; Kawakatu et al. 2007;
Leighly et al. 2014) and the AGN bolometric luminosity estimates of (0.4–1.1)×1046erg s−1(Lonsdale et al.2003; Farrah et al.2003; Veilleux et al.2009; Leighly et al.2014), we picked the respective medians (MBH= 8.7 × 10⁷M by Kawakatu et al. 2007; and Lbol,AGN = 8.4 × 1045 erg s−1by Leighly et al.2014) and obtained an Eddington ratio of λ= 0.76 for Mrk 231. It in-dicates that the black hole in Mrk 231 is likely operating close to the critical accretion rate (e.g., Veilleux et al.2016). This may also be supported by radio ejection events observed in the com-pact radio source (Reynolds et al.2017), if analogy to the stel-lar mass black holes (e.g., Fender et al.2004) applies, as radio ejection events occur only when they are accreting at λ ∼ 1 in the activity hysteresis. The production of the radio emission is thus not of the “radio mode” in the low accretion-rate regime but of the critical accretion, as seen in some radio-loud objects like 3C 120 (e.g. Ballantyne et al.2004).
The characteristic similarities mentioned above suggest that IRAS F00183–7111 could also be a source of a high accretion rate. The major divider between the two objects is the cold, line-of-sight absorber which imprints the deep silicate absorp-tion in the mid-IR spectrum of IRAS F00183–7111. Instead, the weak silicate absorption and the constraint on the jet an-gle (<25◦, Reynolds et al.2013) suggest that the inner nuclear structure in Mrk 231 is nearly face-on. The AGN bolometric lu-minosity means a larger black hole mass in IRAS F00183–7111: MBH∼ 3 × 10⁸f−1M for λ= 1. In fact, Type II AGN at z ∼ 2.5 showing high-ionization Fe K feature in the COSMOS field are found to be hosted by Hyperluminous (Lir ∼ 1013 L ) IR galax-ies with their IR SED similar to IRAS F00183–7111 and their nuclei are suspected to accrete close to λ = 1 (Iwasawa et al. 2012). Assuming both objects have a critical accretion disc, we speculate the cause of the strangely stable X-ray luminosity ob-served in the two sources might be a high optical depth of the thick disc where the central source is located. Photon trapping starts to take effects on an X-ray source around λ ∼ 0.2 (e.g., Wyithe & Loeb2012) and multiple Thomson scatterings would smear out their intrinsic X-ray variability, although long term variability is difficult to wipe out by this effect. Strong outflows observed in both objects are a natural consequence of critical accretion discs (e.g. Ohsuga et al.2002; Begelman2012).
Acknowledgements. The scientific results reported in this article are based on observations made by Chandra X-ray Observatory, Suzaku, NuSTAR and XMM-Newton, and has made use of the NASA/IPAC Extragalactic Database (NED) which is operated by the Jet Propulsion Laboratory, California Institute of Tech-nology under contract with NASA. Support for this work was partially provided by NASA through Chandra Award Number GO2-13122X issued by the Chan-draX-ray Observatory Center, which is operated by the Smithsonian Astrophys-ical Observatory for and on behalf of the NASA under contract NAS8-03060. K.I. acknowledges support by the Spanish MINECO under grant AYA2016-76012-C3-1-P and MDM-2014-0369 of ICCUB (Unidad de Excelencia “María de Maeztu”). Support from the ASI/INAF grant I/037/12/0 – 011/13 is acknowl-edged (A.C., M.B., E.P., G.L., R.G. and C.V.).
References
Armus, L., Charmandaris, V., Bernard-Salas, J., et al. 2007,ApJ, 656, 148
Ballantyne, D. R., Fabian, A. C., & Iwasawa, K. 2004,MNRAS, 354, 839
Begelman, M. C. 2012,MNRAS, 420, 2912
Bennett, C. L., Larson, D., Weiland, J. L., et al. 2013,ApJS, 208, 20
Cicone, C., Feruglio, C., Maiolino, R., et al. 2012,A&A, 543, A99
Dasyra, K. M., Tacconi, L. J., Davies, R. I., et al. 2006,ApJ, 651, 835
Davies, R. I., Tacconi, L. J., & Genzel, R. 2004,ApJ, 613, 781
Drake, C. L., McGregor, P. J., & Dopita, M. A. 2004,AJ, 128, 955
Farrah, D., Afonso, J., Efstathiou, A., et al. 2003,MNRAS, 343, 585
Fender, R. P., Belloni, T. M., & Gallo, E. 2004,MNRAS, 355, 1105
Feruglio, C., Maiolino, R., Piconcelli, E., et al. 2010,A&A, 518, L155
Feruglio, C., Fiore, F., Carniani, S., et al. 2015,A&A, 583, A99
Fischer, J., Sturm, E., González-Alfonso, E., et al. 2010,A&A, 518, L41
García, J., Dauser, T., Reynolds, C. S., et al. 2013,ApJ, 768, 146
Grimes, J. P., Heckman, T., Strickland, D., & Ptak, A. 2005,ApJ, 628, 187
Heckman, T. M., Armus, L., & Miley, G. K. 1990,ApJS, 74, 833
Imanishi, M., & Terashima, Y. 2004,AJ, 127, 758
Ishida, M., Tsujimoto, M., Kohmura, T., et al. 2011,PASJ, 63, S657
Iwasawa, K., Fabian, A. C., & Matt, G. 1997,MNRAS, 289, 443
Iwasawa, K., Sanders, D. B., Teng, S. H., et al. 2011,A&A, 529, A106
Iwasawa, K., Mainieri, V., Brusa, M., et al. 2012,A&A, 537, A86
Kallman, T. R. 2016, XSTAR Manual Version 2.2 (NASA Goddard Space Flight Center)
Kallman, T., & Bautista, M. 2001,ApJS, 133, 221
Kallman, T. R., Palmeri, P., Bautista, M. A., Mendoz, C., & Krolik, J. H. 2004,
ApJS, 155, 675
Kass, R. E., & Raftery, A. E. 1995,J. Am. Stat. Assoc., 90, 773
Kawakatu, N., Imanishi, M., & Nagao, T. 2007,ApJ, 661, 660
Kettula, K., Nevalainen, J., & Miller, E. D. 2013,A&A, 552, A47
Lanzuisi, G., Perna, M., Comastri, A., et al. 2016,A&A, 590, A77
Leighly, K. M., Terndrup, D. M., Baron, E., et al. 2014,ApJ, 788, 123
Lonsdale, C. J., Lonsdale, C. J., Smith, H. E., & Diamond, P. J. 2003,ApJ, 592, 804
Lusso, E., Comastri, A., Vignali, C., et al. 2010,A&A, 512, A34
Madsen, K. K., Harrison, F. A., Markwardt, C. B., et al. 2015,ApJS, 220, 8
Mao, M. Y., Norris, R. P., Emonts, B., et al. 2014,MNRAS, 440, L31
Marconi, A., Risaliti, G., Gilli, R., et al. 2004,MNRAS, 351, 169
Marinucci, A., Bianchi, S., Matt, G., et al. 2016,MNRAS, 456, L94
Matt, G., Fabian, A. C., & Ross, R. R. 1996,MNRAS, 278, 1111
Matt, G., Guainazzi, M., Frontera, F., et al. 1997,A&A, 325, L13
Nandra, K., & Iwasawa, K. 2007,MNRAS, 382, L1
Norris, R. P., Lenc, E., Roy, A. L., & Spoon, H. 2012,MNRAS, 422, 1453
Ohsuga, K., Mineshige, S., Mori, M., & Umemura, M. 2002,ApJ, 574, 315
Ptak, A., Heckman, T., Levenson, N. A., Weaver, K., & Strickland, D. 2003,ApJ, 592, 782
Puccetti, S., Comastri, A., Fiore, F., et al. 2014,ApJ, 793, 26
Reynolds, C., Punsly, B., O’Dea, C. P., & Hurley-Walker, N. 2013,ApJ, 776, L21
Reynolds, C., Punsly, B., Miniutti, G., O’Dea, C. P., & Hurley-Walker, N. 2017,
ApJ, 836, 155
Roy, A. L., & Norris, R. P. 1997,MNRAS, 289, 824
Ruiz, A., Carrera, F. J., & Panessa, F. 2007,A&A, 471, 775
Sanfrutos, M., Miniutti, G., Dovˇciak, M., & Agís-González, B. 2016,Astron. Nachr., 337, 546
Schwarz, G. E., 1978,Annals Stat., 6, 461
Scoville, N., Murchikova, L., Walter, F., et al. 2017,ApJ, 836, 66
Severgnini, P., Risaliti, G., Marconi, A., Maiolino, R., & Salvati, M. 2001,A&A, 368, 44
Spoon, H. W. W., Armus, L., Cami, J., et al. 2004,ApJS, 154, 184
Spoon, H. W. W., Marshall, J. A., Houck, J. R., et al. 2007,ApJ, 654, L49
Spoon, H. W. W., Armus, L., Marshall, J. A., et al. 2009,ApJ, 693, 1223
Tacconi, L. J., Genzel, R., Lutz, D., et al. 2002,ApJ, 580, 73
Teng, S. H., Brandt, W. N., Harrison, F. A., et al. 2014,ApJ, 785, 19
Teng, S. H., Rigby, J. R., Stern, D., et al. 2015,ApJ, 814, 56
Tombesi, F., Cappi, M., Reeves, J. N., et al. 2010,A&A, 521, A57
Veilleux, S., Kim, D.-C., Rupke, D. S. N., et al. 2009,ApJ, 701, 587
Veilleux, S., Meléndez, M., Tripp, T. M., Hamann, F., & Rupke, D. S. N. 2016,
ApJ, 825, 42