Alma Mater Studiorum – Università di Bologna
Dottorato di Ricerca in Ingegneria Elettronica, Informatica
e delle Telecomunicazioni
Ciclo XXI
ING-INF/05
Biometric Fingerprint Recognition Systems
Tesi di Dottorato di:
Dott. Matteo Ferrara
Relatore:
Chiar.mo Prof. Ing. Dario Maio
Coordinatore:
Chiar.ma Prof.ssa Ing. Paola Mello
I
NDEX
INTRODUCTION _____________________________________________________ 1
1 BIOMETRIC SYSTEMS AND FINGERPRINTS ________________________ 5
1.1 BIOMETRIC SYSTEMS _______________________________________________ 5
1.1.1 AHISTORICAL OVERVIEW __________________________________________ 7
1.1.2 AGENERIC BIOMETRIC SYSTEM MODEL _______________________________ 9
1.1.3 PERFORMANCE OF A BIOMETRIC SYSTEM ______________________________ 11
1.1.4 BIOMETRIC CHARACTERISTICS ______________________________________ 15
1.2 FINGERPRINTS ___________________________________________________ 17
1.2.1 HISTORY _______________________________________________________ 17
1.2.2 ANALYSIS AND REPRESENTATION ___________________________________ 19
1.2.3 APPLICATIONS __________________________________________________ 21
2 FINGERPRINT ACQUISITION SENSORS AND THEIR QUALITY _____ 23
2.1 INTRODUCTION __________________________________________________ 23
2.2 IMAGE QUALITY SPECIFICATIONS ___________________________________ 27
2.3 TEST APPROACH _________________________________________________ 30
2.4 EXPERIMENTS ON A SINGLE PARAMETER ______________________________ 31
2.4.1 ACQUISITION AREA ______________________________________________ 33
2.4.2 OUTPUT RESOLUTION _____________________________________________ 34
2.4.3 GEOMETRIC ACCURACY ___________________________________________ 36
2.4.4 SPATIAL FREQUENCY RESPONSE ____________________________________ 38
Biometric Fingerprint Recognition Systems
2.4.6 FINGERPRINT GRAY RANGE ________________________________________ 42
2.4.7 RESULT ANALYSIS _______________________________________________ 44
2.5 NEW IMAGE QUALITY SPECIFICATIONS FOR SINGLE FINGER SCANNERS _____ 47
2.5.1 PROPOSED IQS __________________________________________________ 47
2.5.2 IMPACT OF THE IQS ON THE RECOGNITION ACCURACY ___________________ 49
2.6 ESTIMATING IMAGE FOCUSING IN FINGERPRINT SCANNERS _______________ 52
2.6.1 MTF AND CTFMEASURES _________________________________________ 53 2.6.2 IQM __________________________________________________________ 55 2.6.3 TOP SHARPENING INDEX ___________________________________________ 56 2.6.4 EXPERIMENTAL RESULTS ___________________________________________ 59 2.7 CONCLUSIONS ____________________________________________________ 66 3 MINUTIA CYLINDER-CODE_______________________________________ 68 3.1 INTRODUCTION ___________________________________________________ 68
3.2 MOTIVATIONS AND CONTRIBUTIONS __________________________________ 70
3.3 THE LOCAL STRUCTURES ___________________________________________ 72
3.3.1 THE CYLINDER OF A GIVEN MINUTIA __________________________________ 73
3.3.2 CREATION OF A CYLINDER-SET ______________________________________ 77
3.3.3 THE SIMILARITY BETWEEN TWO CYLINDERS ___________________________ 78
3.3.4 BIT-BASED IMPLEMENTATION _______________________________________ 80
3.4 GLOBAL SCORE AND CONSOLIDATION ________________________________ 84
3.4.1 LOCAL SIMILARITY SORT (LSS) _____________________________________ 84
3.4.2 LOCAL SIMILARITY ASSIGNMENT (LSA)_______________________________ 85
3.4.3 LOCAL SIMILARITY SORT WITH RELAXATION (LSS-R) ____________________ 85
3.4.4 LOCAL SIMILARITY ASSIGNMENT WITH RELAXATION (LSA-R) _____________ 87
3.5 EXPERIMENTAL EVALUATION _______________________________________ 88 3.5.1 BENCHMARK DATASETS ___________________________________________ 88 3.5.2 ALGORITHMS EVALUATED _________________________________________ 89 3.5.3 TEST PROTOCOL _________________________________________________ 92 3.5.4 RESULTS:ACCURACY _____________________________________________ 93 3.5.5 RESULTS:EFFICIENCY ____________________________________________ 100 3.6 CONCLUSION ____________________________________________________ 102
Index
4 PERFORMANCE EVALUATION OF FINGERPRINT VERIFICATION
SYSTEMS _________________________________________________________ 104 4.1 INTRODUCTION _________________________________________________ 104 4.2 DATABASES ____________________________________________________ 109 4.3 TEST PROTOCOL ________________________________________________ 111 4.3.1 TEST PROCEDURE _______________________________________________ 111 4.3.2 PERFORMANCE EVALUATION ______________________________________ 113 4.3.3 TREATMENT OF FAILURES _________________________________________ 113 4.4 RESULTS _______________________________________________________ 114
4.4.1 OVERVIEW OF THE ALGORITHMS ___________________________________ 114
4.4.2 OPEN CATEGORY - RESULTS ON THE FOUR DATABASES___________________ 118
4.4.3 LIGHT CATEGORY - RESULTS ON THE FOUR DATABASES __________________ 122
4.5 FVC-ONGOING _________________________________________________ 127 4.6 CONCLUSIONS __________________________________________________ 128 CONCLUSIONS ____________________________________________________ 130 INDEX OF FIGURES _______________________________________________ 132 INDEX OF TABLES ________________________________________________ 138 BIBLIOGRAPHY ___________________________________________________ 140
I
NTRODUCTION
Biometric systems are automated methods for the identification of individuals based on their physiological (e.g. fingerprint, face, hand, retina, iris) or behavioral (e.g. voice, handwriting, keystroke style) characteristics. Biometric traits, differently from passwords and ID cards, cannot be easily altered, transferred, forgotten, lost or copied. In the past few years, academic and industrial interest in biometric systems had been considerably increased by the growing demand for reliable authentication techniques and by the availability of low-cost acquisition devices. In fact, automated identification systems can be very useful in several applications: access control, time and attendance systems, automatic surveillance, data protection, network security and secure web transactions. Among others, access control verification for computer systems and environmental surveillance are today the most promising application fields for these new technologies.
Fingerprints are a very good solution in terms of uniqueness and acceptability; for this reason, they are widely adopted in civil and government applications. Moreover, nowadays automated fingerprint recognition is very fast and well suited to real-time applications. Originally, the use of fingerprints was limited to the forensic field as evidence for identification of criminals, but in the past few years several applications grew both in the civil and government field. Thanks to the increasing interest on their potential applications, research and investments in fingerprint-recognition systems considerably grew. Although this type of recognition systems are already available in the market, the research in this field is still particularly active for the following reasons: the need for making these systems more reliable and to limit their impact on privacy, and for developing suitable methodologies to evaluate their performance and to certificate their security level.
Biometric Fingerprint Recognition Systems
biometric systems and to provide innovative solutions. To this purpose, firstly the evaluation and certification of the different aspects of these systems have been analyzed, from the quality of fingerprints and acquisition devices, to the accuracy of the whole fingerprint-recognition systems and the performance of its individual modules. Secondly, a new recognition algorithm specifically-designed to achieve a high performance even on light hardware (e.g. smartcards and embedded systems) has been proposed.
The materials presented in this thesis are the result of three years of research activities and experimentations, as shown by the publications cited in bibliography [1] [2] [3] [4] [5] [6] [7] [8].
The first chapter provides a general introduction to the problem, describing biometric systems and fingerprints in detail, together with their main applications and major issues.
The second chapter explains the contributions to fingerprint acquisition devices quality-certification. At first, the specifications and the standards currently at the state-of-the-art are presented in detail. Then, a well-defined testing protocol is described and, following this protocol, a set of experiments to measure the effective impact of such specifications on the performance of automatic fingerprint recognition systems is carried out. Starting from the experimental results obtained, three new sets of balanced requirements, to certify fingerprint scanners’ quality, are proposed. Finally, the new specifications are compared with the state-of-the-art, showing that the new ones allow a better trade-off between the cost to produce a compliant scanner and the expected recognition performance on images acquired by that scanner. At present, the Italian National Center for ICT (CNIPA) uses these new specifications as a point of reference for the Italian biometric passport and identity card.
The third chapter presents a new fingerprint recognition algorithm based on a novel 3D minutia local structure representation. Thanks to the local structure invariance, fixed-length and bit-oriented coding, some simple but very effective metrics have been defined to compute local similarities and to consolidate them into a global score. Then the proposed algorithm is compared, on a reference benchmark, with three well-known techniques; the experimental results definitely prove its superiority and demonstrate the feasibility of obtaining a very effective (and interoperable) fingerprint recognition implementation for light platforms. The new algorithm is so promising that a patent has
Introduction
been filed on it.
The fourth chapter reports the work developed in the field of the performance evaluation of fingerprint recognition systems. In particular, the chapter discusses the organization and the results of the international competition FVC2006 and the design, development and organization of a revolutionary new approach to performance evaluation of fingerprint-based systems: FVC-onGoing.
Finally, the last chapter reports some concluding remarks on the work done and discusses possible future works.
1
B
IOMETRIC
S
YSTEMS AND
F
INGERPRINTS
1.1 Biometric Systems
Rapid advancements in the field of communications, computer networking and transportation, coupled with heightened concerns about identity fraud and national security, has resulted in a pronounced need for reliable and efficient identity management schemes in a myriad of applications. Traditional authentication techniques based on passwords and tokens can easily be lost, shared manipulated or stolen thereby compromising the intended security. The advent of biometrics has served to address some of the shortcomings of traditional authentication methods [8].
Biometrics is the science of recognizing the identity of a person based on the physical or behavioral attributes of the individual; therefore, a biometric system is essentially a pattern recognition system able to verify or recognize the identity of a living person on the basis of some physiological characteristics, like a fingerprint or iris pattern, or some aspects of behavior, like handwriting or keystroke patterns (see Figure 1.1).
The need for biometrics can be found in federal, state and local governments, in the military, and in commercial applications. Enterprise-wide network security infrastructures, government IDs, secure electronic banking, investing and other financial transactions, retail sales, law enforcement, and health and social services are already benefiting from these technologies. Question such as ―Is this person authorized to enter the facility?‖, ―Is this individual entitled to access the privileged information?‖, and ―Did this person previously apply for a job?‖ are routinely asked in a variety of organizations in both public and private sectors.
Biometric Fingerprint Recognition Systems
Figure 1.1 - Classification of most common biometric traits. Other biometric strategies are being developed such as those based on hand and finger veins, ear canal, facial thermogram, odor and footprints. Biometric Traits Physiological Fingerprint Palmprint Hand geometry Iris DNA Retina Ear geometry Face Behavioral Keystroke Signature Voice Gait
Chapter 1: Biometric Systems and Fingerprints
Utilizing biometrics for personal authentication is becoming convenient and considerably more accurate than current methods based on credentials (passwords, PINs and IDs).
This is because biometrics links the event to a particular individual (based on ―who you are‖ and not ―what you know‖ like passwords and PINs or ―what you have‖ such as ID card), is convenient (nothing to carry or remember), accurate and is becoming socially acceptable and inexpensive..
Although biometric technologies vary in complexity, capabilities, and performance, they all share several elements. Biometric identification systems are essentially pattern recognition systems. They use acquisition devices such as cameras and scanning devices to capture images, recordings, or measurements of an individual’s characteristics, and they use computer hardware and software to extract, encode, store, and compare these characteristics. Because the process is automated, biometric decision making is generally very fast, in most cases taking only a few seconds in real time.
1.1.1 A Historical Overview
The term "biometrics" is derived from the Greek words bios (life) and metron (to measure).
The ancient Egyptians and the Chinese played a large role in biometrics' history. Although biometric technology seems to belong in the twenty-first century, the history of biometrics goes back thousands of years. In early Egyptian history, traders were identified by their physical descriptors to differentiate between trusted traders of known reputation and previous successful transactions, and those new to the market. Possibly the first known example of biometrics in practice was a form of finger printing being used in China in the 14th century, as reported by explorer Joao de Barros. He wrote that Chinese merchants used fingerprints to settle business transactions and Chinese parents also used fingerprints and footprints to differentiate children from one another.
Others date the origins of biometrics in the 1890s to Alphonse Bertillon. He was an anthropologist and police desk clerk in Paris when he sought to fix the problem of identifying convicted criminals and turned biometrics into a distinct field of study. He developed a method of multiple body measurements (including such measures as skull
Biometric Fingerprint Recognition Systems
diameter, arm and foot length, shapes of the body in relation to movements and differential markings on the surface of the body such as scars, birth marks, tattoos, etc.) used by police authorities throughout the world for identification purpose (see Figure 1.2). Bertillon’s system of identification was not without fault. For example, it relied heavily on precise measurements for identification purposes, and yet two people working on measurements for the same person would record different findings.
Figure 1.2 - Diagram of Bertillon Measurements.
Additionally, it turned out to be the case that the features by which Bertillon based his identification system were not unique to any one individual. This led to the possibility
Chapter 1: Biometric Systems and Fingerprints
of one person being convicted of another person’s crimes. This possibility became abundantly clear in 1903 when a Will West was confused with a William West. Though it would later turn out to be the case that the two were identical twins, the issues posed by the Bertillon’s system of identification were clear. After the failure of anthropometry, the police started using finger printing on the scene, as a more efficient and accurate means of identification, which was developed by Richard Edward Henry of Scotland Yard, essentially reverting to the same methods used by the Chinese for years.
True biometric systems began to emerge in the latter half of the twentieth century, coinciding with the emergence of computer systems. In the 1960s and '70s, signature biometric authentication procedures were studied, the first semi-automatic face recognition system was developed by W. W. Bledsoe under contract to the US government, the first model of acoustic speech production was created by Gunnar Fant, and the Federal Bureau of Investigation (FBI) began its activity of developing a system to automate its fingerprint identification process.
Due to the growing demand for automatic personal recognition in our society, biometric systems have rapidly grown beyond forensic into civilian applications. Companies involved with new systems number in the hundreds and continue to improve their methods as the technology available to them advances. Prices for the hardware required continue to fall, making systems more feasible for low and mid-level budgets. As the industry grows however, so does the public concern over privacy issues. Laws and regulations continue to be drafted and standards are beginning to be developed.
Although finger printing is the most popular biometric characteristic still in use today, other biometric technologies started developing rapidly in the last quarter of the twentieth century. These techniques sought to measure human voices, hands, irises, retina, faces, etc. (see Figure 1.1).
1.1.2 A Generic Biometric System Model
Although biometric systems that use different biometric characteristics are relied on widely different technologies, in general, they are based on the same core structure. Fundamentally, a biometric system is a pattern recognition system that acquires
Biometric Fingerprint Recognition Systems
biometric data from an individual, extracts a salient feature set from the data, compares this feature set against the feature set(s) stored in a database, and executes an action based on the result of the comparison [8]. Therefore, a generic biometric system can be viewed as having four main modules (see Figure 1.3): i) a sensor module that defines the human machine interface, ii) a feature extraction module that extracts a set of relevant discriminatory features from the acquired data to represent the underlying trait, iii) a matching module that compares the extracted features against the stored template to generate a match score, and iv) a database module that stores biometric information.
Figure 1.3 - The basic block diagrams of a generic biometric system. Enrollment User Identity Sensor Pre-processing Feature Extractor Template Generator Stored Templates Biometric information User Template Verification Claimed Identity Sensor Pre-processing Feature Extractor Template Generator Stored Templates Biometric information Template Matcher (1 match) Claimed Template True/False Identification Sensor Pre-processing Feature Extractor Template Generator Stored Templates Biometric information Template Matcher (n match) All Templates User’s Identity or ―Not Identified‖
Chapter 1: Biometric Systems and Fingerprints
An important issue in designing a biometric system is to determine how an individual is recognized. Depending on the particular application context, a biometric system may operate either in the verification or/and identification mode. In the former, the system confirms or refuses an individual’s identity by comparing the acquired data with the biometric template (corresponding to the claimed identity) stored in the database. Whereas in the latter, the system performs a one-to-many comparison to recognize the person’s identity or fail if the subject is not stored in the database. Figure 1.3 shows the block diagrams of a generic biometric verification and identification systems. Both recognition modes have in common the enrollment stage; in the enrollment phase, the biometric characteristic is acquired by a biometric reader, a quality check is performed to guarantee the acquired data, the digital representation of the characteristic is processed to produce a compact representation called template, finally the resulting template is stored in the biometric database. In the verification task, first personal identification information (user’s name, PIN, etc.) is provided and a template is produced acquiring the characteristic of the individual using the biometric reader and processing it by the feature extractor. Then, the acquired template is compared against the template of a single user, retrieved from the database using the provided personal identification information. Instead, in the identification task, no personal identification information is given and the matching module compares the input template against all the templates contained in the system database. The result is either the identity of an enrolled person or the message ―not identified‖.
1.1.3 Performance of a biometric system
A biometric system rarely encounters two samples that result in exactly the same feature set. In general, this is due imperfect sensing conditions (e.g., noisy fingerprint due to sensor malfunction), alterations in the user’s biometric characteristic (e.g., respiratory ailments impacting speaker recognition), changes in ambient conditions (e.g., inconsistent illumination levels in face recognition) and variations in the user’s interaction with the sensor (e.g., occluded iris). The variability observed in the biometric feature set of an individual is referred to as intra-class variation, and the variability between feature sets originating from two different individuals is known as
Biometric Fingerprint Recognition Systems
class variation. A useful set exhibits small intra-class variation and large inter-class variation [8]. The response of a matcher in a generic biometric recognition system is usually a similarity score 𝑠 that measures the similarity between two biometric feature sets. The system decision is regulated by a threshold 𝑡: pairs of feature sets generating similarity score higher than or equal to 𝑡 are called matching pairs; whereas pairs producing scores lower than 𝑡 are called as non-matching pairs. A similarity score is known as a genuine score if it is a result of matching two biometric samples of the same user; it is known as an impostor score if it involves comparing two biometric samples originating from different users.
A generic biometric verification system makes two types of errors: i) mistaking biometric measurements from two different individuals to be from the same one (called false match or false acceptance) and ii) mistaking two biometric measurements from the same person to be from two different persons (called false non-match or false rejection). In a biometric system, the False Match Rate (FMR) can be defined as the probability that an impostor score exceeding the threshold 𝑡; in the same way, the False Non-Match Rate (FNMR) may be defined as the probability that a genuine score falling below the
threshold 𝑡. Generally to evaluate the accuracy of a generic biometric system one must
collect scores produced from a number of genuine matching (called genuine distribution), and scores generated from a number of impostor matching (called impostor distribution). Figure 1.4 reports FMR and FNMR over genuine and impostors distributions:
Figure 1.4 - FMR and FNMR for a given threshold 𝑡 are displayed over the genuine and impostor score distributions.
𝑝 1 0 Matching Score 𝑠 FMR FNMR Threshold (𝑡) Impostor Distribution Genuine Distribution
Chapter 1: Biometric Systems and Fingerprints
As shown in Figure 1.4 FMR and FNMR are functions of the system threshold 𝑡. If 𝑡 is decreased to make the system more tolerant the FMR increases and FNMR decreases; vice versa, if 𝑡 is raised to make the system more secure, then FMR decreases and FNMR increases. A system designer may not know in advance the particular application for which the system may be used. So it is advisable to report system performance at all
operating points (threshold, 𝑡) [9]. The FMR and FNMR at various values of 𝑡 can be
summarized using a Detection-Error Tradeoff (DET) curve that plots the FNMR against the FMR at various threshold and provides a more direct view of the error-vs-error
tradeoff (see Figure 1.5).
Figure 1.5 – An example of DET graph.
Additionally to the above distributions and curves, some ―compact‖ indices are also used to summarize the accuracy of a generic biometric verification system [9] [10]:
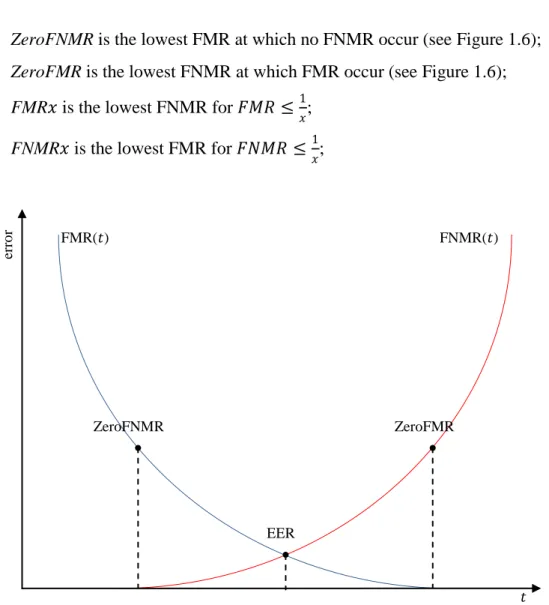
Equal-Error Rate (EER) denotes the error rate at the threshold 𝑡 for which FMR
Biometric Fingerprint Recognition Systems
ZeroFNMR is the lowest FMR at which no FNMR occur (see Figure 1.6);
ZeroFMR is the lowest FNMR at which FMR occur (see Figure 1.6);
FMR𝑥 is the lowest FNMR for 𝐹𝑀𝑅 ≤1𝑥;
FNMR𝑥 is the lowest FMR for 𝐹𝑁𝑀𝑅 ≤ 1𝑥;
Figure 1.6 - An example of FMR and FNMR curves, where the points corresponding to EER, ZeroFNMR, and ZeroFMR are highlighted.
The real performance requirements of a biometric system are very much application related. For example, in some forensic applications such as criminal identification, it is the FNMR that is a major attention and not the FMR: that is, we do not want to ignore a criminal even at the risk of manually examining a large number of potential matches identified by the biometric system. At the other extreme, a very low FMR may be the most important factor in a highly secure access control application, where the primary objective is not to let in any impostors although we are concerned with the possible inconvenience to legitimate users due to a high FNMR [9].
In the same way, the performance estimation of a generic biometric identification system can be derived by the error estimates in the verification mode.
𝑡 er ro r EER ZeroFNMR ZeroFMR FNMR(𝑡) FMR(𝑡)
Chapter 1: Biometric Systems and Fingerprints
1.1.4 Biometric characteristics
A large number of biometric characteristics are being used in various applications (see Figure 1.1) and the choice of a biometric trait for a specific use depends on a multiplicity of issues besides its matching performance. Jain et al. [11] have detected seven factors that determine the correctness of a biometric trait to be used in a specific biometric application.
1. Acceptability: Peoples in the target population that will use the application should be disposed to present their biometric characteristic to the system;
2. Circumvention: This refers to the simplicity with which the attribute of a person can be imitated;
3. Collectability: It should be possible to acquire and digitize the biometric trait using suitable devices that do not cause unjustified inconvenience to the individual;
4. Performance: The recognition accuracy and the resources required to achieve that accuracy should be meet the constraints imposed by the application;
5. Permanence: The biometric characteristic should be sufficiently invariant over a period of time with respect to the matching algorithm;
6. Uniqueness: The given trait should be adequately different across persons comprising the population;
7. Universality: Every individual accessing the application should possess the characteristic.
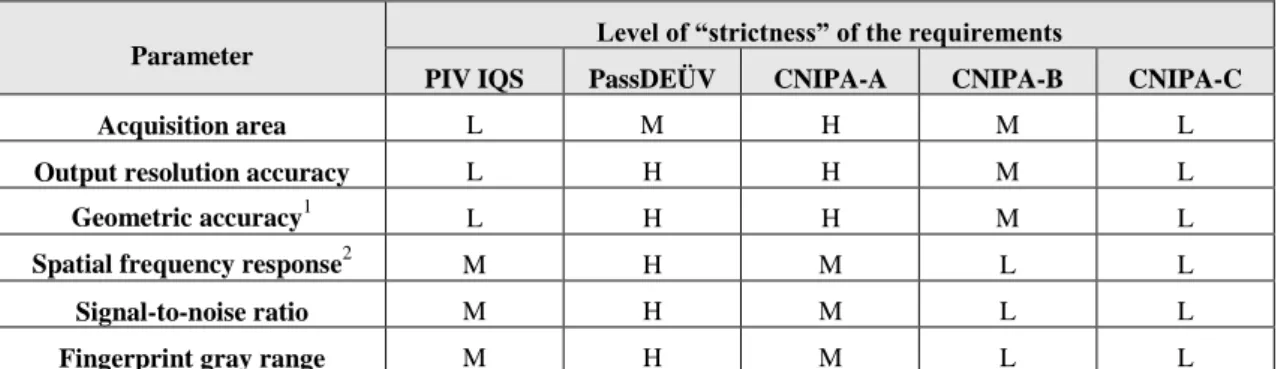
Table 1.1 shows a comparison of existing biometric characteristics in terms of those parameters. No single biometric trait is expected to effectively meet all the requirements imposed by all applications.
There is no overall best biometric trait, since the biometric trait most suited to a given application depends on many aspects, including the nature and requirements of the application itself [8]. On the other hand, from Table 1.1 it is clear that fingerprint recognition has a very good balance of all the desirable properties. Every human being possesses fingerprints, with the exception of any hand-related disabilities. Fingerprints are very distinctive; fingerprint details are permanent, even if they may momentarily change slightly to cuts and bruises on the skin or weather conditions. This is fingerprint recognition is one of the most largely adopted biometric technologies (see Figure 1.7).
Biometric Fingerprint Recognition Systems
Table 1.1 - Comparison of various biometric technologies (H=High, M=Medium, L=Low). A low ranking indicates poor performance in the evaluation criterion whereas a high ranking indicates a very good performance [12].
Acc ept a bil it y Circ um v ent io n Co llect a bil it y P er fo rma nce P er ma nence Uniq ue nes s Univ er sa lity DNA L H L H H H H Ear H M M M H M M Face H L H L M L H Facial thermogram H H H M L H H Fingerprint M H M H H H M Gait H M H L L L M Hand geometry M M H M M M M Hand vein M H M M M M M Iris L H M H H H H Keystroke M M M L L L L Odor M H L L H H H Palmprint M M M H H H M Retina L H L H M H H Signature H L H L L L L Voice H L M L L L M
Figure 1.7 – Biometric Market Report estimated the revenue of various biometrics in the year 2007. 35% 13% 25% 5% 5% 5% 3% 4% 3% 3%
2007 Comparative Market Share by Technology
AFIS/Life-Scan Face Fingerprint Hand Geometry Iris Middleware Multiple-Biometric Other Modalities Vein Voice
Chapter 1: Biometric Systems and Fingerprints
1.2 Fingerprints
A fingerprint is the pattern of ridges and valleys on the surface of a fingertip (see Figure 1.8) whose formation is determined during the first seven months of fetal development [8] and ridge configurations do not change throughout the life of a person except due to accidents. By definition, identical twins cannot be distinguished based on DNA and most of the physical characteristics such as body type, voice and face are very similar. Although the minute details in the fingerprints of identical twins are different [13]. These properties make fingerprints a very attractive biometric characteristic.
Figure 1.8 – Example of a portion of the fingertip’s surface.
1.2.1 History
Fingerprints have been found on ancient Babylonian clay tablets, seals, and pottery. They have also been found on the walls of Egyptian tombs and on Minoan, Greek, and Chinese pottery — as well as on bricks and tiles in Babylon and Rome. Some of these fingerprints were deposited unintentionally by workers during fabrication; sometimes the fingerprints served as decoration. However, on some pottery, fingerprints were impressed so deeply that they were likely intended to serve as the equivalent of a brand label.
Fingerprints were also used as substitutes for signatures. In Babylon (from 1885-1913 B.C.E.), in order to protect against forgery, parties to a legal contract impressed their
Biometric Fingerprint Recognition Systems
fingerprints into the clay tablet on which the contract had been written. By 246 B.C.E., Chinese officials impressed their fingerprints in clay seals, which were used to seal documents. With the advent of silk and paper in China, parties to a legal contract impressed their handprints on the document. Sometime before 851 C.E., an Arab merchant in China, Abu Zayd Hasan, witnessed Chinese merchants using fingerprints to authenticate loans. By 702 C.E., Japan had adopted the Chinese practice of sealing contracts with fingerprints. Supposedly, in 14th century Persia, government documents were authenticated with thumbprints.
Although the ancient peoples probably did not realize that fingerprints could identify individuals, references from the age of the Babylonian king Hammurabi (1792-1750 B.C.E.) indicate that law officials fingerprinted people who had been arrested. In China around 300 C.E. handprints were used as evidence in a trial for theft. In 650 C.E., the Chinese historian Kia Kung-Yen remarked that fingerprints could be used as a means of authentication. In his Jami al-Tawarikh, Persian official and physician Rashid-al-Din Hamadani (1247-1318) comments on the Chinese practice of identifying people via their fingerprints: "Experience shows that no two individuals have fingers exactly alike."
It was not until the late sixteenth century that the modern scientific fingerprint technique was first initiated; in 1684, the English, Nehemiah Grew, published the first scientific paper reporting his study on the ridge, valley, and pore structure in fingerprints.
Since then, a large number of researcher have invested huge amounts of effort on fingerprint studies.
An important advance in fingerprint recognition was made in 1899 by Edward Henry, who established the ―Henry system‖ of fingerprint classification.
In the early twentieth century, fingerprint recognition was formally accepted as a valid personal identification method and became a standard routine in forensics.
With the rapid expansion of fingerprint recognition in forensics, operational fingerprint databases became so huge that manual identification became infeasible (in 1924 the FBI databases contained over 800.000 fingerprint cards; today stands well over 200 million cards and the number is continuously growing). In 1969, the FBI (Federal Bureau of Investigation) and NIST (National Institute of Standards and Technology) began to invest a large amount of effort to develop a system to automate its fingerprint identification process [9]. Their efforts were so successful that today, almost every law
Chapter 1: Biometric Systems and Fingerprints
enforcement agency worldwide uses a commercial IAFIS (Integrated Automated Fingerprint Identification System).
Automatic fingerprint recognition technology has now rapidly grown beyond forensic applications into civilian applications. In fact, fingerprint-based biometric systems are so popular that they have almost become the synonym for biometric systems [9].
1.2.2 Analysis and Representation
The term fingerprint normally refers to an impression of the friction ridge of the last joint of fingers and thumbs. Fingerprints may be deposited in natural secretions, made by ink transferred from the peaks of friction skin ridges to a relatively smooth surface such as a fingerprint card or acquired by directly sensing the finger surface with an electronic fingerprint scanner [9].
The most evident structural characteristic of a fingerprint is a pattern of interleaved ridges and valleys often run in parallel (see Figure 1.9).
Figure 1.9 - Ridges and valleys in a fingerprint image.
When analyzed at the global level, the fingerprint pattern exhibits one or more zones where the ridge lines assume distinctive shapes. These zones, called singularities, may be classified into three categories: loop, delta, and whorl (see Figure 1.10) [9].
Figure 1.10 - Singular regions (white boxes) and core points (small circles) in fingerprint images. Ridges Valleys delta core loop whorl
Biometric Fingerprint Recognition Systems
At the local level, important features, called minutiae can be found in the fingerprint pattern. The term minutia refers to various ways that the ridges can be discontinuous (see Figure 1.11) [9]. Each minutia is denoted by its type, the x- and y-coordinates and the angle between the tangent to the ridge line at the minutia position and the horizontal axis ( see Figure 1.12).
Figure 1.11 - Seven most common minutiae types.
Figure 1.12 - a) a ridge ending minutia: [x0,y0] are the minutia coordinates; is the angle that the
minutia tangent forms with the horizontal axis; b) a bifurcation minutia: is now defined by means of the ridge ending minutia corresponding to the original bifurcation that exists in the negative image.
Moreover, if a fingerprint image is acquired at a high resolution (at least 1000dpi), it is possible to identify the sweat pores (see Figure 1.13) [9]. Although pore information is highly distinctive, few automatic matching techniques use pores since their reliable detection requires very high resolution and good quality fingerprint images [9].
Ridge ending
Bifurcation Lake Independent
ridge Point or Island Crossover Spur x0 y0 b) x0 y0 a)
Chapter 1: Biometric Systems and Fingerprints
Figure 1.13 – A fingerprint where pores are highlighted.
1.2.3 Applications
Fingerprint recognition is rapidly evolving technology that has been widely used in forensics and has a very strong potential to be widely adopted in a broad range of civilian applications [9].
In forensics they are used not only to link suspects to crime scenes, but also to link persons arrested under another name to previous arrests, identify deceased persons, and associate persons with questioned documents. The cumbersome and time-consuming nature of filing, searching and matching fingerprints manually led to efforts in automating parts of the process as computer technology became more readily available to law enforcement agencies [14].
Recently, in civilian applications, fingerprints have been applied to
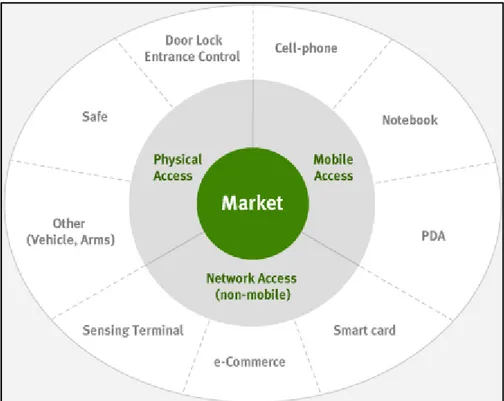
application/registration forms in an attempt to associate applicants with certain benefits (welfare, voting, banking). In many countries, it has been, and still is, a common practice to capture fingerprints for all individuals when they reach a certain age in order to issue a national identity card [14]. Figure 1.14 summarizes the main application fields in the civilian market.
Biometric Fingerprint Recognition Systems
Figure 1.14 – Graph of the main application fields of fingerprint recognition systems in the civilian market.
2
F
INGERPRINT
A
CQUISITION
S
ENSORS
AND
T
HEIR
Q
UALITY
2.1 Introduction
One of the most important elements needed for fingerprint automation was a method for scanning inked fingerprint cards that would provide images of sufficient quality for subsequent enhancement, feature extraction and matching (see Figure 2.1).
Figure 2.1 – An example of inked fingerprint card.
However, these days there is a trend to move away from capturing fingerprints on paper using ink; most of the fingerprint input devices now used in both forensic and civil fingerprint systems directly scan the fingerprint from the finger (Figure 2.2). These scanners are called ―live-scan‖ fingerprint devices. The most common types of live-scan fingerprint devices either directly digitize the fingerprint image or digitize the
Biometric Fingerprint Recognition Systems
fingerprint image created through optical means. For many civil and commercial applications, there is no mandate for a set of ten fingerprints for each individual to be recorded by the system. Often, it is sufficient for the scanning device to capture a fingerprint from a single finger [14].
Figure 2.2 – Different types of fingerprint scanners.
The most important part of a fingerprint scanner is the sensor, which is the component where the fingerprint image is formed. Almost all the existing sensors belong to one of the three families: optical, solid-state and ultrasound (see [9] for a throughout treatment of this topic).
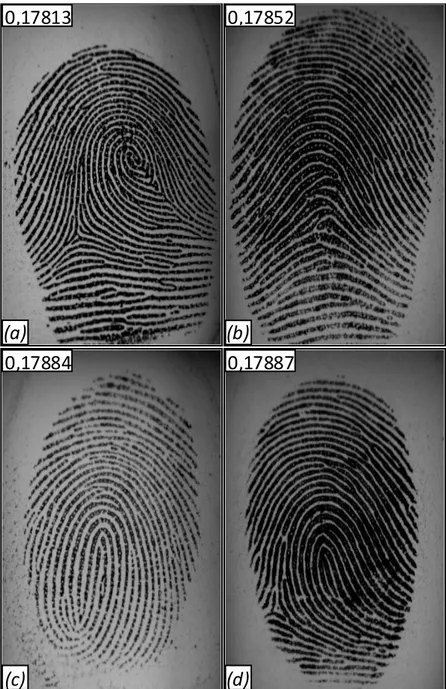
The quality of a fingerprint scanner, the size of its sensing area and the resolution can heavily influence the performance of a fingerprint recognition algorithm (as shown in Figure 2.3) (for more details see [3] [2] [1]).
Chapter 2: Fingerprint Acquisition Sensors and its Quality
Figure 2.3 – Fingerprint images of the same finger as acquired by different commercial scanners. Images are reported with right proportions: a) Biometrika FX2000, b) Digital Persona UareU2000, c) Identix DFR200, d) Ethentica TactilSense T-FPM, e) ST-Microelectronics TouchChip TCS1AD, f) Veridicom FPS110, g) Atmel FingerChip AT77C101B, h) Authentec AES4000 [9].
Particularly in large-scale biometric applications (such as the US-VISIT [16] and PIV [17] programs in the United States, the Biometric Passport in Europe [17], the Malaysian government multipurpose card [18] and the Singapore biometric passport [19] in Asia), the choice of the acquisition devices is one of the most critical issues since many, often conflicting, requirements have to be taken into account, such as the need for high-quality images, interoperability requisites and budget.
Biometric Fingerprint Recognition Systems
Typically, in large-scale projects a set of specifications is given for the input devices, in order to guarantee a minimum quality level for some relevant parameters.
To maximize compatibility between digital fingerprint images and ensure good quality of the acquired fingerprint impressions, the Federal Bureau of Investigation (FBI) established an IAFIS image-quality specification (IQS) in order to define the quantitative image-quality requirements for IAFIS fingerprint scanners. The FBI IAFIS IQS was defined in Appendix F of the Electronic Fingerprint Transmission Specification (EFTS) [20]. More recently, to support the Personal Identity Verification (PIV) program [17], whose goal is to improve the identification and authentication for access to U.S. Federal facilities and information systems, the FBI established a PIV IQS [22], which defines the quantitative image-quality requirements for single-fingerprint capture devices suitable for application in the PIV program; these requirements are similar to (but less stringent than) the IAFIS ones. Finally, the PassDEÜV requirements, targeted to single-finger scanners, were established by the German Federal Office for Information Technology Security (BSI) for the capture and quality assurance of fingerprints by the passport authorities and the transmission of passport application data to the passport manufacturers [23]. In these specifications, the ―quality‖ is defined as ―fidelity‖ of the scanner in reproducing the original fingerprint pattern, and it is hence quantified by measures traditionally used for vision, acquisition, and printing systems: geometric accuracy, gray-level dynamic range, Signal-to-Noise Ratio (SNR), Spatial Frequency Response (SFR), etc.. This definition of quality is clearly appropriate to IAFIS and other applications where the images may be examined by forensic experts. In fact human experts’ comparison techniques heavily rely on very fine details such as pores, incipient ridges, etc., for which the fidelity to the original signal is fundamental. On the other hand, the situation is different in totally-automated biometric systems, where: i) the images are stored but used only for automated comparisons, or ii) only fingerprint templates are stored. As shown in the following, in these cases it may be more appropriate to define the fingerprint scanner quality as the ability of a fingerprint scanner to acquire images that maximize the accuracy of automated recognition algorithms (in the following called operational quality) (for more details see [3] [2] [1]). A first advantage of the operational quality is that it allows to estimate the loss of performance of a scanner compliant to a given IQS with respect to an ―ideal scanner‖.
Chapter 2: Fingerprint Acquisition Sensors and its Quality
2.2 Image Quality Specifications
The IAFIS IQS was defined in Appendix F of the EFTS [20]; test procedures to verify compliance of fingerprint scanners to the specification were delineated in [23], which has been recently revised and updated in [24]. At the moment, the most updated PIV IQS are available in [22], with the corresponding test procedures described in [25]. The PassDEÜV IQS [23] are identical to the FBI IAFIS requirements except for the acquisition area. These specifications consider the following quality parameters:
Acquisition area: Capture area of the scanner (𝑤 × ).
Native resolution: The scanner’s true internal resolution (𝑅𝑁) in pixels per inch (ppi).
Output resolution: The resolution of the scanner’s final output fingerprint image (𝑅𝑂) in ppi.
Gray-level quantization: Number of gray levels in the final output fingerprint image.
Geometric accuracy: Geometric fidelity of the scanner, measured as the absolute
value of the difference 𝐷, between the actual distance 𝑋 between two points on a target and the distance 𝑌 between those same two points as measured on the output scanned image of that target; this parameter is measured in two different modalities: across bar (𝐷𝐴𝐶) and along bar (𝐷𝐴𝐿), see [24] for more details. Input/output linearity: The degree of linearity is measured as the maximum
deviation 𝐷𝐿𝑖𝑛 of the output gray levels from a linear least -squares regression
line fitted between input signal and output gray levels scanning an appropriate target (see [24]).
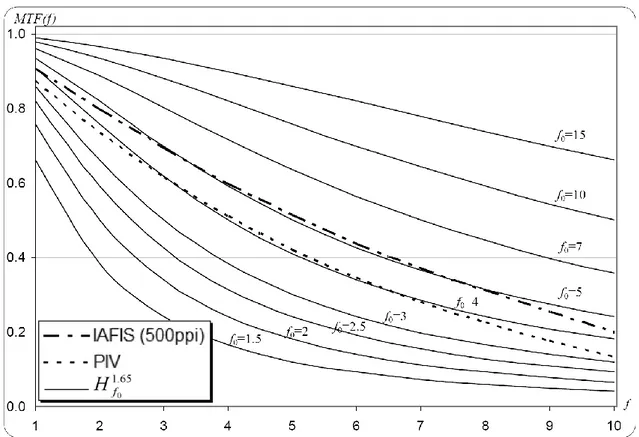
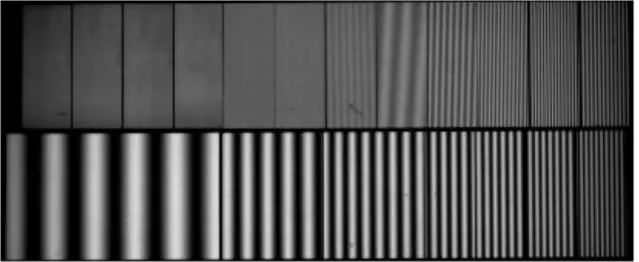
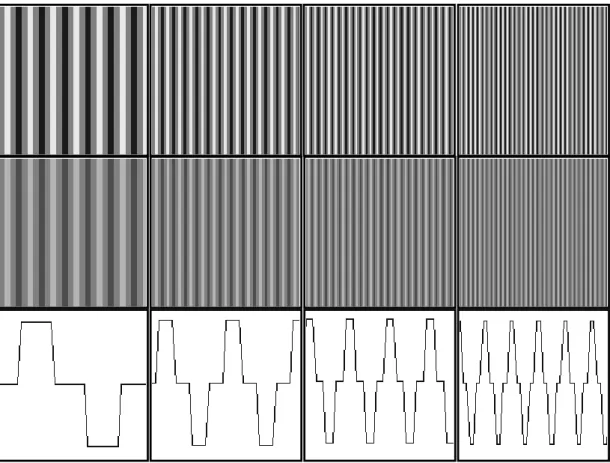
Spatial frequency response: The device modulation transfer function (MTF) measured at nominal test frequencies using a continuous-tone sine-wave target.
Gray-level uniformity: Defined as the gray-level differences found in the image
obtained by scanning a uniform dark (or light) gray target. This parameter is evaluated by dividing the acquisition area in 0.25 × 0.25-in regions and measuring the differences between: 1) the average gray levels of adjacent rows/columns (𝐷𝑅𝐶𝑑𝑎𝑟𝑘, 𝐷
𝑅𝐶𝑙𝑖𝑔 𝑡); 2) the average gray level of any region and the
gray level of each pixel (𝐷𝑃𝑃𝑑𝑎𝑟𝑘, 𝐷
Biometric Fingerprint Recognition Systems
two regions (𝐷𝑆𝐴𝑑𝑎𝑟𝑘, 𝐷 𝑆𝐴𝑙𝑖𝑔 𝑡).
Signal-to-noise ratio: The signal is defined as the difference between the average output gray levels obtained from acquisition of a uniform light gray and a uniform dark gray target, measuring the average values over independent 0.25 × 0.25-in areas; the noise is defined as the standard deviation of the gray levels in those areas, leading to two values 𝑆𝑁𝑅𝑑𝑎𝑟𝑘 and 𝑆𝑁𝑅𝑙𝑖𝑔 𝑡.
Fingerprint gray range: Given a set of scanned fingerprint images, the dynamic
range (𝐷𝑅) of each image is defined as the total number of gray levels that are present in more than four pixels.
Fingerprint artifacts and anomalies, fingerprint sharpness and detail rendition:
scanned fingerprint images are visually examined to determine whether any significant artifacts, anomalies, or false details are present.
Table 2.1 reports, for each aforementioned quality parameter, the requirements that a scanner has to meet in order to comply with the three IQS; note that the IAFIS IQS targets 500- and 1000-ppi scanners; hence, some requirements depend on the scanner resolution. The PIV and PassDEÜV IQS target only 500-ppi scanners.
Figure 2.4 - Minimum values 𝑀𝑇𝐹𝑚𝑖𝑛 𝑓 at nominal frequencies 𝑓 (expressed in cycles per 𝑚𝑚) for the IAFIS (1000ppi and 500ppi) and PIV (500ppi) IQS. Values for PassDEÜV IQS are equal to IAFIS (500ppi) IQS.
Chapter 2: Fingerprint Acquisition Sensors and its Quality
Table 2.1 - A comparison of IAFIS, PIV and PassDEÜV IQS requirements for the main quality parameters; the differences in the PIV and PassDEÜV requirements respect to the IAFIS requirements are highlighted using bold font.
Parameter Requirement
IAFIS IQS (see [20][24]) PIV IQS (see [22][25]) PassDEÜV IQS (see [23])
Acquisition area
Depending on the scanner type; for a plain 4-fingers scanner: 𝑤 ≥ 73.2𝑚𝑚 2.88” and ≥ 45.7𝑚𝑚 1.8” 𝑤 ≥ 𝟏𝟐. 𝟖𝒎𝒎 𝟎. 𝟓𝟎𝟒” and ≥ 𝟏𝟔. 𝟓𝒎𝒎 (𝟎. 𝟔𝟓𝟎”) w ≥ 𝟏𝟔. 𝟎𝐦𝐦 𝟎. 𝟔𝟑𝟎 and h ≥ 𝟐𝟎. 𝟎𝐦𝐦 𝟎. 𝟕𝟖𝟕 Native resolution 𝑅𝑁 ≥ 500𝑝𝑝𝑖 (500ppi scanners) 𝑅𝑁 ≥ 1000𝑝𝑝𝑖 (1000ppi scanners) 𝑅𝑁 ≥ 500𝑝𝑝𝑖 Output resolution 𝑅𝑂 = 500𝑝𝑝𝑖 ± 1% (500ppi scanners) 𝑅𝑂 = 1000𝑝𝑝𝑖 ± 1% (1000ppi scanners) 𝑅𝑂 = 500𝑝𝑝𝑖 ± 𝟐% 𝑅𝑂 = 500𝑝𝑝𝑖 ± 1% Gray-level quantization 256 gray-levels (8 bpp) Geometric accuracy
At least in 99% of the test measurements:
𝐷𝐴𝐶≤ 𝑚𝑎𝑥{0.0007”, 0.01 ∙ 𝑋}, 𝑋 ≤ 1.50”
(500ppi)
𝐷𝐴𝐶≤ 𝑚𝑎𝑥 0.0005”, 0.0071 ∙ 𝑋 , 𝑋 ≤ 1.50"
(1000ppi)
𝐷𝐴𝐿 ≤ 0.016”
At least in 99% of the test measurements:
𝐷𝐴𝐶 ≤ 𝑚𝑎𝑥{𝟎. 𝟎𝟎𝟏𝟑”, 𝟎. 𝟎𝟏𝟖 ∙ 𝑿}, 𝑋 ≤
1.50”
𝐷𝐴𝐿 ≤ 𝟎. 𝟎𝟐𝟕”
At least in 99% of the test measurements:
𝐷𝐴𝐶≤ 𝑚𝑎𝑥{0.0007”, 0.01 ∙ 𝑋}, 𝑋 ≤ 1.50” 𝐷𝐴𝐿 ≤ 0.016” Input/output linearity 𝐷𝐿𝑖𝑛≤ 7.65 No requirements 𝐷𝐿𝑖𝑛≤ 7.65 Spatial frequency response
For each spatial frequency f considered:
𝑀𝑇𝐹𝑚𝑖𝑛 𝑓 ≤ 𝑀𝑇𝐹 𝑓 ≤ 1.05
(see Figure 2.4 for MTFmin 𝑓 values)
For each spatial frequency f considered:
𝑴𝑻𝑭𝒎𝒊𝒏 𝒇 ≤ 𝑀𝑇𝐹 𝑓 ≤ 𝟏. 𝟏𝟐
(see Figure 2.4 for 𝑀𝑇𝐹𝑚𝑖𝑛 𝑓 values)
For each spatial frequency f considered:
MTFmin f ≤ MTF f ≤ 1.05
(see Figure 2.4 for MTFmin f values)
Gray level uniformity
At least in 99% of the cases:
DRCdark≤ 1 ; DRClight≤ 2
At least for 99.9% of the pixels:
DPPdark≤ 8 ; DPPlight≤ 22
For every two small areas:
𝐷SA𝑑𝑎𝑟𝑘≤ 3 ; 𝐷SA𝑙𝑖𝑔𝑡≤ 12
At least in 99% of the cases:
DRCdark≤ 𝟏. 𝟓 ; DRClight≤ 𝟑
At least for 99% of the pixels:
DPPdark≤ 8 ; DPPlight≤ 22
For every two small areas:
𝐷SA𝑑𝑎𝑟𝑘≤ 3 ; 𝐷SA𝑙𝑖𝑔𝑡≤ 12
At least in 99% of the cases:
DRCdark≤ 1 ; DRClight≤ 2
At least for 99.9% of the pixels:
DPPdark≤ 8 ; DPPlight≤ 22
For every two small areas:
𝐷SA𝑑𝑎𝑟𝑘≤ 3 ; 𝐷SA𝑙𝑖𝑔𝑡≤ 12 Signal-to-noise ratio1 𝑆𝑁𝑅𝑑𝑎𝑟𝑘 ≥ 125 ; 𝑆𝑁𝑅𝑙𝑖𝑔𝑡 ≥ 125 𝑆𝑁𝑅𝑑𝑎𝑟𝑘 ≥ 𝟕𝟎. 𝟔 ; 𝑆𝑁𝑅𝑙𝑖𝑔𝑡 ≥ 𝟕𝟎. 𝟔 𝑆𝑁𝑅𝑑𝑎𝑟𝑘 ≥ 125 ; 𝑆𝑁𝑅𝑙𝑖𝑔𝑡 ≥ 125 Fingerprint gray range
At least for 80% of the fingerprint images: 𝐷𝑅 ≥ 200
At least for 99% of the fingerprint images: 𝐷𝑅 ≥ 128
At least for 80% of the fingerprint images: 𝐷𝑅 ≥ 𝟏𝟓𝟎
At least for 80% of the fingerprint images: 𝐷𝑅 ≥ 200
At least for 99% of the fingerprint images: 𝐷𝑅 ≥ 128
Fingerprint artifacts and
anomalies
Artifacts or anomalies […] shall not be significant enough to adversely impact support to […] Automated Fingerprint Identification System (AFIS) search reliability. [24]
Artifacts, anomalies, […] shall not significantly adversely impact supporting the intended applications. [25]
Artifacts or anomalies […] shall not be significant enough to adversely impact support to […] Automated Fingerprint Identification System (AFIS) search reliability. [24]
Fingerprint sharpness and detail rendition
The sharpness and detail rendition […] shall be high enough to support the […] Automated Fingerprint Identification System (AFIS) search reliability. [24]
The sharpness and detail rendition […] shall be high enough to support the intended applications. [25]
The sharpness and detail rendition […] shall be high enough to support the […] Automated Fingerprint Identification System (AFIS) search reliability. [24]
1
Actually in PIV IQS this requirement is given by setting the maximum noise standard deviation to 3.5. To make it comparable with the corresponding IAFIS IQS, here this value has been provided as a 𝑆𝑁𝑅 under the hypothesis of a 247 gray-level range (see [24]): 𝑆𝑁𝑅 = 247 3.5 = 70.6.
Biometric Fingerprint Recognition Systems
2.3 Test Approach
In order to evaluate the effects of the various quality parameters on fingerprint recognition accuracy, a systematic experimentation has been carried out. Starting from a fingerprint database, for each quality parameter, the output of scanners compliant with gradually-relaxed requirements has been simulated by modifying the images with appropriate transformations. This section describes the test approach and introduces the notation that will be used in the rest of the chapter.
Off-line performance evaluation of fingerprint recognition algorithms is based on a set of genuine and impostor recognition attempts [10]. In a genuine recognition attempt, two fingerprints of the same finger are compared, while in an impostor recognition attempt, two fingerprints of different fingers are compared. From the errors made by an algorithm in these recognition attempts, it is possible to calculate performance indicators that quantify its accuracy, such as the Equal Error Rate (EER) [26].
In each genuine/impostor attempt, the first image is supposed to have been acquired during an ―enrollment‖ stage and the second during a ―verification‖ stage. In general, the scanner used during enrollment may be different from the one used during verification; for this reason, in the following definitions, any test database DB is
considered as made of two sets of images: 𝐷𝐵𝑒 (acquired during enrollment) and 𝐷𝐵𝑣
(acquired during verification). For the original database 𝐷𝐵0 = 𝐷𝐵𝑒 0, 𝐷𝐵𝑣 0 ,
which is supposed to have been acquired using an ―ideal‖ scanner, 𝐷𝐵𝑒 0 and 𝐷𝐵
𝑣 0
simply contain the original images without any modification.
For a given quality parameter 𝑄, let 𝐷𝐵𝑄𝑗 = 𝐷𝐵𝑒 𝑄𝑗, 𝐷𝐵𝑣 𝑄𝑗 be a database that simulates enrollment and verification images acquired by two fingerprint scanners compliant with a given requirement 𝑅𝑄𝑖 on 𝑄. Each image 𝐹𝑒 𝑄𝑗 ∈ 𝐷𝐵𝑒 𝑄𝑗 is obtained
from the corresponding original image 𝐹𝑒 0 ∈ 𝐷𝐵𝑒 0 by applying a transformation
𝑇𝑒𝑄 to 𝐹𝑒 0 that simulates its acquisition through the scanner used for enrollment:
𝐹𝑒 𝑄𝑗 = 𝑇𝑒𝑄 𝐹𝑒 0, 𝑗 ; similarly, for each 𝐹
𝑣 𝑄𝑗 ∈ 𝐷𝐵𝑣 𝑄𝑗, 𝐹𝑣 𝑄𝑗 = 𝑇𝑣𝑄 𝐹𝑣 0, 𝑗 , with
𝐹𝑣 0 ∈ 𝐷𝐵
𝑣 0.
For each quality parameter 𝑄 considered, an ordered set of gradually-relaxed
Chapter 2: Fingerprint Acquisition Sensors and its Quality
𝑇𝑒𝑄, 𝑇𝑣𝑄 has been defined according to a medium or large-scale application scenario
where the scanners used for enrollment and verification are not the same physical device.
Given a set of recognition algorithms {𝐴𝑖, 𝑖 = 1, … , 𝑛}, let 𝐸𝐸𝑅𝑖 𝐷𝐵0 be the EER of algorithm i on the original database, and 𝐸𝐸𝑅𝑖 𝐷𝐵𝑄𝑗 the EER of algorithm 𝐴𝑖 on 𝐷𝐵𝑄𝑗.
The dependency between the requirements on a given quality parameter 𝑄 and the recognition accuracy has been measured by considering, for each algorithm 𝑖 and for each requirement RjQ, the relative EER difference:
𝜌𝑖 𝑄𝑗 =
𝐸𝐸𝑅𝑖 DBQj − EERi DB0
EERi DB0
(2.1)
A positive value for 𝜌𝑖 𝑄𝑗 denotes a performance drop, whereas a negative value
denotes a performance improvement. Although in this work the performance variations are based on the EER, similar results have been observed using other operating points, such as FMR1000.
In the following, experimental results are reported by using box-plots, where descriptive statistics of the 𝜌𝑖 𝑄𝑗 values (i.e., how the different algorithms in the set behave for a
given 𝑗) are shown for each RjQ; see Figure 2.5 for a general example.
2.4 Experiments on a Single Parameter
The FVC2006 DB2 [28] has been selected as DB0; it consists of 1680 fingerprints
from 140 fingers (12 impressions per finger) of 50 subjects, acquired through a scanner with the following characteristics:
acquisition area: 𝑤 = 17.8𝑚𝑚, = 25.0𝑚𝑚;
Biometric Fingerprint Recognition Systems
Figure 2.5 - An example of how the results are presented in the following section. The horizontal axis reports the various requirements 𝑅𝑄𝑗, 𝑗 = 1, … , 𝑀𝑄 and the vertical axis the relative EER difference (expressed as a percentage value). The box corresponding to each 𝑅𝑄𝑗 shows descriptive statistics of the 𝜌𝑖 𝑄𝑗, 𝑖 = 1. . 𝑛 values. The median value is denoted by the line separating the two halves of the box; the mean values are marked with black points, which are connected by a line to better highlight their trend.
The choice of using this database is motivated by the following reasons:
a sufficiently-large database acquired in a real-life scenario using an IAFIS IQS compliant scanner was not available;
even if a database had been collected with such a scanner, a sufficient number of state-of-the-art algorithms tuned to work on the images produced by that device would have not been available;
the FVC2006 DB2 was collected within the European project BioSec [28] in three different European countries, following a well-defined acquisition protocol [29] and is being made available to the scientific community;
although the scanner used to acquire that database (Biometrika Fx3000) is not IAFIS IQS certified, the performance of the best algorithms on FVC2006 DB2 are extremely good (the best EER is just 0.021%): this means that the perturbations introduced by the scanner do not cause (or cause to a very limited extent) ―matchability‖ problems.
Chapter 2: Fingerprint Acquisition Sensors and its Quality
genuine recognition attempts: each fingerprint is compared against the
remaining impressions of the same finger, but avoiding symmetric comparisons, thus totaling 140×12×112 = 9240 genuine comparisons;
impostor recognition attempts: the first impression of each finger is compared against the first one of the remaining fingers, but avoiding symmetric comparisons, thus totaling 140×139
2 = 9730 impostor comparisons.
The following subsections describe the experiments performed for each quality parameter considered and report the results. In all the cases, the pair of transformations
𝑇𝑒𝑄, 𝑇𝑣𝑄 has been defined considering a worst-case scenario for a medium or
large-scale application. For instance, for the Output Resolution parameter (see Subsection 2.4.2), given a requirement of 𝑅𝑂± 2% for the resolution, the worst case is identified by a scanner with 𝑅𝑂− 2% resolution used for enrollment and one with 𝑅𝑂+ 2% resolution for verification (or vice versa).
2.4.1 Acquisition Area (𝐐 = 𝐀𝐫𝐞𝐚)
To evaluate this quality parameter, an experiment has been carried out under the following hypotheses:
each requirement 𝑅𝐴𝑟𝑒𝑎𝑗 is given as a minimum acquisition area (in square millimeters);
the acquisition area of the scanners simulated has the same aspect ratio of that used to acquire the original images (about ¾, which is also similar to the aspect ratio between the minimum 𝑤 and in the PIV IQS);
for each requirement 𝑅𝐴𝑟𝑒𝑎𝑗 , a scanner with the minimum-allowed area is used for both enrollment and verification.
The transformations are defined as follows:
𝑇𝑒𝐴𝑟𝑒𝑎 𝐹0, 𝑗 = 𝑇𝑣 𝐴𝑟𝑒𝑎 𝐹0, 𝑗 = 𝐶𝑟𝑜𝑝 𝐹0, 𝑤 𝑅𝐴𝑟𝑒𝑎𝑗 𝑤 ⋅ , 𝑅𝐴𝑟𝑒𝑎𝑗 𝑤 ⋅ (2.2)
where 𝐶𝑟𝑜𝑝 𝐹0, 𝑤′, ′ crops a 𝑤′ × ′ image from the center of image 𝐹0 (Figure 2.14.b).
Biometric Fingerprint Recognition Systems
The set of requirements 𝑅𝐴𝑟𝑒𝑎𝑗 used in the experimentation is {352, 332, 291, 271, 251, 231, 211, 191, 171, 151}; note that 𝑅𝐴𝑟𝑒𝑎7 is analogous to the PIV IQS requirement
for the acquisition area: in fact 12.8 𝑚𝑚 × 16.5 𝑚𝑚 = 211.2 𝑚𝑚2 ≈ 211 𝑚𝑚2.
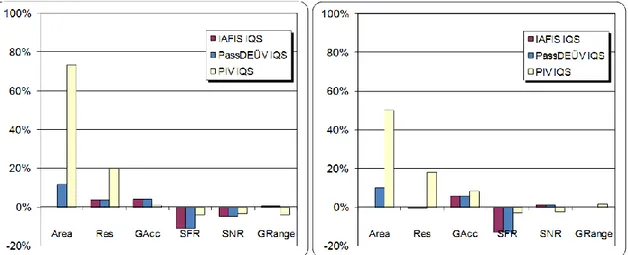
The experimental results are reported in Figure 2.6. It can be observed that, on the average, there is no significant performance change for 𝑅𝐴𝑟𝑒𝑎1 , a certain loss of accuracy
from 𝑅𝐴𝑟𝑒𝑎2 to 𝑅𝐴𝑟𝑒𝑎4 , and a clear worsening trend starting from 𝑅𝐴𝑟𝑒𝑎5 (251 𝑚𝑚2). The
average performance drop for 𝑅𝐴𝑟𝑒𝑎2 (corresponding to the PassDEÜV IQS requirement)
is 12% while, the average performance drop for 𝑅𝐴𝑟𝑒𝑎7 (corresponding to the PIV IQS requirement) is 73%.
Figure 2.6 - Box-plot of the Acquisition area experiment; the first five boxes are expanded in the inner graph to better show their statistics. The horizontal axis reports the minimum acquisition area requirements (in square millimeters) and the vertical axis the relative EER difference (expressed as a percentage value). The requirement analogous to the PassDEÜV and PIV IQS are highlighted.
2.4.2 Output Resolution (𝑸 = 𝑹𝒆𝒔)
The experiment to evaluate the effect of imposing requirements on the scanner’s output resolution has been carried out under the following hypotheses:
each requirement 𝑅𝑅𝑒𝑠𝑗 is given as a maximum percentage variation from 𝑅𝑂𝑅𝐼𝐺;
Chapter 2: Fingerprint Acquisition Sensors and its Quality
for each requirement 𝑅𝑅𝑒𝑠𝑗 , a scanner with the minimum-allowed resolution (𝑅𝑂𝑅𝐼𝐺 − 𝑅𝑅𝑒𝑠𝑗 %) is used for enrollment, and one with the
maximum-allowed resolution (𝑅𝑂𝑅𝐼𝐺 + 𝑅𝑅𝑒𝑠𝑗 %) for verification. The transformations are defined as follows:
𝑇𝑒𝑅𝑒𝑠 𝐹0, 𝑗 = 𝑅𝑒𝑠𝑎𝑚𝑝𝑙𝑒 𝐹0, −𝑅𝑅𝑒𝑠𝑗 (2.3)
𝑇𝑣𝑅𝑒𝑠 𝐹0, 𝑗 = 𝑅𝑒𝑠𝑎𝑚𝑝𝑙𝑒 𝐹0, +𝑅
𝑅𝑒𝑠𝑗 (2.4)
where 𝑅𝑒𝑠𝑎𝑚𝑝𝑙𝑒 𝐹0, Δ𝑟 resamples 𝐹0 through bilinear interpolation, to simulate an image acquired at resolution 𝑅𝑂𝑅𝐼𝐺 + Δ𝑟% (Figure 2.14.c).
The set of requirements 𝑅𝑅𝑒𝑠𝑗 used in the experimentation is {0.5%, 1.0%, 1.5%, 2.0%, 2.5%, 3.0%, 3.5%, 4.0%, 4.5%, 5.0%}; note that 𝑅𝑅𝑒𝑠2 and 𝑅𝑅𝑒𝑠4 are the IAFIS/PassDEÜV and PIV IQS requirements for the output resolution, respectively. The experimental results are reported in Figure 2.7. On the average there is no significant loss of accuracy for the first three requirements; then the average
performance drop noticeably increases from 20% for 𝑅𝑅𝑒𝑠4 (PIV IQS) to 258% for 𝑅
𝑅𝑒𝑠10 .
Figure 2.7 - Box-plot of the Output resolution experiment; the first five boxes are expanded in the inner graph to better show their statistics. The horizontal axis reports the requirements on the maximum percentage variation from the nominal output resolution (𝑅𝑂𝑅𝐼𝐺); the vertical axis reports the relative EER difference (expressed as a percentage value). The requirements of the IAFIS/PassDEÜV (±1%) and PIV (±2%) IQS are highlighted.