Alma Mater Studiorum – Università di Bologna
DOTTORATO DI RICERCA IN
ONCOLOGIA, EMATOLOGIA E PATOLOGIA
Ciclo XXXIII
Settore Concorsuale: 06/A2
Settore Scientifico Disciplinare: MED/04
In-Depth Analysis Of Metabolic Phenotype By Studying Age-
And Sex-Related Features Of Type 2 Diabetes
Presentata da:
Anna Carbó Meix
Coordinatore Dottorato Supervisore
Co-supervisore
Prof.ssa
Prof. Prof.
Manuela Ferracin
Stefano Salvioli Paolo Garagnani
2
Contents
LIST OF FIGURES ... 4 LIST OF TABLES ... 6 LIST OF ABBREVIATIONS ... 8 ACKNOWLEDGEMENTS ... 12 ABSTRACT ... 13 INTRODUCTION ... 14 1. TYPE 2 DIABETES ... 14 1. Overview ... 14 2. Epidemiology ... 14 3. Genetics... 14 4. Diagnosis ... 15 5. Motivation ... 15 2. ATHEROGENIC DYSLIPIDEMIA ... 166. Lipoproteins (LDL, VLDL, HDL), Cholesterol, Triglycerides and Apolipoproteins... 16
7. Common risk factors in cardiovascular disease and type 2 diabetes ... 19
8. Thrombosis and fibrinolysis ... 20
3. GLYCANS ... 21
9. Glycans definition ... 21
10. Glycans biosynthesis ... 21
11. Molecular diversity of glycans ... 23
12. Functions of glycans ... 23
13. Genetics of protein glycosylation ... 24
14. Environmental factors affecting protein glycosylation ... 25
MATERIALS & METHODS ... 26
15. Data description ... 26
16. Preprocessing: Clinical Database and N-glycans ... 31
17. Cohorts: controls, prediabetics, diabetics ... 36
CHAPTER 1: CHARACTERIZATION OF THE T2D-DYSMETABOLIC-AGING PHENOTYPE ... 37
4. INTRODUCTION ... 37
18. Intracellular biological roles of glycans: focus on cellular metabolism ... 38
3
20. N-glycans as biomarkers in liver diseases, aging, and age-related diseases ... 46
5. MATERIALS AND METHODS ... 54
PART I ... 55
6. AIMS ... 55
7. RESULTS ... 56
21. Demographic characteristics of the cohort ... 56
22. Prediction of (non-)diabetic status by HbA1c and by N-glycans ... 59
23. Visualization of mean values and integrated weights... 67
PART II ... 85
8. AIM ... 85
9. RESULTS ... 86
24. Sources of variation in Phenomics, T2D, Lipids, Liver, Kidney, Iron, Coagulation, Blood & Glycomics data sets ... 86
10. DISCUSSION ... 93
CHAPTER 2: ESTIMATION OF AN INNOVATIVE COMPOSITE AGING CLOCK AS BIOMARKER FOR TYPE 2 DIABETES AND RELATED METABOLIC PHENOTYPES 95 11. INTRODUCTION... 95
25. Molecular biomarkers of aging ... 96
26. Phenotypical biomarkers of aging ... 100
27. Motivation ... 101
12. MATERIALS AND METHODS ... 101
28. Materials... 101
29. Methods... 101
13. AIM ... 103
14. RESULTS... 104
30. Univariate regression models: Age ~ Variable ... 104
31. Statistical models ... 105
32. Association between “Biological Age” and “Chronological Age”, separately in sexes: ... 107
33. Association between “Biological Age” with disease (T2D) separately in sexes: ... 108
34. Associations with continuous traits or N-glycans: Trait/N-glycan ~ Phenotypical Age + Age + Sex + Group... 109
15. DISCUSSION ... 111
4
BIBLIOGRAPHY ...115
LIST OF FIGURES
Figure 1. Plasma lipid exchange. ... 17Figure 2. Association between BMI and T2D ... 19
Figure 3. Relative risk of CVD in normoglycemia, prediabetes and diabetes ... 20
Figure 4. Examples of glycans (IUPAC Gold Book) ... 21
Figure 5. Protein N-glycosylation biosynthesis ... 22
Figure 6. O-GlcNAcylation in cell metabolism ... 23
Figure 7. Biological roles of glycans proposed by Varki (2017) ... 24
Figure 8. Distribution of N-glycans without vs without clr transformation ... 32
Figure 9. Distribution of Blood Cells without vs without clr transformation ... 33
Figure 10. Metaflammation intra-organ crosstalk ... 38
Figure 11. Metaflammation inter-organ crosstalk ... 39
Figure 12. Metaflammation intracellular crosstalk ... 39
Figure 13. O-GlcNAcylation in conditions of hyperglycaemia ... 40
Figure 14. Relationship between chronic glycaemia, chronic glycosylation and insulin sensitivity ... 41
Figure 15. Hyperglycaemia, glycosylation and cardiovascular disease ... 41
Figure 16. The absence of glycosylation of Glut2 in mice fed with high fat diet impairs insulin secretion ... 42
Figure 17. Inflammasomes activation in glucotoxicity/lipotoxicity ... 42
Figure 18. Endoplasmic reticulum stress responses... 43
Figure 19. Antibody glycosylation controls antibody activity... 44
Figure 20. What comes first in RA, HIV and metabolic syndrome, disease or inflammation? ... 45
Figure 21. The relationship between AGEs and T2D/obesity ... 46
Figure 22. Glycosyltransferases enzymes ... 47
Figure 23. Summary of main findings regarding alteration of glycosylation in liver pathologies ... 47
Figure 24. Two-way orthogonal partial least squares algorithm... 54
Figure 25. Decomposed parts of the O2PLS integrations between 44 clinical variables and 10 N-glycans in four different age ranges by groups and sexes ... 60
Figure 26. Joint PC1 loading values of control males aged 20-85 y. ... 61
5
Figure 28. Joint PC1 loading values of prediabetic males aged 20-85 y. ... 63
Figure 29. Joint PC1 loading values of prediabetic females aged 20-85 y. ... 64
Figure 30. Joint PC1 loading values of diabetic males aged 20-85 y. ... 65
Figure 31. Joint PC1 loading values of diabetic females aged 20-85 y. ... 66
Figure 32. Parallel plots of groups of variables (I) ... 67
Figure 33. Parallel plots of groups of variables (II) ... 68
Figure 34. Means and weights of fasting glucose ... 68
Figure 35. Means and weights of glycated haemoglobin ... 69
Figure 36. Means and weights of HOMA ... 69
Figure 37. Means and weights of fasting insulin ... 70
Figure 38. Means and weights of BMI ... 70
Figure 39. Means and weights of WHR ... 70
Figure 40. Means and weights of total cholesterol ... 71
Figure 41. Means and weights of LDL ... 71
Figure 42. Means and weights of HDL ... 72
Figure 43. Means and weights of triglycerides ... 72
Figure 44. Means and weights of alkaline phosphatase ... 73
Figure 45. Means and weights of total bilirubin ... 73
Figure 46. Means and weights of AST ... 74
Figure 47. Means and weights of C reactive protein ... 74
Figure 48. Means and weights of creatinine ... 75
Figure 49. Means and weights of azotemia ... 75
Figure 50. Means and weights of uric acid ... 76
Figure 51. Means and weights of ferritin. ... 76
Figure 52. Means and weights of fibrinogen ... 77
Figure 53. Means and weights of haemoglobin ... 78
Figure 54. Means and weights of white cells ... 78
Figure 55. Means and weights of platelets ... 79
Figure 56. Means and weights of telomere length ... 79
Figure 57. Means and weights of GP1 ... 80
6
Figure 59. Means and weights of GP3 ... 81
Figure 60. Means and weights of GP4 ... 81
Figure 61. Means and weights of GP5 ... 82
Figure 62. Means and weights of GP6 ... 82
Figure 63. Means and weights of GP7 ... 83
Figure 64. Means and weights of GP8 ... 83
Figure 65. Means and weights of GP9 ... 84
Figure 66. Means and weights of GP10 ... 84
Figure 67. Decomposed parts of the O2PLS integrations between 8 different data sets and 10 N-glycans in four different age ranges and the total age range by groups and sexes ... 86
Figure 68. Pearson inter-correlations among the joint PCs in Ctrl M ... 88
Figure 69. Pearson inter-correlations among the joint PCs in Ctrl F ... 89
Figure 70. Pearson inter-correlations among the joint PCs in PreDiab M ... 89
Figure 71. Pearson inter-correlations among the joint PCs in PreDiab F ... 90
Figure 72. Pearson inter-correlations among the joint PCs in Diab M... 90
Figure 73. Pearson inter-correlations among the joint PCs in Diab F ... 91
Figure 74. Age acceleration among controls, prediabetics, and diabetics in both sexes ... 108
LIST OF TABLES
Table 1. Database classified variables by biomedical groups... 26Table 2. 10 N-glycans obtained with the DSA-FACE (images obtained with the Glycoworkbench software) 30 Table 3. Summary of the major glycomic signatures of T2D described in literature... 49
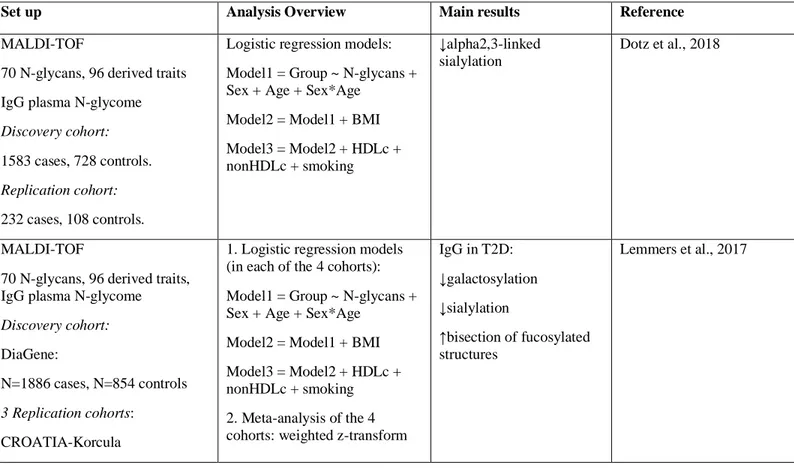
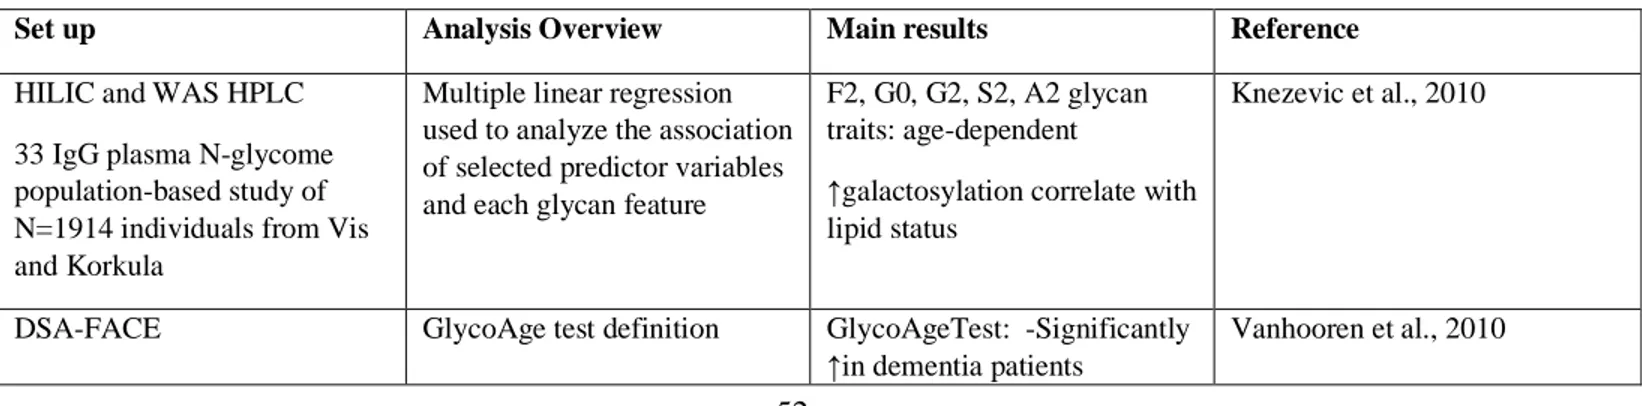
Table 4. Summary of the major glycomic signatures of aging described in literature ... 52
Table 5. Patients baseline characteristics ... 56
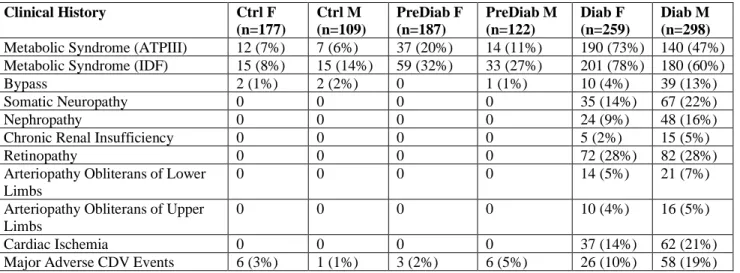
Table 6. Number and frequency of individuals that are affected by clinical conditions ... 58
Table 7. Number and frequency of individuals that take medication... 58
Table 8. Confusion matrix for HbA1c ... 59
Table 9. Confusion matrix for 10 N-glycans ... 59
Table 10. Sample size of groups by age ranges and in the full age range and frequency of individuals in each age range per group ... 60
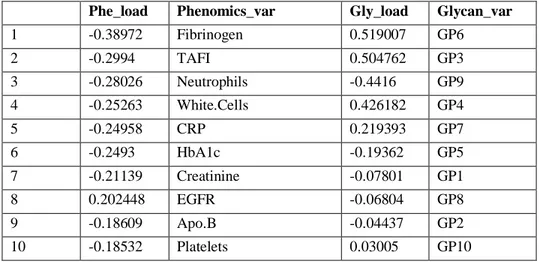
Table 11. Top 10 joint PC1 loading values of phenomics and glycomics data sets in Ctrl M ... 61
7
Table 13. Top 10 joint PC1 loading values of phenomics and glycomics data sets in PreDiab M ... 63
Table 14. Top 10 joint PC1 loading values of phenomics and glycomics data sets in PreDiab F ... 64
Table 15. Top 10 joint PC1 loading values of phenomics and glycomics data sets in Diab M ... 65
Table 16. Top 10 joint PC1 loading values of phenomics and glycomics data sets in Diab F ... 66
Table 17. Pearson intra-correlations between pairs of Phenomics/Glycomics joint scores ... 67
Table 18. Pearson intra-correlations of the joint PC scores in each pair of integrated data sets ... 87
Table 19. Top 4 loading values of the joint parts for each pair of integrated data sets ... 91
Table 20. Univariate regression models. P-value was adjusted for multiple comparisons with Benjamini-Hochberg correction at α=0.05 ... 104
Table 21. Best combination of hyperparameters calculated with cross-validation ... 106
Table 22. Metrics of model performance ... 106
Table 23. Summary output of the linear model: Predicted Age = Biological Age ~ Chronological Age ... 107
Table 24. Summary output of the multinomial logistic model: Group (Ctrl vs PreDiab/Diab) ~ Biological Age ... 108
Table 25. Pairwise comparisons using Wilcoxon’s rank sum test in KDM. P-value adjustment method: Benjamini-Hochberg. P<0.05 (*), p<0.01 (**), p<0.001 (***) at α=0.05... 109
Table 26. Association between continuous N-glycans species and Biological Age, Chronological Age, Sex and Disease Status: Trait ~ Biological Age + Chronological Age + Disease Status ... 109
Table 27. Association between continuous clinical traits and Biological Age, Chronological Age, Sex and Disease Status: Trait ~ Biological Age + Chronological Age + Disease Status ... 110
8
LIST OF ABBREVIATIONS
AD: Alzheimer’s disease
ADA: American Diabetes Association
ADCC: antibody-dependent cellular cytotoxic ADMA: asymmetric dimethylarginine
AFAR: American Federation for Aging Research Age acceleration: AgeAccel
AGE: advanced glycated end product ALD: alcoholic liver disease
ALE: advanced lipoxidation end product AMPK: AMP-activated protein kinase Apo: apolipoprotein
ASAH1: lysosomal enzyme AT: adipose tissue
ATP: adult treatment panel AUC: area under the curve BMI: body mass index CAD: coronary artery disease CCP: anti-citrullinated antibodies
CDG: congenital disorders of glycosylation CETP: cholesteryl ester transfer protein CHD: cardiovascular heart disease CI: confidence intervals
Clr: center-log ratio CM: chylomicrons CRP: C reactive protein CVD: cardiovascular disorders
DAMP: damage-associated molecular pattern DDP-4: dipeptidyl peptidase 4
9
DSA-FACE: DNA sequencer-aided fluorophore-assisted carbohydrate electrophoresis EC: endocannabinoids
EDA: exploratory data analysis
EGFR: estimated glomerular filtration rate EN: elastic net regression
ER: endoplasmic reticulum
FEV1: forced expiratory volume in one second FFA: free fatty acids
Galectin9: Gal9
GFAT: glutamine-fructose-6-phosphate transaminase GGT: gamma glutamyl transpeptidase
GP: glycan peaks
GWAS: genome-wide association studies HbA1c: glycated haemoglobin
HBP: hexosamine biosynthetic pathway HIV: human immunodeficiency virus HMGB1: high mobility group box 1 HTP: high-throughput
IAPP: Islet Amyloid Polypeptide IDF: International Diabetes Federation IDL: intermediate density lipoprotein IFG: impaired fasting glucose Ig: immunoglobulin
IGT: impaired glucose tolerance IKK2: Inhibitor kappa B kinase 2 IL: interleukin
IR: insulin receptor IR: insulin receptor
ISR: insulin receptor substrate KDM: Klemera-Doubal method
10 K-S: Kolmogorov-Smirnov test
LAL: lysosomal acid lipase LDL: Low density lipoprotein LDL-C: low density cholesterol LLFS: Long Life Family Study LPS: lipopolysaccharide MAD: mean absolute deviations
MCP-1: monocyte chemoattractant protein MS: mass spectrometry
MetS: metabolic syndrome MSE: mean-squared error
mTOR: mammalian target of rapamycin NA: missing value(s)
NHANES: National Health and Nutrition Examination Survey NLRP3: NLR family pyrin domain containing 3
O2PLS: two-way orthogonal partial least squares O-GlcNAc: O-linked β-N-acetylglucosamine O-GlcNAcylation: O-GlcNAc modification OOB: out-of-bag
OR: odds ratio
P.LRC: platelet large cell ratio PC: principal components
PCA: principal component analysis PD: Parkinson’s disease
PI3K: phosphatidylinositol-3-kinase PKC: protein kinase C
PTP1B: protein tyrosine phosphatase 1B R2: correlation
RA: rheumatoid arthritis
11 RNA: ribonucleic acid
ROS: reactive oxygen species RR: relative risk
RR: ridge regression S6K1: S6 kinase 1
SAMPs: self-associated molecular patterns SDMA: symmetric dimethylarginine SNP: single nucleotide polymorphism SOCS3: suppressor of cytokine signaling 3 SVM: support vector machine
SVR: support vector regression T1D: type 1 diabetes
T2D: Type 2 diabetes
T2DM: Type 2 diabetes mellitus
TAFI: thrombin-activatable fibrinolysis inhibitor TG: triglycerides
TNF-α: tumor necrosis factor-1 TSC1/2: tuberous sclerosis 1/2
TXNIP: thioredoxin interacting protein U: transformed units
VLDL: very low density lipoprotein WC: waist circumference
WHR: waist-to-hip ratio
12
ACKNOWLEDGEMENTS
I would like to express my gratitude to everybody who helped me during the course of the PhD. I would like to thank Claudia Sala and Cristina Giuliani for having introduced me to statistics and R programming and genetics, respectively. I would like to thank Maria Giulia Bacalini for her mentorship and feedback during my PhD closure and thesis writing. I would also like to thank Stefano Salvioli for the useful comments on PhD reports and thesis.
I would like to specially thank Noémie Génsous for her availability and help when I needed, as well as to Francesco Ravaioli, and Kat Kwiatkowska Malgorzata for hanging out some evenings.
Especial thanks to the colleagues from the IMforFUTURE project for sharing both science and fun. At the scientific level, I would like to thank: Shafiq for showing me different software for post-genomic analysis; Maarten, for helping me with code by simulating data; Arianna Landini, for her time and willingness to show me how to perform a GWAS; Tamás, for showing me a software for designing glycans; Iva, for the many discussions and shared beers, as well as for the help with the server; Zhujie, for helping me with the questions coming up, and Azra, for sharing information about glycans normalization methods. I thank Samira, Frania and Annah for the shared enjoyment during meetings.
I also would like to thank Hae-Won Uh, Zhujie Gu and Said el Bouhaddani for welcoming me at UMCU, and for the guidance and feedback for my analysis.
Per suposat, vull agrair el suport incondicional en tot de mons pares, Santi i Maria José, sense el qual no hauria arribat mai fins aquí. Vull donar també les gràcies a Míriam, el millor regal que mai m’han fet els meus pares, pel suport i la confiança durant aquests anys difícils de doctorat. També vull agrair als familiars que van contribuir que la meva estada a Bolonya fos possible: iaies Pepita i Neus, tiets Hilde i Pepi, Jordi i Tere, moltes gràcies. I voldria manifestar també el meu agraïment a les ties, Imma i Maribel, pel seu suport, així com a la resta de la família.
Per ultimo ma non meno importante, voglio ringraziare a Paolo Garagnani il suporto a livello scientifico ed emozionale, per cui senza non avrei finito il dottorato. “La vita è complicata…” La vita è la intensità di luce che scegliamo portare ad ogni posto ad ogni istante. Grazie per esserne stato un grande maestro.
13
ABSTRACT
Type 2 diabetes mellitus (T2DM) is an age-related disease characterized by chronic hyperglycaemia mainly explained by insulin resistance and impaired insulin secretion and strongly linked to dysregulation of carbohydrate, lipid and protein metabolism. T2DM is a worldwide increasing disabling disease – in 2013, the International Diabetes Federation estimated that 382 million adults suffered from T2DM and that by 2035 there will be 592 people affected. These worrisome numbers challenge biomedical research at identifying new biomarkers for the diagnosis. The purpose of this study was to analyse and integrate different sources of phenomics (clinical) data – clinical history, anthropometrical measurements, biochemical parameters, cell counts and blood differential, and medication – with glycomics data in control, prediabetics and diabetics cohorts, in order to 1) identify the major sources of variation in both data sets, 2) visualize trends or patterns in variables within- and between-omics (e.g. a combination of N-glycans highly correlated with some biochemical parameters), 3) determine whether the identified patterns ‘naturally’ cluster according to known biological sources or conditions (i.e. diagnostic T2D parameters, lipidic profile, liver, kidney, iron, coagulation biomarkers, or blood-related factors), 4) deeply study the fluctuation of clinical variables over age, by sex and by groups (Ctrl/PreDiab/Diab), and 5) estimate an aging clock based on the clinical variables and N-glycans and apply it to assess whether the groups of prediabetic and diabetic patients show an accelerated aging as compared with control, and, within each group, whether there are differences between the two sexes. The analytical methods employed were two-way partial least squares (O2PLS) and regression. Results indicate that 1) the phenomics and glycomics joint components are different among groups, 2) males and females follow a different pattern dynamics over age reflected by the relative changes of clinical variables and N-glycans, 3) intra- and inter-correlations between joint PCs obtained integrating the phenomics data set or sets of endophenotypes with the glycomics data set point to a common N-glycan signature (instead of endophenotype-specific), and 4) a model based on the Klemera-Doubal method (KDM) estimates that T2DM patients are biologically older than prediabetics and controls, being this effect more evident for male patients. Our main conclusions are that i) a combination of N-glycans could be used as complementary tool for the early diagnosis of metabolic dysregulation and/or T2D, as N-glycan changes are already present in prediabetics, ii) N-glycan peaks (GP) 1, GP2, and GP6 are confirmed as markers of aging, while GP8 and GP10 appear associated with dyslipidemia, and iii) this is the first time that prediabetics and diabetics have been included in an aging clock, as pure “healthy” controls do not exist: “the effects of atherosclerosis are superimposed on normal aging of the underlying vessel” (Wang and Bennett, 2012).
14
INTRODUCTION
1. TYPE 2 DIABETES
1.
Overview
Type 2 Diabetes (T2D) is characterized by dysregulation of carbohydrate, lipid and protein metabolism. Although it is primarily caused by insulin resistance, followed by impaired insulin secretion, T2D is a multifactorial disease involving genetic and environmental factors (DeFronzo et al., 2015).
2. Epidemiology
The epidemic of diabetes mellitus and its complications has already become a global challenge. The International Diabetes Federation (IDF) estimated that 1 in 11 adults aged 20-79 years (415 million adults had diabetes mellitus (including type 1 diabetes (T1D), T2D, gestational diabetes) in 2015. This alarming numbers are calculated to raise to 642 million by 2040, and the largest increments will come from emerging countries transitioning from low-income to middle-income wealth (IDF Diabetes Atlas, 7th Edition). However, these estimates may be, in absolute numbers, underestimated by the current pandemic of coronavirus, which is causing many deaths in this group of individuals, as glycaemic control, body mass index (BMI), T2D and cardiovascular disease are risk factors for COVID-19 mortality (Holman et al., 2020), and by other undergoing rapid demographic transitions (Zimmet, 2017). The grounds for this ascending epidemic of diabetes mellitus are numerous and diverse: population ageing, economic development, urbanization, unhealthy eating habits and sedentary lifestyles (Zheng et al., 2018). Even though the genetic background might partially determine an individual’s response to environmental stimuli (Fuchsberger et al., 2016), the main drivers are the raise in obesity, a sedentary lifestyle, energy-dense diets, and population ageing (Chatterjee et al., 2017). In fact, strong evidence points to that many cases of T2D could be prevented by keeping a healthy weight, engaging in a healthy diet, exercising daily for 30 min, avoiding smoking and consuming alcohol in moderation (Schellenberg et al., 2013; Hu et al., 2001).
3. Genetics
T2D runs in families and is heritable. The relative risk (RR) for T2D with 0 affected siblings is ~2-3 compared with siblings of non-T2D families, but, when 2 siblings are affected, the relative risk of other siblings for T2D is 30. Interestingly, the RR for T2D is higher when the mother is affected as compared to when the father is affected. Also, RR for T2D is increased if BMI ≥30 or fasting glucose concentrations >5.5 mmol/L (DeFronzo et al., 2015).
Over the last decade, plenty of genome-wide association studies (GWAS) were performed to identify common variants involved in T2D. In particular, in 2007 the Wellcome Trust Case Control Consortium (WTCCC) made a significant breakthrough by reporting single nucleotide polymorphisms (SNPs) associated with T2D (WTCCC, 2007). The strongest signal mapped in the gene TCF7L2, that up until now remains the most important SNP associated with T2D (Garagnani et al., 2013). Other genes significantly associated with T2D are CAPN10 (Horikawa et al., 2000), KCNQ1 (Yasuda et al., 2008), KCNJ11 (Gloyn et al., 2003), ABCC8 (Gloyn et al., 2003), SLC30A8
15
(Sladek et al., 2007), IDE–KIF11–HHEX (Sladek et al., 2007) and EXT2–ALX4 (Sladek et al., 2007). However, the fact that most of the genetic variants map into (unknown) non-coding regions of the genome, the problem of the missing heritability (whereby the genetic loci described explain only a small proportion of the observed heritability, possibly due to disease heterogeneity, exclusion of rare variants, gene-environment interactions, gene-gene interactions and epigenetics), modest effect sizes, and the lack of replication of many genetic variants, inter alia, hamper the comprehension of the specific role each variant may have in increasing the risk for T2D. Moreover, novel mutations cannot explain the diabetes epidemic, which is instead largely explained by the epidemic of obesity. Beyond that, the majority of non-diabetic people carry risk variants for T2D, which roughly account for ~15% of heritability (DeFronzo et al., 2015).
4. Diagnosis
The diagnosis of T2D can be made on the basis of one of the following (American Diabetes Association, 2020):
- Increased casual plasma glucose test (≥200 mg/dL) in patients with classic symptoms of hyperglycaemia or hyperglycemic crisis
- Fasting plasma glucose levels (≥126 mg/dL)
- 2h postload glucose level (≥200 mg/dL after 75g oral glucose) - Hb1Ac (≥6.5%), confirmed by repeat testing
With regard to prediabetes, the diagnosis is established by one of the following criteria (American Diabetes Association, 2020):
- Fasting plasma glucose levels (100-125 mg/dL)
- 2h plasma glucose during 75g oral glucose tolerance test (140-199 mg/dL) - Hb1Ac (5.7-6.4%)
5. Motivation
T2D is a multifactorial complex and heterogeneous disease – the clinical presentation, underlying pathophysiology and disease progression in patients with diabetes can vary remarkably among individuals and, at times, atypical manifestation of symptoms can make clear-cut classification of prediabetes and diabetes difficult –. In addition, diabetes often overlaps with other complex pathologies, such as obesity or cardiovascular disease, and/or it may evolve to vascular complications. In this doctorate studies, in order to investigate the complexity of the disease, I made use of a rich database comprising up to 55 variables, that could be grouped in clinical and anthropometrical measurements, biochemical parameters (diagnostic parameters of T2D, lipid profile, liver profile, kidney profile, cell counts and blood differential) and N-glycans. Besides, we aimed to take into account the heterogeneity of all individuals, not only prediabetics and diabetics, but also controls, since above a certain age (~60 years) the definition of healthy controls blurs with preclinical age-related diseases. To achieve that, we grouped patients by sex and age ranges. Accordingly, the following subsections of the general introduction tackle the contextualization of the variables that are used in this research.
16
2. ATHEROGENIC DYSLIPIDEMIA
6. Lipoproteins (LDL, VLDL, HDL), Cholesterol, Triglycerides and
Apolipoproteins
The insolubility of cholesterol and triglycerides (TG) in plasma requires that they are transported in macromolecules named lipoproteins, which are composed of a hydrophobic core containing phospholipid, fat-soluble antioxidants and vitamins, and cholesteryl ester, and a hydrophilic coat that contains free cholesterol, phospholipid and apolipoprotein molecules (reviewed from Hegele, 2009). Lipoproteins can be grouped according to their densities: chylomicrons (CM), very low density lipoprotein (VLDL), low density lipoprotein (LDL), intermediate density lipoprotein (IDL), and high density lipoprotein (HDL). CM and VLDL are the main TG-carrying lipoproteins, while the main cholesterol-carrying lipoproteins are LDL and HDL (reviewed from Hegele, 2009). The terms “cholesterol”, “LDL”, and “LDL cholesterol (LDL-C)” are often used interchangeably, but they have different meanings. LDL refers to the particles circulating in fasting blood. Instead, the LDL-C term is used in clinical practice as a measure of the total amount of cholesterol contained in LDL particles, since plasma LDL level is generally not measured directly. Cholesterol is an essential component of cell membranes and a precursor of bile acids and steroid hormones; it can be of exogeneous and endogenous origin and it is transported to peripheral cells, mostly by Apo B – containing lipoproteins in plasma (reviewed from Ference et al., 2017). Analogous to LDL-C, HDL-C is the measure of the total amount of cholesterol contained in HDL particles.
Patients with T2D often have lipid profiles that seem more benign than those of other high-risk individuals without T2D. Generally, LDL-C levels in diabetic individuals are not higher than in non-diabetic individuals who are matched for age, sex, and body weight. Indeed, the most frequent LDL-C level is “borderline high” (130-159 mg/dL) (The Expert Panel, 2002). Besides, high LDL-C levels (>160 mg/dL) are not found at higher rates in T2D individuals. Nevertheless, LDL-C has an important role in cardiovascular disease (CVD) in both T2D and non-T2D individuals. In fact, LDL-C levels may underestimate CVD risk in T2D (Buse et al., 2007). This is due to the LDL fraction characteristic in T2D individuals: small, dense particles with less cholesterol than normal-sized LDL particles, which are exceptionally atherogenic (Krentz, 2003; Marcovina and Packard, 2006; Goldberg, 2001). Such atherogenic nature of LDL particles in T2D individuals accounts for that the small, dense LDL particles are more handily oxidized and glycated and can more easily penetrate the arterial wall than larger LDL particles. As a result, atherosclerosis is enhanced and atherosclerotic plaques can increase migration and apoptosis of vascular smooth muscle cells (reviewed from Nesto, 2008). Accordingly, individuals with T2D have a two- to threefold increased risk for CVD (myocardial infarction, stroke, peripheral vascular disease) compared with non-diabetics, and CVD is responsible for ∼80% of mortality in T2D patients (Morrish et al., 2001). LDL-C not only presents a major role in T2D, but it also interacts with risk factors of the metabolic syndrome that multiply the risk of CVD. As an example, increased small, dense LDL particles and raised triglycerides seem to be tied to insulin sensitivity. Insulin resistance in skeletal muscle fosters hepatic TG synthesis, which in the long-run generates a large amount of atherogenic TG-rich lipoprotein particles, specially VLDL. In turn, many TG molecules from VLDL are exchanged for cholesterol in LDL particles, which leads to the formation of TG-enriched (and cholesterol-depleted) LDL. These LDL particles will become smaller and denser through the TG hydrolysis mediated by the hepatic lipase. Hence, adverse changes in LDL particles are positively correlated
17
with TG levels. Once TG levels exceed 100 mg/dL, small, dense LDL particles predominate (reviewed from Nesto, 2008). Figure 1 shows that when plasma concentrations of VLDL are high, cholesteryl ester transfer protein (CETP) will exchange VLDL triglyceride (TF) for cholesteryl ester (CE) in the core of LDL and HDL particles. This triglyceride can then be converted to free fatty acids by the actions of plasma lipases, primarily hepatic lipase. The net effect is a decrease in density of both LDL and HDL particles (Goldberg, 2001).
Figure 1. Plasma lipid exchange.
In this line, the Adult Treatment Panel III (ATP) report of the National Cholesterol Education Program considers elevated LDL-C as the primary target of lipid-lowering therapy for reducing CVD risk (NCEP, 2001). Conversely, some a posteriori studies claim that apo B and apoA1 may, indeed, be more powerful lipid-related predictors of risk for CVD (Packard, 2003; Sniderman et al., 2003; Walldius and Jungner, 2004).
Apo B-100 is a master protein component of the pro-atherogenic VLDL, IDL and LDL particles, each containing one Apo B molecule. Thus, plasma Apo B levels reflect the total numbers of the pro-atherogenic particles. TG endogenously synthesized in the liver are transported with VLDL particles into plasma, where they undergo lipolysis to IDL by the action of lipoprotein lipase. IDL, in turn, is lipolyzed by hepatic lipase, giving rise to LDL, or taken up by the liver via the LDL receptor. Apo B is also fundamental for the binding of LDL particles to the LDL receptor for cellular uptake and removal of LDL particles. In contrast, Apo A1 is the main apolipoprotein component of the anti-atherogenic HDL, and thus Apo A1 concentrations are strongly associated with HDL-C levels. Apo A1 is essentially involved in removing excess cholesterol from tissues and embedding it into HDL for reverse transport through the macrophage ATP-binding cassette transporter ABCA1 (reviewed from Chan and Watts, 2006). Chan and Watts (2006) compared different observational studies that used either LDL-C and/or apolipoproteins as predictors of coronary/cardiovascular risk. Among them, Apolipoprotein-related Mortality Risk Study (AMORIS, N=98,722 men and N=76,831), Second Northwick Park Heart Study (NPHSII, N=2,505 men), and Women’s Health Study (WHS, N=15,632 women) estimated the association of both predictors (LDL-C and the apolipoproteins B and A1) with CVD, and the three of them showed that the odds ratio (OR) of the Apo B / Apo A1 ratio is noticeably higher than the OR of LDL-C (Walldius et al., 2001; Talmud et al., 2002; Ridker et al., 2005; Chan and Watts, 2006).
On the other hand, HDL enhances reverse cholesterol transport and it is an immunomodulator. According to different studies, HDL reduces LDL oxidation (Norata et al., 2006), inhibits oxidized LDL-induced MCP-1 (monocyte chemoattractant protein 1) production and monocyte
18
transmigration in a co-culture of human aortic endothelial cells and human aortic smooth muscle cells (Van Lenten et al. 1995; Navab et al., 1991), blunts inflammatory response of endothelial cells to tumour necrosis factor-1 (TNF-α) and interleukin (IL)-1 stimuli (Ashby et al., 1998), and exerts anti-thrombotic and anti-apoptotic effects (Vergès, 2015; Femlak et al., 2017).
HDL is composed of proteins that become affected by oxidative stress during an inflammatory response, including Apo A1. Modification of the protein content can turn HDL a proinflammatory particle, a scenario in which HDL becomes “dysfunctional”. Epidemiological research has shown that HDL levels are inversely correlated with the risk of CVD. However, there are individuals who have suffered a clinical event and present normal or high levels of HDL. Low levels of HDL cholesterol are also associated with increased risk for type 2 diabetes. The hypothesis of “dysfunctional” HDL has been studied in T1D. Overall, T1D patients with lowered levels of HDL-C have a higher cardiovascular risk, but T1D patients with high levels of HDL-HDL-C may not have a lower cardiovascular risk (Orchard, 1990). Thus, the mechanisms of such relationship are yet to be understood. To date, though, it has been suggested that different HDL subfractions relate to coronary artery disease (CAD) incidence in a different manner (reviewed from Femlak et al., 2017).
1. BMI and WHR
Along with the lipid profile, some anthropometric measures are also taken into account as a function of health in patients. A few well-known parameters are waist circumference (WC), waist-to-hip ratio (WHR), and BMI. There has been controversy in whether BMI or WHR is a better predictor of obesity (Murray, 2006; Qyao and Nyamdorj, 2010). Qyao and Nyamdorj (2010) revised different investigations with the goal of comparing between BMI, WC, and WHR in their relation to the incidence and prevalence of T2D. They concluded that all studies showed that either BMI or WC predicted or was associated with T2D independently and stressed that the nature of the study could condition on results. In other words, prospective studies favoured equally BMI, WC, WHR and the waist-to-stature ratio (though these studies were limited to ethnic groups), while cross-sectional studies evidence pointed to that WC or WHR discriminate better cases with diabetes from those without, as compared with BMI (though these studies provide only possible association). Another investigation aimed to explore both the relative magnitude of association and the discriminative capability of multiple indicators of obesity with CVD mortality risk by conducting a meta-analysis of 9 cohort studies of men and women from the British general population (Czernichow et al., 2014). They measured BMI, WC, and WHR, and, after a mean of 8.1 years of follow-up, 6,641 deaths were recorded from a total of 82,864 individuals. In this research, they estimated the association of CVD risk and CVD mortality with the mentioned variables and reached the conclusion that measures of abdominal adiposity, but not BMI, were related to an increased risk of CVD mortality (Czernichow et al., 2014). In any case, the increasing adiposity is the single most important risk factor for T2D (De Fronzo et al., 2015). Figure 2, extracted from De Fronzo et al. (2015), shows the relationship between the age-adjusted RR of T2D and BMI and reflects that the higher the BMI, the higher the age-adjusted RR of T2D is, being greater in women than men.
19
Figure 2. Association between BMI and T2D
7. Common risk factors in cardiovascular disease and type 2 diabetes
Thus far, I reviewed the role of key players in CVD and T2D without clearly distinguishing between the two diseases, which, indeed, share many traditional and non-traditional risk factors. Traditional CVD risk factors in T2D include dyslipidemia (altered lipid profile), increased blood pressure, being overweight or obese (>25 kg/m2), having abdominal or central obesity (independent of BMI), reduced physical exercise, and cigarette smoking. Non-traditional CVD risk factors comprise insulin resistance and hyperinsulinemia, postprandial hyperglycaemia, glucose variability, microalbuminuria, haematological factors, thrombogenic factors, increased levels of C-reactive protein (CRP), homocysteine and vitamins, erectile dysfunction, and genetics and epigenetics. There are consistent evidences which underscore that control of the traditional risk factors are necessary for reducing CVD risk in T2D patients. Cardiovascular benefits are acquired if the control of such risk factors start early in subjects with short duration of diabetes and low cardiovascular risk. On the contrary, in elderly subjects with a longer time exposure to hyperglycaemia and high cardiovascular risk, there are no cardiovascular improvements but losses. This positive or negative effect could be attributed to the “metabolic memory” hypothesis, whereby the early glycaemic exposure is imprinted in target organs, resulting in long-term protective or deleterious consequences (reviewed from Martín-Timón et al., 2014). The main gain of reducing concentration of plasma glucose in T2D is prevention of long-lasting microvascular complications and, to lesser extent, of macrovascular complications. However, hyperglycaemia is a loose risk factor for CVD (UKPDS, 1998; Holman et al., 2008), and interventions (Gerstein et al., 2008; Patel et al., 2008; Duckworth et al., 2009) focusing on reducing plasma glucose have unsuccessfully reduced CV risk and mortality. The cluster of CV/metabolic factors (obesity, dyslipidemia, hypertension, endothelial dysfunction, procoagulant state) associated with insulin resistance, that is usually moderate to severe in individuals with T2D, is known as insulin resistance (metabolic) syndrome and is a combinatorial major factor responsible for CV risk in T2D (DeFronzo, 2009; DeFronzo, 2010; Abdul-Ghani et al., 2017). In this line, obese non-T2D individuals but with insulin resistance syndrome exhibit an akin raised risk for CVD compared with T2D individuals, which reinforces the notion that hyperglycaemia is not a paramount risk factor for CVD. In accordance with this, antidiabetic drugs (e.g. insulin, sulfonylureas, and dipeptidyl peptidase 4 (DPP-4) inhibitors), which diminish plasma glucose without affecting insulin resistance, do not lessen CVD risk and mortality in T2D (Abdul-Ghani et al., 2017).
20
2. Prediabetes is Key for Understanding Cardiovascular Complications in Type 2 Diabetes
Prediabetes is characterized by one of the following (DeFronzo et al., 2015):
➢ Impaired fasting glucose (IFG): muscle insulin resistance + impaired late insulin secretion. ➢ Impaired glucose tolerance (IGT): hepatic insulin resistance + impaired early insulin
secretion.
➢ ↑Glycated haemoglobin (HbA1c).
Both IFG and IGT use hyperinsulinemia as a coping mechanism to reduce elevated fasting or postprandial glucose (Laakso, 2010). Some studies, though, have provided evidence that individuals with IGT have a more marked degree of insulin resistance, whereas individuals with IFG are characterized by a more marked β-cell defect (Weyer et al., 1999; Festa et al., 2004). In addition to that, it has been shown that insulin resistance per se is correlated with atherosclerosis, even in normoglycemic individuals (Laakso et al., 1991). Furthermore, several investigations have demonstrated that high insulin level is associated with risk of cardiovascular heart disease (CHD) (Laakso, 1996). Prediabetics have a cluster of CVD risk factors that may differ of the cluster of CVD risk factors in diabetics. Nevertheless, diabetics are at least as insulin resistant as prediabetics (Laakso, 1996). Therefore, insulin-resistance RR in both prediabetics and diabetics are likely to explain an important part of the atherosclerotic process (figure 3, extracted from Laakso, 2010).
Figure 3. Relative risk of CVD in normoglycemia, prediabetes and diabetes
3. Sex in Cardiovascular Complications in Type 2 Diabetes
Intriguingly, RR for CHD is higher in T2D female patients than in T2D male patients. The reason for this sex difference is not known, but it could be explained by a heavier risk-factor burden and a greater effect of blood pressure and atherogenic dyslipidemia on the risk of CVD in T2D women than in T2D men (Juutilainen et al., 2004).
8. Thrombosis and fibrinolysis
Insulin resistance and diabetes are associated with an increased prothrombotic risk (coagulation factors VII, XII, and fibrinogen) and with suppressed fibrinolysis, due to elevated levels of the fibrinolytic inhibitor PAI-1 and of the thrombin-activatable fibrinolysis inhibitor (TAFI) (Grant, 2007; Hori et al., 2002).
21
3. GLYCANS
9. Glycans definition
The terms glycan and polysaccharide are defined by IUPAC as synonyms meaning "compounds consisting of a large number of monosaccharides linked glycosidically". In practice, glycan, carbohydrate, saccharide and sugar are generic terms used interchangeably (IUPAC Gold Book – Glycans). Figure 4 shows some examples of glycans.
Figure 4. Examples of glycans (IUPAC Gold Book)
Glycans are not only defined by monosaccharide units, but also by the bond position, its anomeric configuration (alpha or beta), the number of branches and the position of branching (Lauc and Zoldoš, 2010). Along with nucleic acids, proteins and lipids, glycans are essential macromolecular and structural components or, in other words, building blocks, of all cells, and they can be found attached to proteins and lipids or as independent macromolecules (Marth and Grewal, 2008).
10. Glycans biosynthesis
In the case of protein glycosylation, glycans synthesis can be split into N-linked, O-linked, and the GlcNAc modification (revised from Zhou et al., 2018):
▪ N-glycosylation synthesis: N-linked glycosylation starts with the transfer of a large precursor oligosaccharide from a membrane-embedded dolichol phosphate lipid to the asparagine of a nascent protein while being synthesized in the rough endoplasmic reticulum (ER). The glycan assists in protein folding by mediating interactions with ER chaperones like calnexin and calreticulin, thereby functioning as a quality control checkpoint. Upon proper folding, the glycans are trimmed to “high mannose” structures prior to moving to the Golgi apparatus, where they undergo further trimming and then rebuilding through the combined action of various glycosyltransferases. This results in both hybrid and complex- type N-glycans, which are common at the plasma membrane and on secreted glycoproteins, including immunoglobulin (Ig) G and essentially every surface protein on a cell (reviewed from Zhou et al., 2018; figure 5, extracted from New England Biolabs).
22
Figure 5. Protein N-glycosylation biosynthesis
▪ O-glycosylation synthesis: O-linked glycosylation is a wide category comprising various modifications named for the glycosidic linkage of oxygen on threonine or serine residues, and includes O-GalNAc, O-fucose, and O-mannose glycans. Unlike the co-translational N-glycosylation, all of these are built progressively from a single initiating sugar post-translationally cell (reviewed from Zhou et al., 2018).
▪ O-GlcNAcylation (O-GlcNAc glycosylation): O-GlcNAc glycosylation corresponds to the addition of N-acetylglucosamine on serine and threonine residues of cytosolic and nuclear proteins. O-GlcNAcylation is a dynamic post-translational modification, analogous to phosphorylation, that regulates the stability, the activity or the subcellular localisation of target proteins (e.g. RNA polymerase II, histones, histone deacetylase complexes and members of the Polycomb and Trithorax group). This reversible modification depends on the availability of glucose – 2-5% of glucose enters the hexosamine biosynthetic pathway (HBP) – and therefore constitutes a powerful mechanism by which cellular activities are regulated according to the nutritional environment of the cell (as above-mentioned GlcNAc is considered to be the metabolic sensor of the cell). O-GlcNAcylation has been implicated in important human pathologies including Alzheimer disease and type-2 diabetes. Only two enzymes, OGT and O-GlcNAcase, control the O-GlcNAc level on proteins (reviewed from Issad et al., 2010; figure 6).
23
Figure 6. O-GlcNAcylation in cell metabolism
11. Molecular diversity of glycans
Glycosylation is not only the most abundant post-translational modification, but also by far the most structurally diverse. Conservative estimates state that >50% of proteins are glycoproteins, without considering the countless number of nuclear and cytoplasmic proteins modified by O-GlcNAc. It is estimated that between 2-5 glycans are attached to an average glycoprotein, the 10% of which are O-linked, and the other 90% are N-linked or both (Apweiler et al., 1999). In this line, there are at least 13 different monosaccharides and 8 different amino acids involved in glycoprotein linkages, with a total of at least 41 different chemical bonds known to be linking the glycan to the protein (Spiro, 2002). Importantly, each one of these glycan:protein linkages is unique in both structure and function. However, if the structural diversity of different branches composed by different monosaccharides is added to these single-linkages, the molecular diversity increases exponentially. Just the “sialome” rivals or exceeds many other post-translational modifications in abundance and structural/functional diversity. Besides, chemical modifications, such as phosphorylation, sulfation and acetylation, increase the glycan structural/functional diversity even more. Therefore, categorizing glycosylation as a single type of post-translational modification may be misleading and useless (Cohen and Varki, 2010).
12. Functions of glycans
Very conservative estimates indicate that there are over a million different glycan structures in a mammalian cell's glycome, and consequently glycoproteins are involved in a myriad of functions. Varki (2017) revised the multiple functions of glycans, and classified them into four groups (see
figure extracted from Varki, 2017):
i. Structural and modulatory roles: as example, the addition of O-GlcNAc residues to
histones surrounding chromosomal DNA is key in the histone code that regulates gene expression.
ii. Extrinsic (interspecies) recognition of glycans: as example, glycans, such as
polysaccharide A, derived from the mammalian gut microbiome, helps to modulate the host immune system to a more tolerant state (via T-reg engagement).
24
iii. Intrinsic (intraspecies) recognition of glycans: as example, the conservative
glucosylation/deglucosylation cycle of protein folding in the ER.
iv. Molecular mimicry of host glycans: as example, molecular evolution of microorganisms
has allowed them the acquisition of host sialoglycans or the direct transfer of host sialic acids by trans-sialialidases, thereby acting as self-associated molecular patterns (SAMPs) recognized by Siglecs – receptors of sialoglycans –, limiting complement activation, or masking antibody recognition.
Figure 7. Biological roles of glycans proposed by Varki (2017)
13. Genetics of protein glycosylation
The synthesis of glycans, in contrast to genes, is a template-independent process – glycans are encoded in a dynamic network of hundreds of genes that code for enzymes involved in glycan synthesis, e.g. glycosyltransferases (>250), glycosidases, enzymes for sugar nucleotide biosynthesis, etc. In addition to over 600 such proteins, there are various transcription factors, Golgi organizers, proton pumps, etc. that affect their expression and activity (reviewed from Lauc and Zoldoš, 2010).
In genetics, three groups of mutations/SNPs in genes coding for enzymes involved in glycosylation have been described at large:
a. Embryologically lethal: those affecting enzymes involved in the pathway of glycans biosynthesis, and that consequently they impair the proper functioning of thousands of proteins (reviewed from Lauc and Zoldoš, 2010).
25
b. Rare mutations: those comprising a group of rare genetic disorders (the so-called congenital disorders of glycosylation or CDC) caused by mutations in the core N-glycosylation pathway – these mutations result in residual enzymatic activity, but are nonetheless associated with significant mortality and broad motoric, immunologic, digestive and neurologic symptoms (reviewed from Lauc and Zoldoš, 2010).
c. Glycophenotype: those variations in genes involved in modifications of glycan antennas, which are common in the population and apparently cause a large part of individual phenotypic variations that exist in humans and in other higher organisms. Indeed, the majority of variability originates from SNPs that individually do not have visible glycophenotypes, but if present in specific combinations within the same individual can have significant phenotypic effects (reviewed from Lauc and Zoldoš, 2010).
Regardless of mutations/SNPs, it has been reported that a large part of the observed variability is under genetic control (Lauc and Zoldoš, 2010).
14. Environmental factors affecting protein glycosylation
The complex dynamic network of hundreds of proteins taking part in glycans biosynthesis makes the process of protein glycosylation intrinsically sensitive to all changes occurring within a cell, so that the glycan structures produced at any instant of time reflect the significant past events in the cell. Indeed, glycosylation sites on the same protein can contain different glycan structures that reflect the cell type, developmental stage and metabolic state of the cell in which they are synthesized.
While general glycan structures appear to be mostly defined by the genetic makeup, some specific glycans are sensitive to environmental factors. Some examples of environmental factors that change the glycomic profile are age, smoking and diet.
26
MATERIALS & METHODS
15. Data description
4. Clinical database
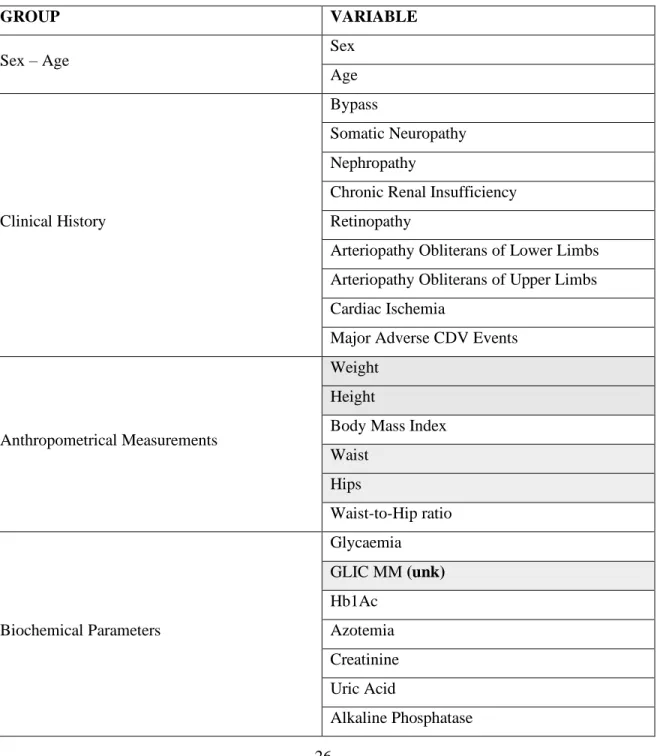
A database consisted of 123 variables (including 10 N-glycans) of N=1185 individuals was provided. The clinical data were classified in groups to facilitate the comprehension (table 1).
Table 1. Database classified variables by biomedical groups
GROUP VARIABLE
Sex – Age Sex
Age
Clinical History
Bypass
Somatic Neuropathy Nephropathy
Chronic Renal Insufficiency Retinopathy
Arteriopathy Obliterans of Lower Limbs Arteriopathy Obliterans of Upper Limbs Cardiac Ischemia
Major Adverse CDV Events
Anthropometrical Measurements
Weight Height
Body Mass Index Waist Hips Waist-to-Hip ratio Biochemical Parameters Glycaemia GLIC MM (unk) Hb1Ac Azotemia Creatinine Uric Acid Alkaline Phosphatase
27 AST ALT Cholesterol HDL Triglycerides Insulin HOMA
Estimated glomerular filtration rate C Reactive Protein
Fibrinogen PAI-1
Thrombin activatable fibrinolysis inhibitor Gamma glutamyl transpeptidase
Total Bilirubin LDL Apolipoprotein A1 Apolipoprotein B Total iron Transferrin Ferritin Total Protein Telomere Length Symmetric Dimethylarginine Asymmetric Dimethylarginine ASAH1 (lysosomal enzyme)
ASAH1 (lysosomal enzyme percentage) Glucoamylase (lysosomal enzyme)
Glucoamylase (lysosomal enzyme percentage)
Cell counts
White Cells Red Cells Hemoglobin Hematocrit
28
Mean Corpuscular Volume Mean Corpuscular Hemoglobin
Mean Corpuscular Hemoglobin Concentration Red blood cell Distribution Volume – SD Red blood cell Distribution Width – CV Platelets
Platelets Distribution Width – SD Mean Platelets Volume
Blood Differential
P.LCR (Platelet Large Cell Ratio) Neutrophils Lymphocytes Basophils Eosinophils Monocytes Absolute Neutrophils Absolute Lymphocytes Absolute Basophils Absolute Eosinophils Absolute Monocytes Medication ACE Inhibitors Anti-inflammatories Bisphosphonates Anti-arrythmics Calcium Antagonists Beta blockers Fibrates Statins Metformin Sulphonylureas Glinides Insulin administration Vasodilators
29 Anti-aggregants Diuretics Gastroprotectors Micronutrients Antibiotics SNC Medication Thyroid Medication Lipid Therapy Glycaemia Therapy Hypertension Therapy Presence Therapy
Metabolic Syndrome (ATPIII diagnosis)* Metabolic Syndrome (IDF diagnosis)*
Survival-like variables
Smoker Smoking Years Number Cigarettes Stop Smoking Year Diabetes
Diabetes Duration Hypertension Medication Hypertension Onset Year Cholesterol Medication
Hypercholesterolemia Onset Year Acute Myocardial Infarction
Acute Myocardial Infarction Onset Year Ictus
Ictus Onset Year
Genetic markers
Haplogroup RFLP markers Pavia
Genetics geographical precedence Municipality
30 Genetics genealogical precedence
Paternal Grandfather Paternal Grandmother Maternal Grandfather Maternal Grandmother
*ATPIII: adult treatment panel III; *IDF: international diabetes foundation; unk: unknown; yellow ochre color: variables used in all analyses; green color: variables used for the global O2PLS; grey color: variables never used.
The variables in gray (a total of 32) were removed – except the “Diabetes” variable –, either because they were redundant with other variables or were out of the scope of this research.
5. N-Glycans
10 quantified total plasma N-glycan abundances measured with DSA-FACE were used for the analysis (table 2).
Table 2. 10 N-glycans obtained with the DSA-FACE (images obtained with the Glycoworkbench software) Short Code
(DSA-FACE Code) Structure GP1 (NGA2F) GP2 (NGA2FB) GP3 (NG1(6)A2F) GP4 (NG1(3)A2F) GP5 (NA2) GP6 (NA2F) GP7 (NA2FB)
31 GP8 (NA3) GP9 (NA3F(b)) GP10 (NA4)
16. Preprocessing: Clinical Database and N-glycans
Summary of the preprocessing – Phenomics data set
The preprocessing was run 3 times for the exploratory data analysis (EDA) visualization plots. On the 1st time 2 impossible values were detected: Height=110cm (BMI=61), Glucoamylase_Lys.Enz=-80.3 (negative value), which were considered as missing values. Plots and summary tables were obtained and a screening was made for extreme outliers (>3/4 times the 0.01/0.99 percentiles), and 13 values were removed. After that, preprocessing was run a second time, in which variables that were skewed were transformed and pairs of variables considered redundant (highly correlated) were filtered (1 out of the pair). The 3rd run contains plots from the whole processed data set.
6. Categorical variables to binary
The variables “Anti-aggregants”, “Vasodilators”, “Anti-arrythmics”, “Anti-inflammatories” and “Statins” from the group “Medication” were all converted to binary, i.e. she takes medication – YES/NO, instead of considering the class of drug.
7. Center log-ratio (clr) transformation on N-glycans and Blood cells %
Compositional data are measures of proportions, percentages, parts per million, etc. which sum up to the unity or 100 constraint. In the case of N-glycans, this means that when they are transformed to percentage, the level of one glycan increases at the expense of the decrease of (another) glycan(s). This might lead to a misinterpretation of the correlation coefficients between the original glycans, commonly referred as the negative bias problem (Houwing-Duistermaat et al., 2017). To deal with compositional glycans, we used the center log-ratio (clr) transformation, mathematically expressed as:
32
clr(x) = (log(x1/g(x)), …, log(xD/g(x)))
where x represents the composition vector, g(x) is the geometric mean of the composition x, and xD is Euclidean distances between the individual N-glycan variables. The clr was carried out with the compositions package from R software. In figure 8 the glycans distribution is shown for non-clr and clr transformed glycans.
Before applying clr transformation, it was noted that 17 rows in the Glycomics data set were completely missing, and thus removed (N=1168). No other missing values were detected in the data set.
Figure 8. Distribution of N-glycans without vs without clr transformation
The same applies to blood cell percentages, thereby the sum of neutrophils %, lymphocytes %, basophils %, eosinophils % and monocytes % equals 100. Accordingly, the clr too was performed in blood cell counts (figure 9). These 5 variables had a total of 6 NA, but it should be noted that the clr deals with missing values when performing the transformation.
The clr on N-glycans and blood cells was conducted on separate dataframes (df), respectively; afterwards, they were rejoined to the “Phenomics” df for the imputation.
33
Figure 9. Distribution of Blood Cells without vs without clr transformation
8. Missing values and imputation
1164/1168 rows contained missing values, which were present in 70/122 columns. Briefly, 96 variables had <1% NA, 11 variables had 1-25% NA, 0 variables had between 25-50% NA, and 16 variables >50% NA.
The 16 variables >50% NA were deleted, so that the final number of clinical variables became 106. All 106 (≤25% NA) were imputed with the mice package.
9. Outliers detection and treatment
After a first process of data cleaning (following NA deletion or imputation), different plots (histograms, Q-Q plots, boxplots) and tables (summary statistics and quantiles) were produced (data not shown). Cohorts are explained in the next section, but so far N=292 controls (Ctrl), N=313 prediabetics (PreDiab) and N=563 diabetics (Diab).
These EDA served to check for data distribution and to detect whether there could be possible influential outliers that could drastically bias/change the fit of estimates and predictions.
In general, values were not extreme, indicating that the best is to include them over other methods, like trimming based on reference values – up to 130 samples would be lost – or winsorizing, i.e. imputing the most external top and bottom outliers to the 5th and the 95th quantiles, which would introduce bias. Based on the EDA, the following extreme outliers were detected:
• Age: 17-Ctrl • Creatinine: 6-Ctrl • HOMA: 47.3-Diab • Triglycerides: 1528-Diab
34
• Estimated glomerular filtration rate (EGFR): 364.8-PreDiab, 7.3-Ctrl • C Reactive Protein: 130.6-PreDiab
• Gamma Glutamyl Transpeptidase: 946-Diab • Total Bilirubin: 7.5-Diab, 9-Ctrl
• Ferritin: 1500-PreDiab • Platelets: 965-Diab
• Alkaline Phosphatase: 300-Ctrl, 410-Diab
These values were removed (except for a technical reason the “EGFR=7.3-Ctrl” (ID and value could not be read by R)), giving to: N=288 Ctrl, N=310 PreDiab and N=557 Diab (final N=1155).
10. Descriptive Statistics
After dealing with missing data and extreme outliers, data were visually check for normally distribution or skewness through histograms, Q-Q plots, boxplots and tables of summary statistics (data not shown). From plots and tables it could be inferred that the following variables are:
• Highly right skewed: Creatinine, AST, HOMA, ALT, Triglycerides, Insulin, C Reactive Protein, Gamma Glutammyl Transpeptidase, Ferritin, Alkaline Phosphatase, Azotemia,
Uric Acid, Telomere Length, Symmetric Dimethylarginine, Asymmetric
Dimmethylarginine, Red blood cell Distribution Width. • Highly left skewed: Mean Corpuscular Volume.
1. Kolmogorov-Smirnov test
For the 17 highly right skewed variables, a Kolmogorov-Smirnov (K-S) normality test was performed to numerically check for normality. “Cholesterol” was used as reference variable, since it follows a fair Gaussian distribution. The null hypothesis that each of the skewed variables follows a normal distribution and, thus, it is not different from the “Cholesterol” distribution was rejected in all skewed variables (p-value < 2.2e-16).
11. Skewed Continuous Variables Transformation
Next, 10 different transformations were tested in each variable – log, square root, raise to the power of coefficients ranging from 0.1 to 0.3 – to decide which transformation suited most to each variable.
35 2. Summary
• No transformation: Mean Corpuscular Volume.
• Log: Creatinine, AST, ALT, Triglycerides, Insulin, Gamma Glutamyl Transpeptidase, Alkaline Phosphatase, Azotemia, Uric Acid, Telomere Length, Red blood cell Distribution Width.
• Square root: Symmetric Dimethylarginine, Asymmetric Dimethylarginine. • Raise to the power 0.125: Ferritin.
• Raise to the power 0.275: C Reactive Protein. • Raise to the power 0.3: HOMA.
12. Redundant Correlated Variables Filtering
A high correlation between two variables means they have similar trends and are likely to bring similar information. This can bring down the performance of some models drastically (e.g. linear and logistic regression models (Sharma P (2018)).
A Pearson correlation matrix between numerical variables was calculated, and for variables crossing a certain threshold, one of them was deleted. Since dropping a variable is highly subjective, choosing between one of them was done based on domain knowledge, so that, for example, for blood variables, those already surpassing a threshold of ≥ 0.5 or ≤ -0.5 were removed, while for the rest of variables a threshold of ≥ 0.7 or ≤ -0.7 was set, excluding core variables for the study, such as HbA1c/HOMA. Ten variables (7 blood-related and 3 lysosomal enzymes) were dropped:
• Basophils
• Red blood cell Distribution Volume – SD • Mean Corpuscular Hemoglobin Concentration • Hematocrit
• Platelet Large Cell Ratio
• Platelets Distribution Width – SD • Mean Corpuscular Hemoglobin • Glucoamylase
• ASAH1 % • ASAH1
36
A second Pearson correlation matrix was computed after filtering for those variables, to visually assess for correlations among the remaining variables (not shown).
17. Cohorts: controls, prediabetics, diabetics
As mentioned before, N=288 Ctrl, N=310 PreDiab and N=557 Diab (final N=1155).
These cohorts were established by the diabetologists of Ancona (where the database was produced), who determined if individuals were diabetics or not. However, since there is a time gap between the diagnosis of T2DM – ranging from 70’s up to the early 2000, being the 2 most recent diagnosed individuals in 2005, plus incomplete cases – and the data collection – year 2009 –, it was considered appropriate to redefine the groups based on the 2 first diagnostic reference values from table (extracted from De Fronzo et al. 2015), in agreement with the American Diabetes Association (ADA), because they could be more informative than the previous ones. For that, I did not change the “diabetes” status established by the diabetologists from Ancona (to date, diabetes cannot be cured, just controlled), and I just took the individuals with absence of diabetes (according to the diabetologists) and classified them into controls and prediabetics following the ADA criteria (subsection Diagnosis).
37
CHAPTER 1: Characterization of the T2D-Dysmetabolic-Aging
Phenotype
4. INTRODUCTION
Aging is a time-dependent multifactorial process that results in a global deterioration of the physiological functions and elevated risk of pathologies, including CVD, neurodegenerative diseases, cancer and diabetes (López-Otín et al., 2013). Over recent years, the new approach termed “Geroscience” has focused the attention on a limited number of highly interconnected “pillars”, shared between aging and age-related diseases (López-Otín, 2013; Kennedy et al., 2014). Among them, inflammation plays a key role, though being indispensable for survival and paradoxically non-detrimental in childhood and adulthood (Furman et al., 2019). A particular feature of the old immunophenotype is the chronic, low-grade, sterile inflammation status, termed inflamm-aging, that can be largely explained by a disequilibrium between inflammatory and anti-inflammatory networks. Within this context, immune cells are major players in eliciting inflammatory responses and constantly adapting their functions at facing internal and external stimuli, but not unique. Different organs, tissues and cells, such as adipose tissue (AT), liver, muscle, fibroblasts or endothelial cells, are also capable of inducing a proinflammatory status, thus contributing to systemic inflammation and to subsequent chronic diseases (Salvioli, 2013). Of note, adipocytes and hepatocytes are pivotal metabolic cells that, under chronic overnutrition, promote inflammatory local pathways, which, in turn, drive the recruitment of proinflammatory macrophages. In the long run, this may result in obesity, CVD and hepatic steatosis, which constitute intermediary phenotypes that combined raise risk for metabolic syndrome (MetS) (Grundy et al., 2004). Besides, chronic obesity-associated inflammation greatly contributes to insulin resistance and posterior β-cell inflammation and dysfunction, increasing risk for T2DM. Within this framework, a common denominator for these maladies is the low-grade, chronic inflammation state induced by metabolic cells in response to excess nutrients and energy, termed metaflammation (Gregor et al., 2011). Metaflammation and inflamm-aging share molecular mechanisms of inflammation that characterize aging and age-related diseases. For example, inflammatory cytokines can impair the insulin signalling pathway by inactivating the insulin receptor substrate 1 (ISR1) via phosphorylation, thus leading to the inactivation of the phosphatidylinositol-3-kinase (PI3K)-Akt path. From a clinical point of view, some T2DM patients are non-obese and some obese patients are non-diabetic, but anti-inflammatory drugs do not prevent diabetes and CVD events progression, which points towards inflammation as link between obesity and diabetes development (Franceschi et al., 2000; Franceschi et al., 2017; Prattichizzo et al., 2018). Though, immunometabolic disorders often come up in clusters and nurture aging and age-related diseases (Hotamisligil, 2006; 2017). In point of fact, the World Health Organization estimates that 39% adults worldwide are overweight and 13% are also obese, and that between 2015 and 2050 the world's population over 60 years will increase from 12% to 22%. These worrisome numbers challenge biomedical research at identifying new biomarkers for the diagnosis of age-related diseases. A field that has a lengthy trajectory, but it is only recently being recognized by immunologists, is glycomics (Zhou et al., 2018), upon which this chapter will focus on for reviewing shared links between inflamm-aging and metaflammation.
Glycomics refers to the studies that strive for defining and quantifying the glycome of a cell, tissue or organism (Hart and Copeland, 2010). The glycome is the entire set of glycans, or carbohydrates, and glycoconjugates produced by a cell or organism under specific conditions (Bertozzi and