In Vivo CT Direct Volume Rendering: A
Three-Dimensional Anatomical Description of the Heart
Giuseppina Cutroneo
1B, Daniele Bruschetta
1B, Fabio Trimarchi
1D, Alberto Cacciola
1E,
Maria Cinquegrani
1E, Antonio Duca
1F, Giuseppina Rizzo
1F, Emanuela Alati
2B,
Michele Gaeta
1BD, Demetrio Milardi
1,3A
1
Department of Biomedical Sciences and Morphological and Functional Images, University of Messina, Messina, Italy
2Division of Cardiac Surgery, Ospedale Vita e Salute, San Raffaele, Milano, Italy
3
IRCCS Centro Neurolesi “Bonino Pulejo”, Messina, Italy
Author’s address: Demetrio Milardi, Department of Biomedical Sciences and Morphological and Functional Images,
University of Messina, Messina, Italy, e-mail: [email protected]
Summary
Background:
Since cardiac anatomy continues to play an important role in the practice of medicine and in the development of medical devices, the study of the heart in three dimensions is particularly useful to understand its real structure, function and proper location in the body.Material/Methods:
This study demonstrates a fine use of direct volume rendering, processing the data set images obtained by Computed Tomography (CT) of the heart of 5 subjects with age range between 18 and 42 years (2 male, 3 female), with no history of any overt cardiac disease. The cardiac structure in CT images was first extracted from the thorax by marking manually the regions of interest on the computer, and then it was stacked to create new volumetric data.Results:
The use of a specific algorithm allowed us to observe with a good perception of depth the heart and the skeleton of the thorax at the same time. Besides, in all examined subjects, it was possible to depict its structure and its position within the body and to study the integrity of papillary muscles, the fibrous tissue of cardiac valve and chordae tendineae and the course of coronary arteries.Conclusions:
Our results demonstrated that one of the greatest advantages of algorithmic modifications of direct volume rendering parameters is that this method provides much necessary information in a single radiologic study. It implies a better accuracy in the study of the heart, being complementary to other diagnostic methods and facilitating the therapeutic plans.MeSH
Keywords: Anatomy • Heart • Imaging, Three-Dimensional
PDF fi le: http://www.polradiol.com/abstract/index/idArt/895476
Received: 2015.07.27 Accepted: 2015.08.17 Published: 2016.01.21
Background
The study of anatomy has undergone an important revo-lution, since it was demonstrated that the description of structures and organs within the body, relative to the so-called anatomical position, is not always followed [1]. The description of organs is conventionally illustrated on the basis of the subject standing upright, and facing the observer [2].
As a consequence of that, all the adjectives used in the description of organs should be related to the three
standard orthogonal planes of the body: frontal (coronal), horizontal (transverse), and sagittal. However, the three primary planes of the heart (short axis [transverse], four-chamber [frontal], and long-axis [sagittal]) do not match the previous anatomical planes of the body.
Computed Tomography (CT) and 3D-echocardiography (3DE) can show the real and precise position of the heart within the body and the surrounding thoracic structures. In particular, 3DE permits multiple internal perspec-tives [3]; CT allows an accurate anatomical depiction, spe-cifically in relation to adjacent anatomical structures [4] Authors’ Contribution: A Study Design B Data Collection C Statistical Analysis D Data Interpretation E Manuscript Preparation F Literature Search G Funds Collection
DOI: 10.12659/PJR.895476
O R I G I N A L A R T I C L Eand it represents the imaging modality of choice for the assessment of vascular rings or slings [5]. Finally, the study of the cardiovascular system and the segmentation of the heart cavities from CT images facilitate accurate morpho-logical visualization, as well as atrial and ventricular shape representations [6].
However, CT becomes an awkward method for the study of the heart and its correlated anatomical structures, because the data obtained by this analysis must be examined by a stock of hundreds of images. Furthermore, the CT data are elaborated by an inside standard software which does not enable to evaluate the exact cardiac morphology and to vis-ualize the heart on a three-dimensional field. This problem has brought to the finding of new important post-process-ing methodologies that allow to obtain essential interpreta-tions on CT data, to value the real 3D morphology of the heart [7] and to better highlight anatomical details [8,9]. Many 3D rendering approaches exist in order to obtain a three-dimensional shape of organs, such as the Direct Volume Rendering (DVR), a direct technique for visualizing primitive volumes without any intermediate conversion of the volume data to surface presentation.
The efficacy of DVR in comparison to Shaded Surface Display (SSD) for depiction of many anatomical districts [10] has been previously demonstrated. Indeed, DVR allows to display three-dimensional data sets of CT or Magnetic Resonance Imaging (MRI) [11] avoiding the limitations of previous techniques, as well as surface rendering, that needed semi-automatic intermediate conversion of the vol-ume data [12,13] and reducing margin of error (p<0.001) in comparison to SSD and Maximum Intensity Projection (MIP) [14,15].
In this article, we used high-quality 3D graphic software that is able to give both voxel opacity and color properties relative to the examined tissue, proving to be an extremely useful tool in highlighting anatomical morphologies and correlated diseases.
DVR has been verified and tested showing with high accu-racy the vascular structures with large and small diameters [12,16,17], and offering more accurate means for clinical practice and for diagnostic fields [18].
Even if those Authors contributed to provide efficient information on the entire cardiac morphology, showing also an anatomical overview of the heart referred to pathology, they did not show accurately the inside morphology of all structures [16].
Previously, we used this technique in structures, not in movement, just presenting complicated organization; in particular, we analyzed the knee joint [8], the ankle joint [19] and the cerebral ventricular system [9], highlight-ing the 3D aspects of these anatomical districts, avoidhighlight-ing the use of cadavers, high costs of multiple analyses and ethical problems [8].
The aim of this study is to test new appropriate param-eters of 3D DVR for cardiovascular structures in order to
meliorate the visualization methods, showing a successful method of study of cardiac morphology, internal structures of the heart and vasculature through data sets obtained by means of non-invasive techniques, by working on the development of efficient and accurate algorithms for dis-playing medical data.
Material and Methods
ParticipantsFive subjects with age range between 18 and 42 years (2 male, 3 female), with no history of any overt cardiac dis-ease, were studied. All subjects, who were examined for other reasons, gave informed consent and all procedures followed were in accordance with the Declaration of Helsinki of 1975.
Data acquisition
AngioCT. AngioCT examinations were performed with a Somatom Definition scanner (Siemens) using the following parameters: Kv 120, mAs 400, slice thickness of 0.6 mm.. A bolus of 100 mL of nonionic contrast medium (Iomeron, 400 mg iodine/mL; Bracco, Milan, Italy) was injected intra-venously at a flow rate of 5 mL/s.
3D DVR reconstruction
3D reconstruction was performed by using a freeware graphic software package (Osirix 3.3.1, 64-bit). The cardi-ac structure in the CT images was first extrcardi-acted from the thorax by marking manually the regions of interest on the computer, and then it was stacked to create new volumet-ric data. Myocardium, vascular walls, chambers and vascu-lar lumens were classified using interval thresholds based on Hounsfield Units (HU).
The transparency was set in relationship to the myocar-dium and vascular wall (100%), or to the chambers and vascular lumens (0%). This allowed 3D reconstructed view-ing of our images from a true frontal perspective, while the ventral portion of the heart was removed and recon-structed in the software-generated virtual environment by increasing or decreasing the perspective. Different opacity settings in the same phantom were made. The soft tissues were considered opaque or transparent in relationship to the region of interest and due to the tissue in exam. The reconstruction was performed with fields of view of 21×21 cm, with the result that the voxel size of the in-plane became 0.41×0.41 mm with a 512×512 matrix. Once the CT scan was acquired, the data were sent to the work-station Apple Mac Pro Eight-Core 2.8GHz Xeon Desktop Computer powered by two 2.8 GHz Quad Core 45-nm Intel Xeon E5462 (Harpertown/Penryn) with ATI Radeon HD 2600 XT 256MB Mac OS X v10.9.5 Mavericks, 12 MB of L2 cache per processor (each pair of cores shares 6 MB), 128-bit SSE4 SIMD engine, 64-bit data paths and registers, energy efficiency optimization, 1600 MHz, 64-bit dual inde-pendent front-side buses, where the images were viewed as consecutive axial section and so performed manually for each axial image by editing with Osirix 3.3.1.
A voxel-intensity histogram was created, and then a trans-fer function in the form of a window level mapped each voxel in the histogram for color and opacity (the voxel intensity histogram is shown in each figure of this paper). Brightness and opacity of the voxels were regulated by increasing or decreasing them with up-regulation of the height of the transfer function. All this determined the transparency or brightness of the incorporated images. Furthermore, the transfer function classified all voxels in the data set; the voxel positioned under the ramp of func-tion was displayed with a color scale to reflect volume averaging of different tissue types.
Decreasing or increasing the window level allowed us to display higher or lower attenuation structures with a final image comprised of pixels of interest. Therefore, working on window width and level, we were able to modulate the final image in order to create the 3D image; the final image, as the algorithm incorporates the entire data set, can be adjusted at the workstation to choose, selectively, which structure to highlight (vessels, chambers, muscles or bones) and to increase conspicuity of selected tissue, maintaining the vascular and visceral 3D relationships.
Results
Manipulating and modifying DVR parameters, it was possi-ble to display several structures of the heart in the desired plane, giving an accurate and realistic description of the heart within the body.
First, in all subjects, we examined the heart in its original position and in frontal projection (Figure 1); we applied a specific algorithm that permitted us to visualize both hard tissues (i.e. ribs) and soft tissues of the heart, at the same time. Cutting the anterior wall of the thorax and then elim-inating the sternum and the costal cartilages allowed us to observe the sternocostal surface of the heart, with the right atrium and ventricle separated by the anterior atrio-ventricular groove (coronary sulcus), occupied by coronary vessels; furthermore, the auricle of the right atrium was visible as well. The left ventricle, separated from the right one by the anterior interventricular artery, was clearly vis-ible. It was possible to see how the heart appeared in left-ward position from bottom to top and the inferior border, corresponding to a convex line, representing the right ven-tricle extending to the cardiac apex. In the superior part, we highlighted the ascending aorta, the pulmonary trunk, partially covered by the arch of the aorta, and the superior vena cava.
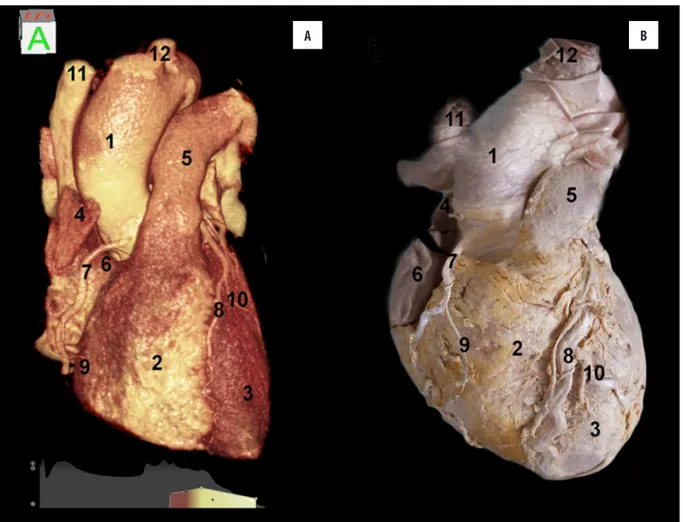
Comparing our 3D DVR image (Figure 2A) with an anatomi-cal specimen image (Figure 2B), it was possible to demon-strate that 3D DVR technique faithfully transfers all infor-mation recognizable in a real view. With eliminating all surrounding structures, by applying an algorithm only for soft tissues, and magnifying the previous image, the mor-phology of the sternocostal surface with areas of the right atrium was better visible, with its auricle, and of the right ventricle, separated by the atrioventricular groove and a little part of the left ventricle (apex), separated from the right ventricle, by the anterior interventricular groove. Furthermore, the right coronary artery was evident: it
arose from the ascending aorta and ran downwards on the atrioventricular groove; the anterior interventricular branch of the left coronary artery, passing in the anterior interventricular groove, and the diagonal branch were also visible. Again, this projection permitted us to visualize the arch of the aorta, the pulmonary trunk and the superior vena cava. In addition, the emergence of the brachiocephal-ic trunk, arising from the arch of the aorta, and the right marginal artery, running on the inferior border of the right ventricle, were visible.
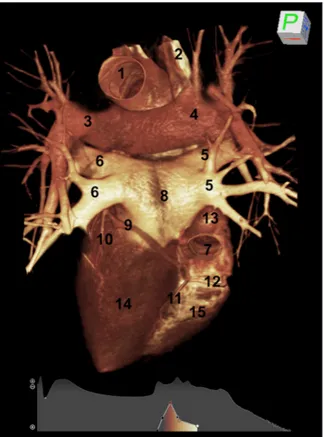
By rotating the heart and setting manually the algorithms for soft and vascular structures, we analyzed the dia-phragmatic surface of the heart (Figure 3). In this way, it was possible to visualize both two ventricular and atrial surfaces, the posterior part of the atrioventricular groove and the posterior interventricular groove. In addition, the branches of the left and right pulmonary arteries, with ini-tial monopodic ramification, two pulmonary veins from the right lung and two from the left lung were observed. We also observed the presence of the inferior vena cava, the coronary sinus, the right coronary artery coming from the sternocostal surface of the heart, the posterior interven-tricular coronary artery, the circumflex and the left mar-ginal arteries.
Then, we applied an algorithm that shows the inside struc-tures of the heart, modulating also the brightness and
Figure 1. 3D Direct Volume Rendering (DVR) of the sternocostal
surface of the heart of a healthy subject, obtained by
cutting the anterior wall of the thorax. (1) aorta; (2) right
ventricle; (3) left ventricle; (4) auricle of right atrium; (5)
pulmonary trunk; (6) right atrium; (7) right coronary artery;
(8) interventricular artery; (9) brachiocephalic trunk; (10)
superior vena cava.
contrast of software. With analyzing the heart on its left face and cutting a part of the cardiac wall (Figure 4A), the pulmonary trunk, passing under the arch of aorta, the mitral valve and the tendinous cords were shown. These parameters allowed us to visualize mainly the thick wall of the left ventricle with the apex. In particular, the trabecu-lae carneae and papillary muscles, which project from the whole inner surface of the ventricle, were perfectly visible. Maintaining the same parameters and rotating the heart in order to observe the right side (Figure 4B), we visualized the wall of the right ventricle and its trabeculae carneae; besides, inside the ventricle, the tricuspid valve leaflet, papillary muscles, chordae tendineae and the moderator band were visible.
By cropping the upper side of the thorax and eliminating the ascending aorta and the aortic arch, we clearly visual-ized the aortic and pulmonary valves. Figure 5 shows the pulmonary valve, the aortic valve apparatus composed of three cup-like leaflets (namely the right coronary, left coro-nary and non-corocoro-nary cusp, according to their relation-ship with the coronary arteries) and the sinus of Valsalva, from which the right coronary artery takes origin. In addi-tion, the sternum and the thoracic wall (anteriorly) and a
portion of the descending aorta (posteriorly) are perfectly evident.
Discussion
In this report we demonstrated an elegant application of 3D volume rendering, showing the physiological three-dimensional morphology of the heart.
As well known, 3D volume rendering takes the entire vol-ume of data, sums the value of each voxel along a line from the viewer’s eye through the data set, and allows to display the resulting composite for each voxel of the display [20]. On this basis, 3D volume rendering of medical images has become, in the recent years, an alternative to observation on the human body, being able to directly create images on living subjects [21]. DVR is a process whereby the intra-cardiac structures are reconstructed by using the comput-er memory so that the dataset can be sectioned electroni-cally in any plane, allowing visualization of any structures within the heart from any viewpoint. Viewing a volume-rendered 3D dataset of the heart is analogous to standing outside a house and being unable to see in without taking some or a part of the walls away. By sectioning or cropping away a part of the dataset it is possible to see inside the
Figure 2. (A) 3D reconstruction of the heart in a frontal view shows the right atrium and ventricle separated by the anterior atrioventricular groove,
the aorta, and the pulmonary trunk, in comparison to an anatomical specimen (B). (1) aorta; (2) right ventricle; (3) left ventricle; (4)
auricle of the right atrium; (5) pulmonary trunk; (6) right atrium; (7) right coronary artery; (8) anterior descending interventricular artery;
(9) right marginal artery; (10) left marginal artery; (11) superior vena cava; (12) brachiocephalic trunk.
heart and view the anatomical orientation and motion of intra-cardiac structures, including the myocardium of the left ventricle[22].
Many 3D rendering approaches exist in order to obtain a three-dimensional shape of organs, such as thresholding and surface rendering techniques which are two of the first post-processing methods used on the heart [23,24]; never-theless, they presented limits in accuracy and detail, pro-ducing false positives (spurious surfaces) or false negatives (erroneous holes in surfaces), particularly in the presence of small or poorly defined features, and hindered soft tis-sue definition [13,25]. The surface reduced primarily the imaged volume to a more compact set of pre-extracted sur-faces, converting the volume data into a list of polygons which represent the anatomical surface of interest; poly-gons representing the outside surface can be calculated using a variant of a “marching cubes” algorithm [26]. In the application of volume rendering to these polygons there is a lack of information that would be necessary for a correct diagnosis and nearly real anatomical morphological recon-struction: all this has brought an advent of specialized volume rendering hardware [27]. Moreover, this technique makes it difficult to isolate a particular type of tissue based
on the intensity values only. Besides, since several organs may occlude the objects of interest, these techniques are insufficient and need to be improved by inclusion of global model information.
Numerous studies were carried out on the heart by volume rendering in order to obtain global model information. In particular, gradient-shading surface rendering was used to evaluate 3D reconstruction by CT [13]; again, a segmental reconstruction algorithm over a range of heart rates was used to value the accuracy of cardiac function[28].
Although these studies meliorate 3D visualization of car-diac morphology, the obtained images show an unclear and fictitious shape of the organ. Moreover, while many studies have investigated the morphology and pathology of the heart [28–30], insufficient data are available on its real three-dimensional structure in living human subjects. Nakaura et al. [29], developed a method of fused images of coronary CT angiography and myocardial perfusion, which allows to evaluate exclusively the surface of the heart. Therefore, DVR represents a valid approach to three-dimensional imaging in overcoming many of the drawbacks and limitations of currently available surface-rendering systems [26], and directly displaying a sampled 3D sca-lar field without first fitting geometric primitives to the samples.
Three-dimensional DVR is far more than just a solution in search of the real organ morphology and in diagnostic problems. This method generates clinically accurate and immediately available images from the full CT data set, allowing the clinicians to address specific questions about patient care; moreover, exploring and studying the differ-ent aspects of the data set [31], it has a potdiffer-ential to simplify the standard radiological study.
With the advent of manipulation of data sets obtained by CT, we are able to modify parameters so that the heart can be displayed in the desired plane. After obtaining a CT data set, the original data were converted and interpolated, and 3D regions of interest were cropped for further visualiza-tion on a normal computer screen, with the possibility of zooming in and out, translating and rotating the image [8,19].
In particular, in this investigation, we modified the param-eters of graphic software and obtained fine details of images that are not possible to achieve by conventional 3D reconstruction software. In this way, DVR allows to emphasize the attitudinal approach to anatomy of the heart in relationship to the morphological field applied to clinical practice and diagnostic aspects.
The method applied in this report is an opacity and gra-dient-based algorithm technique, offering a possibility to create arbitrary viewpoints: the object under examination can be rotated and viewed from any angle, or held closer or farther away for our viewpoint. With this method, tissue types of less interest can be rendered as completely trans-parent on the final image or cut away in arbitrary planes, in order to visualize the structures inside and outside. We
Figure 3. CT rendering of the diaphragmatic surface of the heart
of a healthy subject, obtained by manually setting the
parameters for soft and vascular structures. (1) aorta; (2)
superior vena cava; left ventricle; (3) left pulmonary artery;
(4) right pulmonary artery; (5) right pulmonary veins; (6)
left pulmonary veins; (7) inferior vena cava; (8) left atrium;
(9) circumflex artery; (10) left posterior ventricular artery;
(11) posterior descending interventricular artery; (12) right
coronary artery; (13) right atrium; (14) left ventricle; (15)
right ventricle.
performed specific algorithms that incorporate the entire data set into rendering and that can be modified by the user
at the workstation in order to selectively visualize vascular, muscular, fibrous or skeletal structures. With this technique it was possible to convey depth to the analyzed structures and to improve interpretation of vascular relationships, something which is very important to improve the imaging quality in diagnostic imaging and pre-surgical planning. The selection of a better algorithm for the vasculature and choosing an ideal color for these structures allowed us to create a good perception of depth, projecting the light source from a specific orientation and shading the image; in this way, the exact location and pathway of the coro-nary arteries and of the main vessels of the heart were highlighted, allowing us to study and to evaluate their rela-tionships with the surrounding structures. Moreover, the aorta and other vessels were shown without the presence of adjacent organs, esophagus or trachea, providing a better visualization of these structures.
Besides, the setting of other algorithms, by additional parameters of window width and level, showed the real position of the heart with its axis, ratios with surrounding structures and orientation within the thorax.
Our results demonstrated that one of the greatest advan-tages of algorithmic modifications of 3D volume rendering is that it provides all the necessary information in a single radiological study in cases that previously required two or more studies, avoiding some invasive diagnostic methods, such as coronarography. In fact, even if the conventional coronary angiography is still considered the gold standard for evaluation of coronary arteries [32], its invasive nature and complications validate the use of three-dimensional imaging [16] that can also be applied to cardiac CT and car-diac MR with a better visualization of coronary arteries and their pathological anomalies.
Figure 4. Left (A) and right (B) sagittal section of a healthy heart by using CT direct volume rendering. (A) (1) thorax; (2) left ventricle; (3)
pulmonary trunk; (4) arch of aorta; (5) descending aorta; (6) left atrium; (7) pulmonary veins; (8) papillary muscles; (9) cordae tendineae;
(10) mitral valve; (11) trabeculae carneae. (B) (1) thorax; (2) right ventricle; (3) pulmonary trunk; (4) distal portion of the arch of the
aorta; (5) descending aorta; (6) moderator band; (7) pulmonary veins; (8) papillary muscles; (9) cordae tendineae; (10) tricuspid valve;
(11) trabeculae carneae.
A
B
Figure 5. By cropping the superior portion of the thorax we visualized
from top to bottom the aortic and pulmonary valves. (1)
right coronary cusp; (2) non-coronary cusp; (3) left coronary
cusp; (4) Valsalva sinus; (5) pulmonary valve; (6) right
coronary artery; (7) descending aorta; (8) sternum.
Furthermore, this study validates the accuracy of 3D vol-ume rendering in comparison to other imaging techniques like MIP or SSD. To generate images with MIP, the com-puter analyzes the data set as a volume, by projecting rays through the same data set [33]. Along each ray the voxel with the highest intensity is selected; then, the vox-els are displayed as a gray scale, which however is una-ble to discriminate tissue of different composition [34,35]. Nevertheless, the clinical utility of MIP has been evaluated extensively, and this technique has proved to be particular-ly useful in its original application [27], but it has a number of related artifacts and shortcomings that must be taken into account in the interpretation of rendered images [31]. In this way, MIP images are typically not displayed with depth cues, which can make the assessment of 3D relation-ships difficult.
As concerns the SSD method, even if it shows flexibility in image rendering, the fidelity of the resulting images to anatomy depends on the value range selected, being each voxel intensity within the data set determined by the user’s specified range of attenuation values (e. g. hard tissue attenuation) [31].
The greatest part of reports on cardiac data set utilized the conventional DVR, obtaining images which are used prin-cipally on clinical fields [13]; although these images allow to identify a more accurate morphology, in comparison to MRI and CT images, in the final images the entire macro-scopic structure and the inside of the cardiac wall are often neglected.
To obviate these limitations, our laboratory has recently used a freeware version of Osiris 3.3.1 software, in order to elaborate the images obtained by CT analysis. This imple-mentation allows for optimizing the three-dimensional images by using more accurate parameters applied to the full volume data set. In fact, working on algorithms that define how a data set will be modified for display, we can influence the opacity and brightness permitting to selec-tively reveal structures that otherwise would be obscured; finally, the color is modified and selectively combined in order to better highlight the discrimination between differ-ent tissues having many advantages over MIP or SSD.
Conclusions
Our results, which improve the conventional three-dimen-sional images, reveal a new avenue of research studies and clinical fields, mostly in anatomy. With this report we reported on useful parameters which allow for specific vis-ualization of the cardiac surface and of the internal struc-ture of the heart, i.e. papillary muscle, valves, and adjacent structures of the vessels.
In the future, a combined approach of the superior tem-poral resolution of DVR with other radiological techniques may lead to an imaging data set with unsurpassable ana-tomical, physiological and pathological information, offer-ing unique advantages for the formulation of the diagnosis. Conflict of interest
The authors state neither conflict of interests nor financial support.
1. Anderson RH, Razavi R, Taylor AM: Cardiac anatomy revisited. J Anat, 2004; 205: 159–77
2. Anderson RH, Loukas M: The importance of attitudinally appropriate description of cardiac anatomy. Clin Anat, 2009; 22: 47–51
3. Hung J, Lang R, Flachskampf F et al: 3D echocardiography: A review of the current status and future directions. J Am Soc Echocardiogr, 2007; 20: 213–33
4. Goitein O, Salem Y, Jacobson J et al: The role of cardiac computed tomography in infants with congenital heart disease. Isr Med Assoc J, 2014; 16: 147–52
5. Hartman RJ: Non invasive cardiovascular imaging. N C Med J, 2014; 75: 146–48
6. Szlávy L: Selective coronarography. Rontgenblatter, 1976; 29: 42–48 7. Heath DG, Soyer PA, Kuszyk BS et al: Three dimensional spiral CT
during arterial portography: comparison at 3D rendering techniques. Radiographics, 1995; 15: 1001–11
8. Anastasi G, Bramanti P, Di Bella P et al: Volume rendering based on magnetic resonance imaging: advances in understanding the three-dimensional anatomy of the human knee. J Anat, 2007; 211: 399–406 9. Trimarchi F, Bramanti P, Marino S et al: MRI 3D lateral cerebral
ventricles in living humans: morphological and morphometrical age-gender-related preliminary study. Anat Sci Int, 2013; 88: 61–69 10. Drebin RA, Magid D, Robertson DD, Fishman EK: Fidelity of
three-dimensional CT imaging for detecting fracture gaps. J Comput Assist Tomogr, 1989; 13: 487–89
11. Hesser J, Männer R, Braus DF et al: Real-time direct volumetric rendering in functional magnetic resonance imaging. MAGMA, 1997; 5: 87–91
12. Hong H, Grosskopf S, Kim MH: Ventricular shape visualization using selective volume rendering of cardiac datasets. Comput Biol Med, 2001; 31: 481–98
References:
13. Chen SJ, Lin MT, Liu KL et al: Usefulness of 3D reconstructed computed tomography imaging for double outlet right ventricle. J Formos Med Assoc, 2008; 107: 371–80
14. Addis KA, Hopper KD, Iyriboz TA et al: CT angiography: in vitro comparison of five reconstruction methods. Am J Roentgenol, 2001; 177: 1771–76
15. Baskaran V, Pereles FS, Nemcek AA Jr et al: Gadolinium-enhanced 3D MR angiography of renal artery stenosis: a pilot comparison of maximum intensity projection, multiplanar reformatting, and 3D volume-rendering postprocessing algorithms. Acad Radiol, 2002; 9: 50–59
16. Sirineni GK, Kalra MK, Pottala KM et al: Visualization techniques in computed tomographic coronary angiography. Curr Probl Diagn Radiol, 2006; 35: 245–57
17. Van Ooijen PM, Ho KY, Dorgelo J, Oudkerk M: Coronary artery imaging with multidetector CT: visualization issues. Radiographics, 2003; 23: 16
18. Nikolaou K, Flohr T, Knez A et al: Advances in cardiac CT imaging: 64-slice scanner. Int J Cardiovasc Imaging, 2004; 20: 535–40 19. Anastasi G, Cutroneo G, Bruschetta D et al: Three-dimensional
volume rendering of the ankle based on magnetic resonance images enables the generation of images comparable to real anatomy. J Anat, 2009; 215: 592–99
20. Perrone L, Politi M, Foschi R et al: Post-processing of digital images. Rays, 2003; 28: 95–101
21. Trelease RB, Nieder GL, Dørup J, Hansen MS: Going virtual with quick time VR: new methods and standardized tools for interactive dynamic visualization of anatomical structures. Anat Rec, 2000; 261: 64–77
22. Monaghan MJ: Role of real time 3D echocardiography in evaluating the left ventricle. Heart, 2006; 92: 131–36
23. Gibson CJ, Laird EE, Williams ED et al: New technique for showing the relation of tomographic myocardial perfusion images obtained with thallium-201 to the coronary arteries. Br Heart J, 1985; 54: 367–74
24. Beek AM, Bondarenko O, Afsharzada F, Van Rossum AC: Quantification of late gadolinium enhanced CMR in viability assessment in chronic ischemic heart disease: a comparison to functional outcome. J Cardiovasc Magn Reson, 2009; 11: 1–6 25. Fishman EK, Magid D, Ney DR et al: Three-dimensional imaging and
display of musculoskeletal anatomy. J Comput Assist Tomogr, 1988; 12: 465–67
26. Mora B, Maciejewski R, Chen M, Ebert DS: Visualization and computer graphics on isotropically emissive volumetric displays. IEEE Trans Vis Comput Graph, 2008; 15: 221–34
27. Schreiner S, Paschal CB, Galloway RL: Comparison of projection algorithms used for the construction of maximum intensity projection images. J Comput Assist Tomogr, 1996; 20: 56–67 28. Yamamuro M, Tadamura E, Kubo S et al: Cardiac functional analysis
with multi-detector row CT and segmental reconstruction algorithm: comparison with echocardiography, SPECT, and MR imaging. Radiology, 2005; 234: 381–90
29. Nakaura T, Utsunomiya D, Shiraishi S et al: Three-dimensional cardiac image fusion using new CT angiography and SPECT methods. Am J Roentgenol, 2005; 185: 1554–57
30. Williams TJ, Manghat NE, McKay-Ferguson A et al: Cardiomyopathy: appearances on ECG-gated 64-detector row computed tomography. Clin Radiol, 2008; 63: 464–74
31. Calhoun PS, Kuszyk BS, Heath DG et al: Three-dimensional volume rendering of spiral CT data: theory and method. Radiographics, 1999; 19: 745–64
32. Sablayrolles JL, Al Attar N, Nataf P: New trends in non-invasive coronary angiography with multislice CT Surg Technol Int, 2004; 13: 205–13
33. Johnson PT, Heath DG, Kuszyk BS, Fishman EK: CT angiography with volume rendering: advantages and applications in splanchnic vascular imaging. Radiology, 1996; 200: 564–68
34. Brink J: Technical aspects of helical (spiral) CT. Radiol Clin North Am, 1995; 33: 825–41
35. Rubin GD, Beaulieu CF, Argiro V et al: Perspective volume rendering of CT and MR images: applications for endoscopic imaging. Radiology, 1996; 199: 321–30