R E S E A R C H
Open Access
Whole genome methylation profiles as
independent markers of survival in stage IIIC
melanoma patients
Luca Sigalotti
1*, Alessia Covre
1,2, Elisabetta Fratta
1, Giulia Parisi
1,2, Paolo Sonego
3, Francesca Colizzi
1, Sandra Coral
1,
Samuele Massarut
4, John M Kirkwood
5and Michele Maio
1,2*Abstract
Background: The clinical course of cutaneous melanoma (CM) can differ significantly for patients with identical stages of disease, defined clinico-pathologically, and no molecular markers differentiate patients with such a diverse prognosis. This study aimed to define the prognostic value of whole genome DNA methylation profiles in stage III CM.
Methods: Genome-wide methylation profiles were evaluated by the Illumina Human Methylation 27 BeadChip assay in short-term neoplastic cell cultures from 45 stage IIIC CM patients. Unsupervised K-means partitioning clustering was exploited to sort patients into 2 groups based on their methylation profiles. Methylation patterns related to the discovered groups were determined using the nearest shrunken centroid classification algorithm. The impact of genome-wide methylation patterns on overall survival (OS) was assessed using Cox regression and Kaplan-Meier analyses.
Results: Unsupervised K-means partitioning by whole genome methylation profiles identified classes with significantly different OS in stage IIIC CM patients. Patients with a “favorable” methylation profile had increased OS (P = 0.001, log-rank = 10.2) by Kaplan-Meier analysis. Median OS of stage IIIC patients with a “favorable” vs. “unfavorable” methylation profile were 31.5 and 10.4 months, respectively. The 5 year OS for stage IIIC patients with a “favorable” methylation profile was 41.2% as compared to 0% for patients with an “unfavorable” methylation profile. Among the variables examined by multivariate Cox regression analysis, classification defined by methylation profile was the only predictor of OS (Hazard Ratio = 2.41, for “unfavorable” methylation profile; 95% Confidence Interval: 1.02-5.70; P = 0.045). A 17 gene methylation
signature able to correctly assign prognosis (overall error rate = 0) in stage IIIC patients on the basis of distinct methylation-defined groups was also identified.
Conclusions: A discrete whole-genome methylation signature has been identified as molecular marker of prognosis for stage IIIC CM patients. Its use in daily practice is foreseeable, and promises to refine the comprehensive clinical management of stage III CM patients.
Keywords: Whole-genome methylation profiling, Prognosis, Prognostic signature, Hypermethylation, Immunotherapy
* Correspondence:[email protected];[email protected]
1Cancer Bioimmunotherapy Unit, Centro di Riferimento Oncologico, Istituto
di Ricovero e Cura a Carattere Scientifico, Aviano, Italy
2Division of Medical Oncology and Immunotherapy, Department of
Oncology, University Hospital of Siena, Istituto Toscano Tumori, Siena, Italy Full list of author information is available at the end of the article
© 2012 Sigalotti et al.; licensee BioMed Central Ltd. This is an Open Access article distributed under the terms of the Creative Commons Attribution License (http://creativecommons.org/licenses/by/2.0), which permits unrestricted use, distribution, and reproduction in any medium, provided the original work is properly cited.
Background
Cutaneous melanoma (CM) is an aggressive neoplasm with growing incidence and mortality rates in industria-lized countries, and the leading cause of skin cancer-related deaths worldwide [1]. At present, the only estab-lished prognosticator of 5-year survival, used clinically for routine therapy and for clinical trials, is the clinico-pathological stage of disease. Overall survival (OS) rates range from 95% for stage I to 7% for stage IV patients [2,3]. However, the clinical course of CM within clinico-pathological stages also differs radically, and the lack of prognostic markers has impaired our ability to identify subjects with highly aggressive as opposed to indolent course of disease [4].
Methylation of genomic DNA in mammals occurs at the 5 C-position of cytosine in the context of CpG dinucleo-tides, resulting in gene silencing through different mechan-isms [5]. Alterations in genomic DNA methylation represent a hallmark of cancer and actively contribute to cancer development and progression through inactivation of tumor suppressor genes (TSG) by aberrant promoter hypermethylation [6]. In particular, epigenetic alterations have emerged as important factors in tumor progression in CM, as demonstrated by the growing list of genes that are transcriptionally inactivated by aberrant DNA hypermethy-lation in this neoplasia, affecting virtually every pathway known to be important for its biology [5]. The increasing role of aberrant methylation in CM biology strongly sug-gests the potential of methylation markers as indicators of disease prognosis. Along this line, preliminary studies high-light a possible prognostic role of the methylation status of selected genes in CM patients. Among these, PTEN methy-lation emerged as an independent negative prognostic fac-tor in a cohort of 230 patients with stage 0 to IV of disease; however, it did not outperform traditional markers of tumor thickness and ulceration [7]. Similarly, methylation of the TSG TSLC1 was found to be significantly increased in advancing CM stages, where it was associated with reduced disease-related survival [8]. Furthermore, methylation of the ‘methylated in tumors’ (MINT) locus 31 was shown to be significantly associated with advancing clinical stage among 107 stage I to IV CM patients, predicting improved disease-free survival and OS of the 25 stage III patients analyzed [9]. While these data are encouraging, studies reported to date have several limitations, including: i) investigation of only single/few genes; ii); a priori selection of genes to be evaluated; iii) analysis of CM patients popula-tions with highly heterogeneous stages of disease. To address these issues, in an initial search for the prog-nostic significance of DNA methylation of CM cells, we have recently demonstrated that global genomic DNA hypermethylation, as evaluated on the Long Interspersed Nucleotide Element-1 (LINE-1) repetitive
sequences, is associated with significantly reduced OS among stage IIIC CM patients [10].
Based on these promising findings, this study aimed to explore whether whole-genome methylation profiles may account for the differential prognosis of CM patients within an identical clinico-pathological stage of disease. To this end, neoplastic cells from 45 stage IIIC CM patients were analyzed for their genome-wide methyla-tion profiles by the Infinium HumanMethylamethyla-tion27 BeadChips, which allow interrogation of methylation for over 14,000 genes. Autologous short-term neoplastic cell cultures were utilized instead of tumor tissues to overcome alterations in the evaluation of CM-specific genomic methylation profiles due to the presence of contaminating normal cells.
The results generated demonstrate that whole-genome methylation profiling is a powerful tool to identify CM patients with a significantly different prognosis, and that a methylation signature of 17 genes can be utilized to assign CM patients to distinct prognostic groups.
Methods
Patients and cell cultures
Short-term cell cultures were established from meta-static lesions removed surgically from consecutive CM patients referred to the National Cancer Institute of Aviano (Italy) for stage III surgery from 1991 to 2007, as previously described [11]. Patients provided written informed consent as per Italian regulations. Success rate in establishing autologous tumor cell cultures from neoplastic tissues was approximately 30%. The micrometastatic nature of lymph-node tumor tissues from AJCC stage IIIA patients precluded their use for cell culture generation, while short-term CM cultures were available from 13 stage IIIB patients, and so were excluded from the study. Thus, the planned investigations were conducted on short-term cultures generated from a total of 45 CM patients, classified as AJCC stage IIIC, who received highly heteroge-neous treatments for their disease, including chemo-therapy with different agents, immunochemo-therapy, and radiotherapy. Forty-three cell cultures were derived from metastatic lymph-nodes ad 2 from subcutaneous loco-regional lesions. Short-term CM cell cultures were grown in RPMI 1640 Medium supplemented
with 20% heat-inactivated fetal calf serum and
2 mM L-glutamine (Biochrome KG, Berlin, Germany). To minimize alterations potentially arising with extended in vitro culturing, all cell cultures were uti-lized for molecular assays at the 6th ex vivo passage. Cell cultures were confirmed to contain≥ 95% CM cells as determined by indirect immunofluorescence staining followed by flow cytometric analyses for melanoma-associated antigens (data not shown).
Whole genome methylation profiling
Genomic DNA was extracted from short-term cultures of CM cells by a standard proteinase K protocol [12]. The 45 samples under analysis were evaluated for genome-wide promoter methylation at the Cluster in Biomedicine scrl (Trieste, Italy) using the Illumina Infi-nium HumanMethylation27 Bead array (Illumina Inc, San Diego, CA). Analyses were conducted on 500 ng of genomic DNA, and were performed as per Illumina protocol. The arrays were imaged using a BeadArray™ Reader. Image processing and intensity data extraction were performed according to Illumina's instructions. The methylation status of a specifc CpG site was calcu-lated from the intensity of the methycalcu-lated (M)- and unmethylated (U)-specific beads, as the ratio of fluores-cent signals:β = Max(M,0)/[Max(M,0) + Max(U,0)]. DNA methylationβ values are continuous variables between 0, no methylation, and 1, completely methylated.
qMSP analyses
Genomic DNA was subjected to modification with so-dium bisulfite using the EZ DNA Methylation-Gold Kit (Zymo Research, Orange, CA, USA). Primers for the
analysis of the methylation status of ALOX12B,
SLC6A11, TUB, and WNT10B, were designed using the free on-line software MethPrimer [13], and are reported in the Table 1. SYBR green qMSP reactions were per-formed with methylated- or unmethylated-specific pri-mer pairs on 2 μl of bisulfite-modified genomic DNA. The copy number of methylated or unmethylated sequences for each target gene were established by ex-trapolation from the standard curves. The % of methyla-tion was defined as the ratio between methylated molecules and the sum of methylated and unmethylated molecules.
qRT-PCR analyses
Real-time qRT-PCR analyses were performed as previ-ously described [12]. Primers sets used are listed in Table 1. The copy number of target genes and of the reference gene β-actin were established in each sample by extrapolation from the standard curves. The number of target gene cDNA molecules in each sample was nor-malized to the number of cDNA molecules ofβ-actin. Statistical analysis
Statistical analyses were performed using the R statistical environment (http://www.R-project.org) and bioconductor packages (http://www.bioconductor.org). We used the methylumi package for importing and pre-processing the methylation data, the survival package for Kaplan-Meier estimates, and the pamr package for the shrunken centroid supervised analysis. The methylation data from the Illumina Beadstudio software were imported in R, checked for
quality and normalized. K-means partitioning clustering was used to divide the data into 2 groups. The primary objective was to determine differences in OS between the patient groups defined by K-means partitioning. Survival time was calculated in months from the date of stage IIIC diagnosis until the date of death. According with the specific goals of the analysis, we did not classify the deaths considering their cause. Patients were censored at the last follow-up date or the last date the patient was known to be alive. Median survival duration was determined by the Kaplan-Meier method [14]. Cumulative survival was evaluated using the log-rank test. Cox proportional hazard method [15] was Table 1 Sequences of primers used for qMSP and
qRT-PCR assays
qMSP
GENE Primer sequence1 Amplicon
size (bp)2 SLC6A11 MF: TGTTTAGGGTTGGGAAGAAGTTAC 128 MR: ATCGCAATAAACTAAAAAACCTACG UF: TGTTTAGGGTTGGGAAGAAGTTAT 133 UR: AATAAATCACAATAAACTAAAAAACCTACA TUB MF: TGGTTGTTAGTTTGATTGTTGTTAC3 96 MR: AAAACCTATTAAAATTCCCTATATTCG UF: GTGGTTGTTAGTTTGATTGTTGTTAT 97 UR: CTAAAACCTATTAAAATTCCCTATATTCA ALOX12B MF: TTCTCTTACCTACCTTAAACCTTCG 152 MR: TGAGATGGAGTTTCGTGTTTTC UF: TTCTCTTACCTACCTTAAACCTTCA 154 UR: AGTGAGATGGAGTTTTGTGTTTTT WNT10B MF: TGGGGTGTATAGGTAAAGGTAAATC 91 MR: GAAAATAAATCAAACGAAAACACG UF: TGGGGTGTATAGGTAAAGGTAAATT 93 UR: TCAAAAATAAATCAAACAAAAACACA qRT-PCR
GENE Primer sequence Amplicon
size (bp) ALOX12B F: ACCCGAGGGCAAGATGAT 74 R: GCAGGAAGATGGGGCAAT SLC6A11 F: AGGGGGTACCCATTGCTG 65 R: CTTGGGGTACGCAATAAAGG TUB F: TCCGACTGGATTCCCTACAG 109 R: GGCGCTTCTTCTTCTGCTT WNT10B F: GCGAATCCACAACAACAGG 107 R: TCCAGCATGTCTTGAACTGG 1
MF, methylated forward primer; MR, methylated reverse primer; UF, unmethylated forward primer; UR, unmethylated reverse primer; F, forward primer; R, reverse primer.
2
Size of the amplification product in base pairs.
3
used to examine the effect of classification by genome-wide methylation profiles on survival and results were presented as HR with corresponding 95% CI. Variables significantly associated with OS in univariate analysis were included in a multivariate model.
Methylation patterns (signatures) of the discovered groups were determined using the nearest shrunken cen-troid classification algorithm (PAM). The threshold for balancing between the number of sample correctly clas-sified and the subset of features representing the methy-lation patterns was determined by cross-validation [16]. The correlation between methylation values from Illu-mina Infinium and qMSP assays, as well as between gene methylation and mRNA expression, were evaluated by the Spearman’s rank correlation test. The genome-wide methylation profile of each patient was also sum-marized with a“methylation score” as follows: methyla-tion for each gene among the patients was standardized by the Z score method, each patient was then assigned a “methylation score” consisting of the average of Z scores of all genes. Differences in “methylation score” between k-means defined patient groups were evaluated by Stu-dent’sT test. Reported P values are two sided and values <0.05 were considered to be statistically significant. Results
Patients
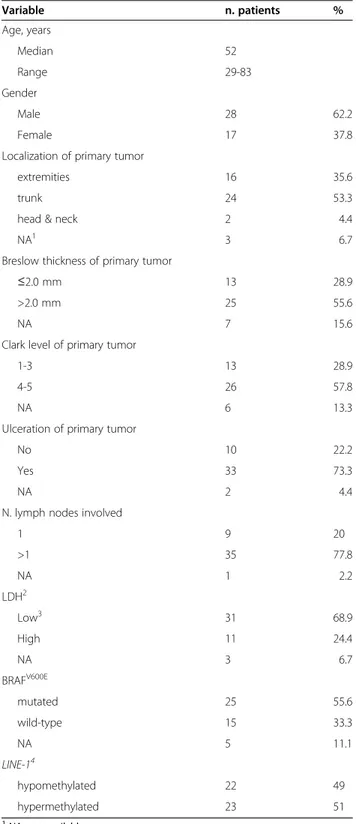
The study was conducted on CM patients who under-went radical lymph node dissection for stage III disease at the Centro di Riferimento Oncologico National Can-cer Institute between 1991 and 2007. Patients diagnosed with a stage IIIC disease, and for whom a short-term cell culture had been successfully generated from the surgi-cally removed autologous neoplastic tissue, were included. Table 2 summarizes the 45 patients under study and their clinico-pathologic characteristics at presentation.
Unsupervised analysis of whole-genome methylation profiles and survival analysis
Genome-wide gene methylation profiles were evaluated in the 45 short-term CM cell cultures under study using the Illumina HumanMethylation27 Bead-Chip whole-genome assay, which interrogates 27,578 CpG sites, cor-responding to 14,495 genes. Patients were divided into 2 subgroups, according to their whole genome methylation profile, by the k-means clustering method (Figure 1). The subgroups generated included 33 and 12 patients (Figure 1).
“Methylation scores” were calculated for each patient describing the methylation density of the genome, with values > 0 representing methylation above the popula-tion’s mean. Noteworthy, the 2 k-means-defined groups differed significantly (p < 0.001) in their global levels of
Table 2 Characteristics of the 45 AJCC stage IIIC melanoma patients Variable n. patients % Age, years Median 52 Range 29-83 Gender Male 28 62.2 Female 17 37.8
Localization of primary tumor
extremities 16 35.6
trunk 24 53.3
head & neck 2 4.4
NA1 3 6.7
Breslow thickness of primary tumor
≤2.0 mm 13 28.9
>2.0 mm 25 55.6
NA 7 15.6
Clark level of primary tumor
1-3 13 28.9
4-5 26 57.8
NA 6 13.3
Ulceration of primary tumor
No 10 22.2
Yes 33 73.3
NA 2 4.4
N. lymph nodes involved
1 9 20 >1 35 77.8 NA 1 2.2 LDH2 Low3 31 68.9 High 11 24.4 NA 3 6.7 BRAFV600E mutated 25 55.6 wild-type 15 33.3 NA 5 11.1 LINE-14 hypomethylated 22 49 hypermethylated 23 51 1
NA, not available.
2
LDH, lactate dehydrogenase.
3
low LDH is established as LDH values≤ 0.8 times the upper limit of normal; high LDH is defined as LDH values > 0.8 times the upper limit of normal.
4
extent of methylation of LINE-1 was evaluated by pyrosequencing and defined as hypomethylated or hypermethylated depending on the methylation level being < or≥ the median of the population, respectively.
gene methylation, the mean “methylation score” being −0.2 for the 33 patient group as compared to 0.46 for the 12 patient group (Figure 1). Accordingly, groups were re-ferred to as low-methylation (LM) and high-methylation (HM), respectively.
The impact of the genome-wide methylation profile-based classification on OS was assessed by Kaplan-Meier analysis. Results demonstrated a significant survival ad-vantage for patients classified as LM as compared to HM (P = 0.001, log-rank = 10.9), with an increased median OS of 31.5 months for LM (95% Confidence Interval (CI): 13.12-inf ) compared to 10.4 months (95% CI: 5.29-inf ) for HM patients (Figure 2). The 5 year OS of patients classified as LM and HM were 41.2% and 0%, respectively.
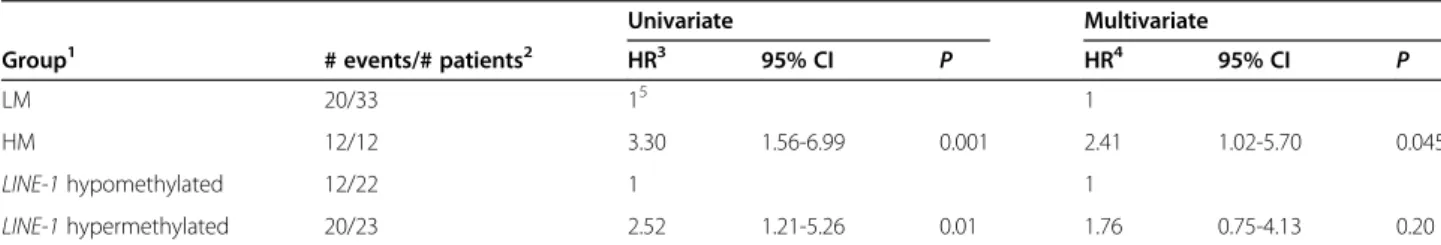
Cox univariate analysis was carried out to identify pa-tient characteristics and clinico-pathologic factors that predict OS. Among the range of factors examined, in-cluding age, gender, localization, Breslow thickness, Clark level and ulceration of primary tumor, as well as number of lymph nodes involved, pre-operative lactate dehydrogenase, BRAFV600E mutation status, and LINE-1
methylation, only classification by the genome-wide methylation profiles (Hazard Ratio (HR) =3.3 for group HM vs. LM; 95% CI: 1.56-6.99; P=0.001; Table 3) and LINE-1methylation (HR = 2.52 for LINE-1 hypermethylated vs hypomethylated group; 95% CI: 1.21-5.26; P=0.01; Table 3) were associated with statistically significant differ-ences in OS. When these 2 variables were included in a multivariate Cox model, only whole-methylome defined K-means classification retained a significant impact on OS (Table 3).
Despite the above reported impact on OS, χ squared analyses did not show any significant association be-tween methylation profiles and metastatic patterns, with a particular focus on the development of brain metastasis (p = 0.29).
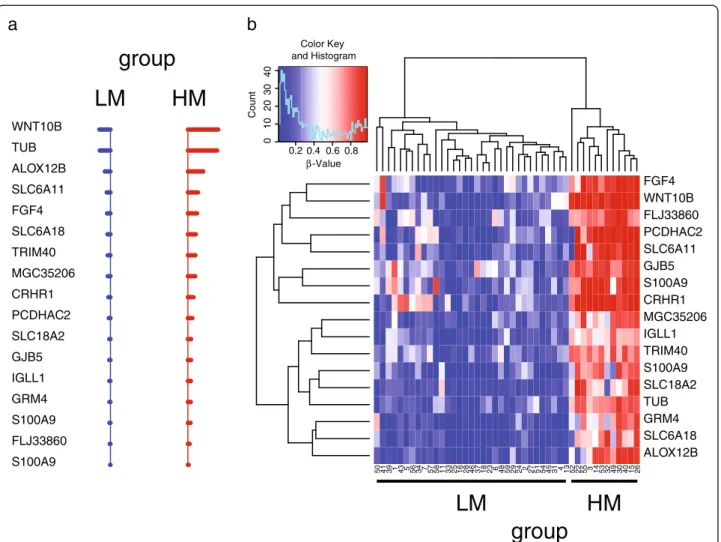
Identification of the methylation signature of CM patient subgroups with different prognosis
To define the methylation signature representing the minimal number of methylation markers characterizing LM and HM patient groups, we applied the “nearest shrunken centroid” algorithm [16] (Figure 3). A Figure 1 Groups of stage IIIC CM patients identified by whole-genome methylation profiling. Genome-wide DNA methylation profile was evaluated by Illumina HumanMethylation27 Bead-Chip whole-genome assay in short-term cultures of CM cells generated from neoplastic lesions of 45 stage IIIC CM patients. Cells were analyzed at 6thin vitro passage. Patients were divided into 2 classes (LM and HM) based on the whole
genome methylation profile of their tumor cells through the k-means algorithm. Panel a, the whole genome methylation profiles in the patients’ population have been reported as a heatmap. Patient identifier numbers and the k-means-defined groups have been reported on top of the heatmap. Each color patch represents the methylation level of one gene in each patient, with a continuum of methylation levels from dark blue (completely unmethylated,β = 0) to dark red (completely methylated, β = 1). Panel b, the genome-wide methylation profile of each patient was summarized by the“methylation score”, where “methylation scores” > and < 0 represent methylation above and below the population’s mean, respectively. Separate box plots have been generated for the LM and HM whole methylome defined patients’ groups. Black horizontal bars represent the median values of“methylation score” for each group. *, P = 0.001 as evaluated by Student’s T test.
methylation signature of 17 genes (Figure 3, Table 4), that allowed to correctly sort stage IIIC patients into groups LM and HM (overall error rate = 0), was identi-fied. A dramatic difference in the methylation status of the genes included in the signature is evident between the good prognosis LM and the bad prognosis HM groups of patients (Figure 3).
Validation of microarray data
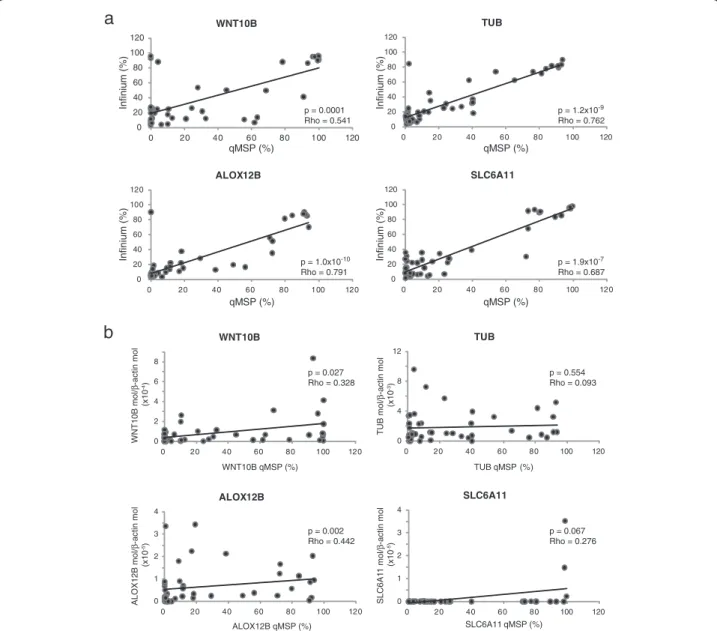
Array-based methylation profiling was validated on the short-term CM cell cultures under analysis using quanti-tative Methylation-Specific PCR (qMSP) for selected genes composing the 17-gene methylation signature. Genes were selected among those having the highest im-pact on the classification task, which could be identified
by their positioning at the top of the shrunken centroids graph (Figure 3a). Spearman’s rank correlation identified a highly significant (p≤ 10-4) positive correlation be-tween methylation values determined by the Illumina Infinium platform and those defined by qMSP, for all of the 4 genes under analysis (WNT10B, TUB, ALOX12B, SLC6A11; Figure 4). Coefficients of correlation ranged from 0.541 to 0.791, for WNT10B and ALOX12B, re-spectively (Figure 4).
To confirm the tumor-specificity of the methylation patterns identified, qMSP assays were also performed on commercially available epidermal melanocytes and nor-mal peripheral blood mononuclear cells from healthy subjects and selected patients under study. Results demonstrated an invariably unmethylated (WNT10B) or
b
a
time (months) P e rcent S ur vi va l 0 12 36 60 84 108 132 156 180 204 0 2 04 06 0 8 0 1 0 0 time (months) P e rcent S ur vi va l 0 12 36 60 84 108 132 156 180 204 02 0 4 0 6 0 8 0 1 0 0 median = 20.6 months group HM median = 10.4 months group LM median = 31.5 months Log-Rank = 10.9; p = 0.001Figure 2 Kaplan-Meier analysis of stage IIIC CM patients survival according to genome-wide methylation profiles. Genome-wide DNA methylation profile was evaluated by Illumina HumanMethylation27 Bead-Chip whole-genome assay in short-term cultures of CM cells generated from neoplastic lesions of 45 stage IIIC CM patients. Cells were analyzed at 6thin vitro passage. Patients were divided into 2 classes (LM and HM)
based on the whole genome methylation profile of their tumor cells through the k-means algorithm. Kaplan-Meier function for OS was calculated for stage IIIC CM patients either unstratified (a), or stratified according to k-means-defined methylation classes (b). Dashed and solid lines refer to patients’ groups LM and HM, respectively. Vertical bars in the Kaplan-Meier curves represent censored patients. Cumulative survival by k-means-defined methylation group was evaluated using the Log-Rank test, reported P values were two sided.
Table 3 Univariate and multivariate analysis of the influence of genome-wide methylation profiles on OS of stage III CM patients
Univariate Multivariate
Group1 # events/# patients2 HR3 95% CI P HR4 95% CI P
LM 20/33 15 1
HM 12/12 3.30 1.56-6.99 0.001 2.41 1.02-5.70 0.045
LINE-1 hypomethylated 12/22 1 1
LINE-1 hypermethylated 20/23 2.52 1.21-5.26 0.01 1.76 0.75-4.13 0.20
1
Patients were divided by the k-means clustering algorithm in 2 groups (LM, HM), according to their genome-wide methylation profile, or by LINE-1 methylation being < (hypomethylated) or≥ (hypermethylated) the median value of the population;
2
number of patients who died (# events) and total number of patients in the group (# patients) are reported.
3
Cox proportional hazard method was used to evaluate the effect of the examined variables on OS. Results were presented as Hazard Ratios (HR) with corresponding 95% Confidence Intervals (CI);
4
a multivariate Cox proportional hazard model was constructed for OS, including k-means clustering by whole-genome methylation profile and LINE-1 methylation;
5
methylated (TUB, ALOX12B, SLC6A11) status of the normal samples (data not shown) as compared to the variable levels of methylation observed in tumor cells (Figure 4).
Correlation with gene expression
The differential gene methylation patterns observed among CM patients could contribute to differential sur-vival through altered expression of the respective genes. To initially evaluate this aspect, the expression of selected genes included in the 17-gene methylation sig-nature was evaluated by quantitative RT-PCR (qRT-PCR) in the 45 short-term CM cell cultures under study.
Low, and somewhat heterogeneous levels of WNT10B, TUB, ALOX12B, and SLC6A11 mRNA were observed (Figure 4). A significant (p < 0.05) correlation was found between expression and gene methylation for WNT10B and ALOX12B, though Rho values were < 0.5.
Discussion
In this study we demonstrate that the genome-wide DNA methylation profile of tumor cells from CM patients with nodal metastases is a significant predictor of OS within stage IIIC. This finding provides the first evidence that genome-wide methylation profiles can serve as molecular markers of prognosis for CM patients
LM
S100A9 FLJ33860 S100A9 GRM4 IGLL1 GJB5 SLC18A2 PCDHAC2 CRHR1 MGC35206 TRIM40 SLC6A18 FGF4 SLC6A11 ALOX12B TUB WNT10BHM
a
50 41 39 1 43 5 56 34 7 57 58 11 33 25 16 28 46 37 18 23 6 48 59 29 24 2 27 51 54 45 31 4 13 52 22 55 3 14 53 32 49 30 40 15 26 ALOX12B SLC6A18 GRM4 TUB SLC18A2 S100A9 TRIM40 IGLL1 MGC35206 CRHR1 S100A9 GJB5 SLC6A11 PCDHAC2 FLJ33860 WNT10B FGF4 0.2 0.4 0.6 0.8 β-Value 0 1 02 0 3 04 0 CountLM
HM
Color Key and Histogramb
group
group
Figure 3 Prognostic methylation signatures identified by the“nearest shrunken centroid” algorithm in stage IIIC CM patients. Pre-processed genome-wide methylation data from stage IIIC CM patients under study was analyzed through nearest shrunken centroids algorithm to identify genes best characterizing the k-means defined prognostic methylation groups. Panel a, Shrunken differences for the 17 methylation markers, having at least 1 non-zero difference, selected as signature for LM (blue) and HM (red) groups. Lines to the left indicate relatively reduced levels of methylation; lines to the right indicate relatively increased levels of methylation. Genes defining the signature have been reported as Gene Symbol on the left of the panel. Duplicate Gene Symbol entries refer to methylation data read for the same gene from different probes. Panel b, the methylation values of the 17 genes composing the methylation signature in the patients’ population have been reported as a heatmap. Genes defining the signature have been reported as Gene Symbol on the right of the heatmap, while patient identifier numbers and the k-means-defined groups have been reported on foot of the heatmap. Duplicate Gene Symbol entries refer to methylation data read for the same gene from different probes. Each color patch represents the methylation level of one gene in each patient, with a continuum of methylation levels from dark blue (completely unmethylated,β = 0) to dark red (completely methylated, β = 1).
in this high-risk group, which has been the focus of mul-tiple adjuvant trials.
Promoter hypermethylation has been proposed to have an important impact on tumor biology through the silencing of TSG and the alteration of virtually every cellular pathway relevant to CM development and progression [5]. Accordingly, initial studies evaluated the status of specific genes known to be methylated in cancer, and showed an association of promoter hyper-methylation and advancing tumor stage, reduced disease-related survival and/or OS in CM patients [7,8]. These studies relied on the a priori selection of few genes and generally enrolled CM patients from highly heterogeneous disease stage-groupings.
The results of the present study demonstrate the adverse prognostic impact of genome-wide hypermethylated pro-files in relation to OS, and more importantly, for patients within a single stage sub-grouping of disease, have shown remarkable prognostic significance for the methylation pro-file. This observation strongly supports the notion that the constitutive methylation profile of cancer cells is intimately linked to the behavior of the tumor, and drives differing outcomes of disease. This concept is further strengthened by the discovery that, among all clinico-pathological and molecular factors examined, only those linked to
genome-wide methylation were significantly associated with OS among CM patients analyzed. In this context, the multivariate Cox model identified whole-methylome-profile-defined classification as the most robust prognostic marker, suggesting its superior ability in the identification of biologically relevant methylation backgrounds as compared to LINE-1 methylation [10].
Genome-wide methylation profiles could be recapitu-lated using a 17-gene signature, which was sufficient to correctly assign CM patients to the identified prognostic groups. Intriguingly, none of the genes composing the signature has been previously reported to be methylated in CM, demonstrating that “unbiased” methylation pro-filing represents an appropriate and possibly more ef-fective tool for the identification of novel prognostic/ predictive epigenetic markers in human cancer.
The mechanisms through which the different methy-lome profiles affect the survival of CM patients remain to be defined. A direct contribution of the products of the 17 signature genes is unlikely since no meaningful association was observed between methylation and expression of ana-lyzed genes (Figure 4). The methylation signature, thus, appears as an effective bona fide prognostic marker, accounting for the overall methylation profile of tumor cells, without a direct impact on tumor biology that can presently be defined. A similar observation was recently reported by Tanemura et al. [9] who evidenced a signifi-cant positive association of MINT31 hypermethylation and improved disease-free survival and OS in stage III CM patients. Since no established product is known for MINT31locus, the authors suggested that the methylation status of the locus could be linked to the activation status of additional genes yet to be identified [9]. This appears to be true, more in general, for the widely described phenomenon of the CpG island methylator phenotype (CIMP), which has been described in several tumor types, and refers to a high frequency of concomitant aberrant hypermethylation of different genes and/or chromosomal loci [17]. Indeed, presence of CIMP, rather than account-ing for the transcriptional suppression of the specific genes tested, identifies tumors that have a higher propen-sity to manifest genome-wide hypermethylation, and thus are more likely to inactivate genes critical for tumor pro-gression and response to therapy, leading to a worst prog-nosis [18]. In line with this notion, functional enrichment analysis of the genes that were significantly differentially methylated between LM and HM groups revealed a per-turbation of several biological pathways, including cyto-kine signaling, cell adhesion, drug and retinol metabolism, and natural killer cell mediated cytotoxicity (Additional file 1). Thus, the global alteration of these pathways could account for the different OS of CM patients bearing differ-ent methylomes. Intriguingly, biological processes involved in immune response are highly represented in Table 4 Genes composing the prognostic methylation
signature for the 45 stage IIIC CM patients
TargetID1 GENE ID2 SYMBOL3 Distance to TSS4 CPG ISLAND5
cg00498305 6571 SLC18A2 480 TRUE cg01333788 2709 GJB5 93 FALSE cg02064402 348932 SLC6A18 249 FALSE cg02415431 3543 IGLL1 760 FALSE cg03742272 242 ALOX12B 316 FALSE cg05164634 7480 WNT10B 995 TRUE cg05492113 7275 TUB 152 FALSE cg07039113 6280 S100A9 1317 FALSE cg08929103 1394 CRHR1 1331 FALSE cg09196959 135644 TRIM40 70 FALSE cg09395732 6538 SLC6A11 461 TRUE cg14236389 284756 FLJ33860 58 TRUE cg14578030 2249 FGF4 1212 FALSE cg16139316 6280 S100A9 428 FALSE cg22088368 339669 MGC35206 1049 FALSE cg24076884 56134 PCDHAC2 569 TRUE cg26424956 2914 GRM4 83 FALSE 1
Illumina unique probe identifier;
2
Unique NCBI's Entrez Gene record (gene identifier) for the gene;
3
unique gene symbol as established by the HUGO Gene Nomenclature Committee;
4
distance in base pairs from the putative transcription start site of the gene;
5
location of the assayed CpG site in a region fulfilling the definition of CpG island.
the genes differentially methylated between HM and LM patients (Additional file 2), suggesting that an improved immune recognition of CM cells with a LM profile might contribute to the better survival of these patients. Though this hypothesis has still to be demonstrated and is cur-rently under investigation, an initial support may come from the well known involvement of promoter methyla-tion in regulating the expression of different molecules involved in the immune recognition of cancer cells, in-cluding: i) the de novo expression of the Cancer Testis
Antigens (CTA) tumor associated antigens by neoplastic cells of different histotype and melanoma stem cells fol-lowing promoter hypomethylation; ii) the direct correl-ation between levels and total number of CTA expressed in short-term cultures of CM cells and LINE-1 hypo-methylation (Sigalotti and Maio, unpublished); iii) the abil-ity of pharmacologic DNA hypomethylation to increase immunogenicity and immune recognition of cancer cells through the up-regulation of HLA class I and co-stimula-tory/accessory molecules [5,19]. 0 20 40 60 80 100 120 0 20 40 60 80 100 120 WNT10B p = 0.0001 Rho = 0.541 0 20 40 60 80 100 120 0 20 40 60 80 100 120 TUB p = 1.2x10⁻⁹ Rho = 0.762 0 20 40 60 80 100 120 0 20 40 60 80 100 120 ALOX12B p = 1.0x10⁻¹⁰ Rho = 0.791 Infinium (%) qMSP (%) 0 20 40 60 80 100 120 0 20 40 60 80 100 120 SLC6A11 Infinium (%) qMSP (%) Infinium (%) qMSP (%) Infinium (%) qMSP (%) p = 1.9x10⁻⁷ Rho = 0.687
a
0 2 4 6 8 0 20 40 60 80 100 120 WNT10B WNT10B mol/ β -actin mol (x10 -4) WNT10B qMSP (%) p = 0.027 Rho = 0.328 0 1 2 3 4 0 20 40 60 80 100 120 ALOX12B ALOX12B mol/ β -actin mol (x10 -5) p = 0.002 Rho = 0.442 ALOX12B qMSP (%) 0 1 2 3 4 0 20 40 60 80 100 120 SLC6A11 SLC6A1 1 mol/ β -actin mol (x10 -5) SLC6A11 qMSP (%) p = 0.067 Rho = 0.276 0 4 8 12 0 20 40 60 80 100 120 TUB qMSP (%) TUB TUB mol/ β -actin mol (x10 -3) p = 0.554 Rho = 0.093b
Figure 4 Validation of microarray data. Short-term cultures of CM cells generated from neoplastic lesions of 45 stage IIIC melanoma patients were evaluated for WNT10B, TUB, ALOX12B and SLC6A11 methylation and mRNA expression by qMSP and qRT-PCR analyses, respectively. All cells were analyzed at 6thin vitro passage. For each gene, the % of methylation measured by qMSP was defined as the ratio between methylated gene molecules and the sum of methylated and unmethylated gene molecules. Level of gene expression is reported as number of molecules of the target gene normalized to the number of molecules of the housekeeping geneβ-actin. Panel a, Correlation between % methylation defined by qMSP andβ-values defined by the Illumina HumanMethylation27 Bead-Chip assay was evaluated for each gene through the Spearman’s rank correlation test. Reported P values are two sided. Panel b, Correlation between methylation and mRNA expression was evaluated for each gene by Spearman’s rank correlation test. Reported P values are two sided.
Irrespective of the underlying biological features asso-ciated with the different whole-genome methylation pro-files, the prognostic value of methylome classification here identified for stage IIIC CM patients bears several import-ant practical clinical implications. Among these are: i) pro-viding an improved clinico-pathological sub-staging; ii) modulating post-surgery follow-up-procedures; iii) select-ing patients at higher risk of recurrence for adjuvant treat-ment(s); iv) stratifying patients in clinical trials based on their differential prognosis. This latter aspect is of particu-lar relevance also in view of multiple studies that have explored new adjuvant regimens in stage III CM patients, in the US and European cooperative groups. These con-siderations may not be restricted to CM. Indeed, a recent work, investigating whole-genome methylation profiles in breast cancer, demonstrated that the group of patients with high-methylation tumors disproportionately included individuals with a poor prognosis defined by the 70-gene expression prognostic signature of van’t Veer et al. [20]. Conclusions
In conclusion, the data reported in this study present the first whole-methylome defined prognostic classifier for advanced operable melanoma of stage IIIC, and suggest the evaluation of this for the routine clinico-pathological ascertainment of patients to allow a more accurate assess-ment of clinical trial results, as well as ultimately to enable personalized management of patients in the clinical rou-tine. Whether the methylation classifier presented in this study will be more easily and effectively translated into the daily clinical practice than previously identified gene expression- and microRNA-based prognostic classifiers [21] is the object of further investigations. Along this line, we are currently planning a prospective study to inde-pendently validate our findings and provide the required support for their feasible transfer into the clinical setting. Concomitantly, the pathways affected by aberrant methy-lation are being carefully explored and functionally char-acterized to possibly provide new therapeutic targets that could be hit by specific therapeutics, possibly combined with epigenetic treatments.
Additional files
Additional file 1: Biological pathways significantly over-represented in genes differentially methylated between HM and LM CM patients. Additional file 2: Biological processes significantly over-represented in genes differentially methylated between HM and LM CM patients.
Abbreviations
CI: Confidence Intervals; CM: cutaneous melanoma; HM: high-methylation; HR: Hazard Ratio; LDH: lactate dehydrogenase; LINE-1: Long Interspersed Nucleotide Element-1; LM: low-methylation; MINT31: Methylated IN Tumors locus 31; OS: overall survival; qMSP: quantitative Methylation-Specific PCR; qRT-PCR: quantitative RT-PCR; TSG: tumor suppressor genes.
Competing interests
LS and MM have applied for a patent based on the findings reported in this manuscript. All other authors declare no conflict of interest.
Authors’ contributions
LS participated in designing and coordinating the study, acquiring laboratory data, data analysis and interpretation, and drafted the manuscript. AC, EF, GP, FC contributed in cellular biology procedures, molecular assays and data acquisition and analysis. PS performed the statistical analyses. SC, contributed in data interpretation. SM participated in acquisition of clinical data and data interpretation. JMK participated in data interpretation and manuscript drafting. MM conceived of the study, participated in its design and coordination, and contributed in producing the final draft of the manuscript. All authors read and approved the final manuscript.
Acknowledgments
This work was supported in part by grants from the Associazione Italiana per la Ricerca sul Cancro (IG 6038 to MM and MFAG 9195 to LS), Fondazione Monte dei Paschi di Siena, the Harry J. Lloyd Charitable Trust, the Istituto Superiore di Sanità, and SPORE P50CA121973.
Author details
1Cancer Bioimmunotherapy Unit, Centro di Riferimento Oncologico, Istituto
di Ricovero e Cura a Carattere Scientifico, Aviano, Italy.2Division of Medical Oncology and Immunotherapy, Department of Oncology, University Hospital of Siena, Istituto Toscano Tumori, Siena, Italy.3CBM scrl - Genomics, Area Science Park, Basovizza, Trieste, Italy.4Breast Surgery Unit, Centro di
Riferimento Oncologico, Istituto di Ricovero e Cura a Carattere Scientifico, Aviano, Italy.5University of Pittsburgh School of Medicine, Pittsburgh, PA,
USA.
Received: 24 May 2012 Accepted: 16 July 2012 Published: 5 September 2012
References
1. MacKie RM, Hauschild A, Eggermont AM: Epidemiology of invasive cutaneous melanoma. Ann Oncol 2009, 20(6):1–7.
2. Balch CM, Buzaid AC, Soong SJ, Atkins MB, Cascinelli N, Coit DG, Fleming ID, Gershenwald JE, Houghton A Jr, Kirkwood JM, et al: Final version of the American Joint Committee on Cancer staging system for cutaneous melanoma. J Clin Oncol 2001, 19(16):3635–3648.
3. Balch CM, Gershenwald JE, Soong SJ, Thompson JF, Atkins MB, Byrd DR, Buzaid AC, Cochran AJ, Coit DG, Ding S, et al: Final version of 2009 AJCC melanoma staging and classification. J Clin Oncol 2009, 27(36):6199–6206. 4. Jennings L, Murphy GM: Predicting outcome in melanoma: where are we
now? Br J Dermatol 2009, 161(3):496–503.
5. Sigalotti L, Covre A, Fratta E, Parisi G, Colizzi F, Rizzo A, Danielli R, Nicolay HJ, Coral S, Maio M: Epigenetics of human cutaneous melanoma: setting the stage for new therapeutic strategies. J Transl Med 2010, 8:56.
6. Esteller M: Epigenetics in cancer. N Engl J Med 2008, 358(11):1148–1159. 7. Lahtz C, Stranzenbach R, Fiedler E, Helmbold P, Dammann RH: Methylation
of PTEN as a prognostic factor in malignant melanoma of the skin. J Invest Dermatol 2010, 130(2):620–622.
8. You Y, Ma L, You M, Li X, Wang S, Li H, Wu D, Yang H, Li ZY: TSLC1 gene silencing in cutaneous melanoma. Melanoma Res 2010, 20(3):179–183. 9. Tanemura A, Terando AM, Sim MS, van Hoesel AQ, de Maat MF, Morton DL,
Hoon DS: CpG island methylator phenotype predicts progression of malignant melanoma. Clin Cancer Res 2009, 15(5):1801–1807.
10. Sigalotti L, Fratta E, Bidoli E, Covre A, Parisi G, Colizzi F, Coral S, Massarut S, Kirkwood JM, Maio M: Methylation levels of the "long interspersed nucleotide element-1" repetitive sequences predict survival of melanoma patients. J Transl Med 2011, 9:78.
11. Altomonte M, Gloghini A, Bertola G, Gasparollo A, Carbone A, Ferrone S, Maio M: Differential expression of cell adhesion molecules CD54/CD11a and CD58/CD2 by human melanoma cells and functional role in their interaction with cytotoxic cells. Cancer Res1993, 53(14):3343–3348. 12. Fratta E, Sigalotti L, Colizzi F, Covre A, Nicolay HJ, Danielli R, Fonsatti E,
Altomonte M, Calabro L, Coral S, et al: Epigenetically regulated clonal heritability of CTA expression profiles in human melanoma. J Cell Physiol 2010, 223(2):352–358.
13. Li LC, Dahiya R: MethPrimer: designing primers for methylation PCRs. Bioinformatics 2002, 18(11):1427–1431.
14. Kaplan EL, Meier P: Nonparametric Estimation from Incomplete Observations. J Am Statistical Association 1958, 53(282):457–481. 15. Cox DR: Regression models and life-tables (with discusssion). J Roy Statist
Soc B 1972, 34:187–220.
16. Tibshirani R, Hastie T, Narasimhan B, Chu G: Diagnosis of multiple cancer types by shrunken centroids of gene expression. Proc Natl Acad Sci U S A 2002, 99(10):6567–6572.
17. Teodoridis JM, Hardie C, Brown R: CpG island methylator phenotype (CIMP) in cancer: causes and implications. Cancer Lett 2008, 268(2): 177–186.
18. Shen L, Catalano PJ, Benson AB 3rd, O'Dwyer P, Hamilton SR, Issa JP: Association between DNA methylation and shortened survival in patients with advanced colorectal cancer treated with 5-fluorouracil based chemotherapy. Clinical cancer research: an official journal of the American Association for Cancer Research 2007, 13(20):6093–6098. 19. Sigalotti L, Fratta E, Coral S, Cortini E, Covre A, Nicolay HJ, Anzalone L,
Pezzani L, Di Giacomo AM, Fonsatti E, et al: Epigenetic drugs as pleiotropic agents in cancer treatment: biomolecular aspects and clinical
applications. J Cell Physiol 2007, 212(2):330–344.
20. Van der Auwera I, Yu W, Suo L, Van Neste L, van Dam P, Van Marck EA, Pauwels P, Vermeulen PB, Dirix LY, Van Laere SJ: Array-based DNA methylation profiling for breast cancer subtype discrimination. PLoS One 2010, 5(9):e12616.
21. Tremante E, Ginebri A, Lo Monaco E, Frascione P, Di Filippo F, Terrenato I, Benevolo M, Mottolese M, Pescarmona E, Visca P, et al: Melanoma molecular classes and prognosis in the postgenomic era. Lancet Oncol 2012, 13(5):e205–e211.
doi:10.1186/1479-5876-10-185
Cite this article as: Sigalotti et al.: Whole genome methylation profiles as independent markers of survival in stage IIIC melanoma patients. Journal of Translational Medicine 2012 10:185.
Submit your next manuscript to BioMed Central and take full advantage of:
• Convenient online submission • Thorough peer review
• No space constraints or color figure charges • Immediate publication on acceptance
• Inclusion in PubMed, CAS, Scopus and Google Scholar • Research which is freely available for redistribution
Submit your manuscript at www.biomedcentral.com/submit