O R I G I N A L I N V E S T I G A T I O N
Open Access
Altered glucose metabolism rather than naive
type 2 diabetes mellitus (T2DM) is related to
vitamin D status in severe obesity
Mattia Bellan
1, Gabriele Guzzaloni
2, Maura Rinaldi
2, Elena Merlotti
1, Carlotta Ferrari
1, Antonella Tagliaferri
2,
Mario Pirisi
1, Gianluca Aimaretti
3, Massimo Scacchi
2,4and Paolo Marzullo
2,3*Abstract
Context: The last decades have provided insights into vitamin D physiology linked to glucose homeostasis. Uncertainties remain in obesity due to its intrinsic effects on vitamin D and glucose tolerance.
Objectives: To assess the relationship between vitamin D and glucose abnormalities in severely obese individuals previously unknown to suffer from abnormal glucose metabolism.
Setting: Tertiary care centre.
Patients: 524 obese patients (50.3 ± 14.9 yrs; BMI, 47.7 ± 7.3 kg/m2) screened by OGTT, HbA1cand the lipid profile. Vitamin D status was assessed by 25(OH)D3, PTH and electrolyte levels. 25(OH)D3deficiency/insufficiency were set at 20 and 30 ng/ml, respectively. All comparative and regression analyses were controlled for age, BMI and gender. Results: The prevalence of vitamin D deficiency/insufficiency and secondary hyperparathyroidism were 95% and 50.8%, respectively. Normal glucose tolerance (NGT), impaired fasting glucose (IFG) or impaired glucose tolerance (IGT), and type 2 diabetes mellitus (T2DM) were found in 37.8%, 40.5% and 21.7% of cases, respectively. Large variations in metabolic parameters were seen across categories of vitamin D status, but the only significant
differences were found for C-peptide, tryglicerides, LDL- and HDL-cholesterol levels (p < 0.05 for all). The prevalence of vitamin D deficiency was documented to be slightly but significantly more frequent in glucose-intolerant patients (IFG + IGT + T2DM) compared to the -normotolerant counterpart (87% vs. 80%, p < 0.05). In partial correlation analyses, there was no association between vitamin D levels and glucose-related markers but for HbA1c(r =−0.091, p < 0.05), and both basal and OGTT-stimulated insulin levels (r = 0.097 and r = 0.099; p < 0.05 for all). Vitamin D levels were also correlated to HDL-cholesterol (r = 0.13, p = 0.002). Multivariate regression analysis inclusive of vitamin D, age, BMI, gender and fat mass as independent variables, showed that vitamin D was capable of predicting HbA1c levels (β = −0.101, p < 0.05).
Conclusions: Given the inherent effect of obesity on vitamin D and glucose homeostasis, current data suggest a potential independent role for vitamin D in the regulation of glucose metabolism in a setting of obese patients previously unknown to harbour glucose metabolism abnormalities.
* Correspondence:[email protected]
2
Division of General Medicine, Ospedale S. Giuseppe, I.R.C.C.S. Istituto Auxologico Italiano, Verbania, Italy
3
Department of Translational Medicine, Università del Piemonte Orientale “A. Avogadro”, Novara, Italy
Full list of author information is available at the end of the article
© 2014 Bellan et al.; licensee BioMed Central Ltd. This is an Open Access article distributed under the terms of the Creative Commons Attribution License (http://creativecommons.org/licenses/by/2.0), which permits unrestricted use, distribution, and reproduction in any medium, provided the original work is properly credited. The Creative Commons Public Domain Dedication waiver (http://creativecommons.org/publicdomain/zero/1.0/) applies to the data made available in this article, unless otherwise stated.
Introduction
Vitamin D is a secosteroid hormone, with an established role in bone homeostasis. Its di-hydroxylated active me-tabolite [1], 1,25(OH)2D3, binds the vitamin D nuclear
re-ceptor (VDR) and translocates to the nucleus to regulate gene expression [2]. Being the VDR located in several cells and tissues, a number of new hypothetical functions have been postulated to expand vitamin D role beyond its ability to regulate calcium homeostasis. As such, VDR has been found to affect 229 human genes [3], and in vivo and in vitro studies have increasingly linked vitamin D homeo-stasis to cardiovascular, autoimmune, tumoral, pulmonary and neurological diseases [4-7].
Assessment of vitamin D status relies on plasma meas-urement of its circulating metabolite, 25-hydroxyvitamin D (25(OH)D3), which is more stable, has a longer half-life and
reflects vitamin D storage more accurately than the active form [8]. Although no definitive consensus currently exists on the lowest 25(OH)D3levels of normalcy, the 25(OH)D3
threshold of 30 ng/ml (75 nmol/l) is deemed as adequate for fracture prevention in the general older population [9-11], while the 20 ng/ml cutoff limit has been alter-natively suggested to differentiate populations at true risk for the effects of vitamin D deficiency [12]. Cohort studies showed that vitamin D inadequacy occurs in approximately 36% of otherwise healthy young adults and up to 57% of inpatients, with even higher rates applying to European populations [13,14].
Causal factors of vitamin D deficiency include aging [15], longer life expectancy [16], lifestyle habits [17], and metabolic disorders [18]. An increased proportion of body fat as well as obesity have been documented to decrease bioavailability of cholecalciferol [19-21], due to its preferential accumulation in the adipose tissue [22]. Especially, a deranged vitamin D status may reflect an increased risk of type 2 diabetes mellitus (T2DM) in the general population [23]. While it is not completely clarified how vitamin D acts on glucose metabolism, postulated mechanisms include direct effects on insu-lin synthesis and release mediated by the VDR [24], and negative effects on insulin sensitivity elicited by secondary elevation of PTH levels [25]. As vitamin D upregulates lipoprotein lipase (LPL), this latter has been suggested to act as a potential link between vitamin D and glucose metabolism [26]. Nevertheless, the poten-tial effects of vitamin D status on insulin sensitivity are debated, as the correlation between vitamin D and re-sponse to insulin has been found direct by some studies [27] and modestly significant by others [28]. Recently, Muscogiuri and colleagues found that the correlation between low vitamin D levels and insulin resistance could be influenced by obesity, which was demonstrated to be the only predictor of low vitamin D levels [29] by multivariate analysis.
In this study, we aimed at exploring the relationship between vitamin D status and glucose homeostasis follow-ing screenfollow-ing for T2DM in a population of obese patients previously undiagnosed with abnormalities of glucose metabolism. To this purpose, our aims were: to subject obese patients to screening of glucose tolerance and insulin resistance by the OGTT and HbA1clevels, and
evaluation of the lipid profile; to assess the prevalence of hypovitaminosis D and secondary hyperparathyroidism in severe obesity; to examine the relationship linking low vitamin D concentrations to glucose intolerance, T2DM and lipid markers after correction for key vari-ables linked to these parameters; to identify a predictive role of vitamin D concentrations on glucose and lipid metabolism in this cohort.
Material and methods
We performed a single centre study in severely obese patients referring to the Istituto Auxologico Italiano (Verbania, Italy) for work-up and rehabilitation of their obese status. Data presented herein are part of a larger screening study on the prevalence of previously undiag-nosed glucose intolerance or incident T2DM in obesity (Type 2 diabetes mellitus Of New Diagnosis in Obesity, TONDO). More specifically, the TONDO study was designed to investigate the relationship between newly diagnosed glucose abnormalities and biochemical or functional markers of organ damage in subjects with uncomplicated and complicated obesity, with BMIs spanning from 35 to 70 kg/m2. Current data refer to an ad interim analysis on the relationship between vita-min D status and glucose metabolism. Approval from the Ethic Committee was obtained prior to the begin-ning of the study, and all patients signed the informed consent before enrollment into the study.
The current analysis included 524 consecutive cau-casian subjects affected with grade II and III obesity (BMI≥35 kg/m2), aged≥ 18 years. Exclusion criteria were as follows: previously known T1DM and untreated or treated T2DM; hormone treatments including cortico-steroids; any therapy capable of influencing calcium metabolism; previous or current vitamin D treatment; comorbidities affecting vitamin D metabolism, such as chronic kidney disease, liver cirrhosis, gastroentero-pancreatic disturbances, autoimmune disorders, primary hyperparathyroidism.
Upon enrollment, data were resumed as follows: height, weight, BMI (kg/m2), waist and hip circumferences, waist-to-hip ratio (WHR), personal and family history, ongoing therapies, body composition. Routine laboratory data included levels of 25(OH)D3, PTH, calcium and
phos-phorus, and C-reactive protein. Glucose metabolism was assessed by fasting plasma glucose, insulin and C-peptide levels; oral glucose tolerance test (OGTT) for glucose and
insulin levels; glycated haemoglobin (HbA1c). Lipid
analysis included total-cholesterol (t-CHO), high density lipoprotein-cholesterol (HDL-CHO), low density lipopro-tein -cholesterol (LDL-CHO) and triglycerides levels.
ADA recommendations [30] were used for the definition of glucose metabolism and T2DM, as follows: normal fast-ing plasma glucose (FPG) if <100 mg/dl (5.6 mmol/l); im-paired FPG (IFG) if FPG was 100–125 mg/dl (6.9 mmol/l); impaired glucose tolerance (IGT) if 2-h post-OGTT plasma glucose was 140–199 mg/dl (7.8-11.0 mmol/l); T2DM if FPG was≥126 mg/dl (≥7 mmol/l) on two days apart, or if 2-h post-OGTT plasma glucose was ≥200 mg/dl (≥11.1 mmol/l). HbA1c values of 5.7 and 6.5% were
considered as the threshold of normal glucose metabolism and T2DM, respectively. Insulin resistance was calculated by the homeostatic model of insulin resistance (HOMA-IR) as fasting insulin (μU/m) × [fasting PG (mmol/l)/22.5]. Vita-min D status was defined according to current guidelines [11] as: deficiency, 25(OH)D3< 20 ng/ml; insufficiency, 25
(OH)D320–29 ng/ml; adequacy, 25(OH)D3≥ 30 ng/ml.
Waist was measured as halfway between the costal edge and the crista. Hip was measured as the greatest circumference around the nates.
Body composition was evaluated according to percent-age of fat and fat-free mass. Fat mass (FM), fat-free mass (FFM), total body water, and extracellular water (ECW) were determined by bioelectrical impedance analysis (BIA 101/S; Akern, Florence, Italy). Analysis was performed using Bodygram software version 1.2 (Akern).
Laboratory data were obtained in a central laboratory. Blood glucose, t-CHO, HDL-CHO, LDL-CHO and triglyc-erides, and HbA1c were measured by enzymatic methods
(Roche Molecular Biochemicals, Mannheim, Germany). A two-site, solid-phase chemiluminescent immuno-metric assay or competitive immunoassay (Immulite 2000 Analyzer; DPC, Los Angeles, CA) was used for C-peptide with intra- and interassay coefficients of variation (CVs) of 1.9-3.3% and 3.8-5.5%, and PTH levels (CVs, 4.2-5.7% and 6.3-8.8%). Levels of 25(OH)D3(CVs, 1.7-7.8 and 2.2-10.7%)
and insulin (CVs, 0.8-1.5% and 2.4-4.9%) were measured using a Cobas Integra 800 Autoanalyzer (Roche Diagnostics, Indianapolis, IN). Ultrasensitive C-reactive protein was measured by (latex) HS Roche kit using Cobas Integra 800 (Roche Diagnostics).
Statistical analysis
Statistical analyses were performed using IBM SPSS (version 18, Somers, NY, USA). The statistical significance standard was set at 5%. Data normality was tested using the Shapiro Wilk test. If data points were not normally distributed, statistical analysis was attempted on the natural logarithm of the values to improve the symmetry and homoscedasticity of the distribution. Log-transformed values of 25(OH)D3, PTH, glucose,
insulin, c-peptide, C-reactive protein, HbA1c, calcium
and phosphorus were therefore used for comparative, univariate and multivariate analyses. For homogeneity of presentation, both normally distributed and non-normally distributed data are presented as medians with interquartile ranges (IQR). Differences in categorical variables were ana-lyzed byχ2test, and two-tailed, unpaired T- test or analysis of covariance were used for continuous variables depending on their distribution. Regression analyses and analysis of variance for multiple dependent variables by one or more factor variables or covariates were calculated using the general linear model multivariate procedure, comprising of the effects of covariate interactions with the variables of interest. To determine the impact of vitamin D status on metabolic variables, different models were attempted and the following covariates of inter-est, as well as their interaction, were used if not mutu-ally excluded by the collinearity test: age, gender, BMI, percent fat body mass, fat body mass in weight, lean body mass in weight, and WHR. Multivariate linear and logistic regression analysis were used to estimate the coefficients of the linear equation, involving one or more independent variables, that best predict the value of the dependent variable.
Results
Data from 524 severely obese patients (303 females; 221 males), consecutively recruited according to the inclusion criteria, constituted our analytical sample, as detailed in Table 1. After subgrouping by gender, there were expected differences in anthropometric and meta-bolic parameters, whilst 25(OH)D3 and PTH levels were
not dissimilar between men and women. In the population as a whole, screening for T2DM by the OGTT and HbA1c
levels revealed normal glucose metabolism in 37.8%, while IFG / IGT were present in 40.5%; de novo T2DM was di-agnosed in 21.7% of subjects (Table 2). Analysis of 25(OH) D3 levels showed no seasonal variations, and 25(OH)D3
concentrations were in the range of deficiency in 84.7% (N = 444; F/M, 57.4/42.6%), insufficiency in 10.3% (N = 54; F/M, 58.2/41.8%) and normalcy in 5% of patients (N = 26; F/M, 64.0/46.0%). The distribution of vitamin D status was similar between genders. Although the prevalence of glucose alterations differed markedly across categor-ies of vitamin D status (Table 3), the only difference achieving statistical significance was documented for C-peptide levels. Of note, analysis of the lipid panel underscored significant differences in HDL-CHO, LDL-CHO and triglycerides levels in function of vitamin D status (Table 3). When vitamin D status was analyzed in function of glucose metabolism we could only observe nonsignificant differences across groups after controlling for age, BMI and gender (Table 4). Oppositely, when the propensity toward vitamin D deficiency was analyzed in
function of glucose metabolism controlled for age, BMI and gender, we found that the prevalence of vitamin D deficiency was slightly but significantly greater (87% vs. 80%; OR: 1.75, 95% CI: 1.03-2.99; p = 0.04) in patients with an abnormal glucose profile (IFG + IGT + T2DM) compared to those with normal tolerance.
Analysis of PTH levels revealed secondary hyperpara-thyroidism (PTH≥65 pg/ml) in 50.8% of obese patients as a whole, and 54.7% of those with vitamin D deficiency/ insufficiency. Having vitamin D levels in the range of deficiency (<20 ng/ml) significantly increased the risk of secondary hyperparathyroidism (O.R., 2.38; 95% CI, 1.38-4.1; p < 0.01). PTH concentrations tended to increase proportionately to abnormalities of glucose metabolism (Table 4).
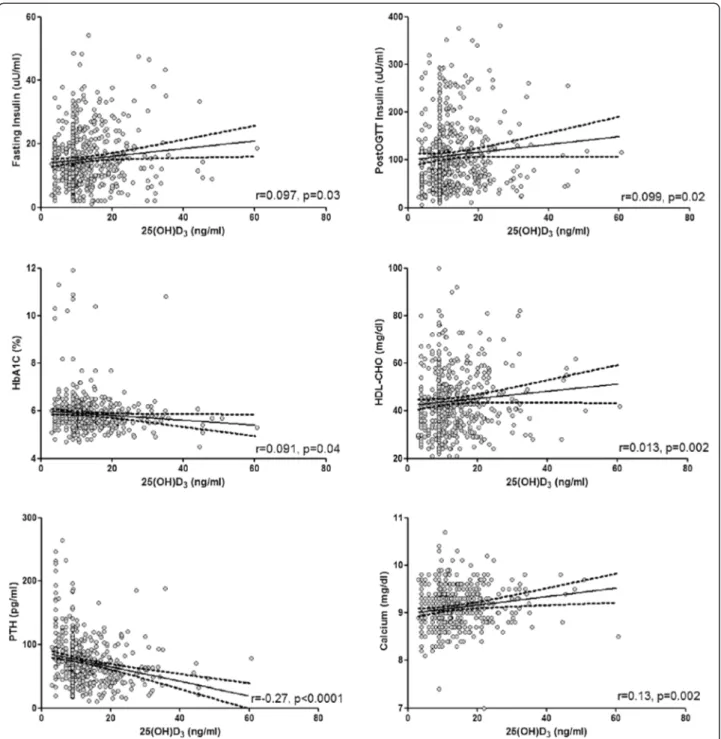
Correlation analysis was carried out after adjusting for age, BMI, and gender (Figure 1). We found no correlation between 25(OH)D3and either baseline or post-OGTT
glucose levels, while HbA1clevels increased progressively
with declining 25(OH)D3 levels (r =−0.091, p = 0.04).
Of note, 25(OH)D3concentrations were related to insulin
levels by direct association, both in fasting conditions (r = 0.097, p = 0.03) and after OGTT (r = 0.099, p = 0.02), with near-significant associations to HOMA-IR (r = 0.085, p = 0.053) and c-peptide levels (r = 0.084, p = 0.06). A
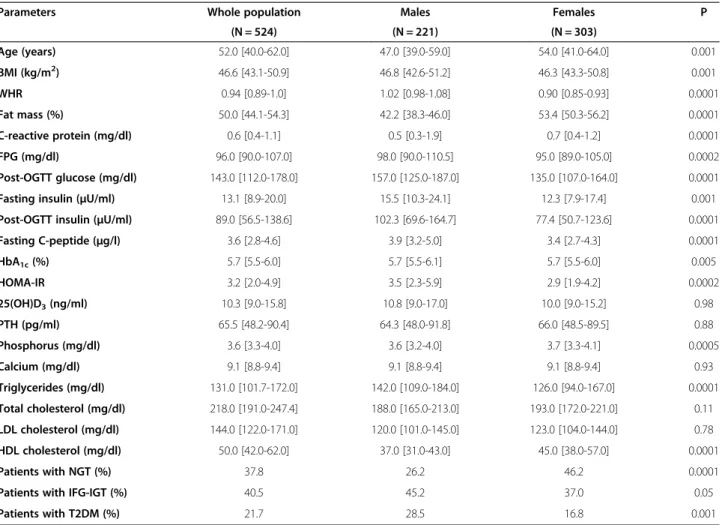
Table 1 Anthropometric and analytical variables obtained in the study population
Parameters Whole population Males Females P
(N = 524) (N = 221) (N = 303) Age (years) 52.0 [40.0-62.0] 47.0 [39.0-59.0] 54.0 [41.0-64.0] 0.001 BMI (kg/m2) 46.6 [43.1-50.9] 46.8 [42.6-51.2] 46.3 [43.3-50.8] 0.001 WHR 0.94 [0.89-1.0] 1.02 [0.98-1.08] 0.90 [0.85-0.93] 0.0001 Fat mass (%) 50.0 [44.1-54.3] 42.2 [38.3-46.0] 53.4 [50.3-56.2] 0.0001 C-reactive protein (mg/dl) 0.6 [0.4-1.1] 0.5 [0.3-1.9] 0.7 [0.4-1.2] 0.0001 FPG (mg/dl) 96.0 [90.0-107.0] 98.0 [90.0-110.5] 95.0 [89.0-105.0] 0.0002 Post-OGTT glucose (mg/dl) 143.0 [112.0-178.0] 157.0 [125.0-187.0] 135.0 [107.0-164.0] 0.0001 Fasting insulin (μU/ml) 13.1 [8.9-20.0] 15.5 [10.3-24.1] 12.3 [7.9-17.4] 0.001 Post-OGTT insulin (μU/ml) 89.0 [56.5-138.6] 102.3 [69.6-164.7] 77.4 [50.7-123.6] 0.0001
Fasting C-peptide (μg/l) 3.6 [2.8-4.6] 3.9 [3.2-5.0] 3.4 [2.7-4.3] 0.0001 HbA1c(%) 5.7 [5.5-6.0] 5.7 [5.5-6.1] 5.7 [5.5-6.0] 0.005 HOMA-IR 3.2 [2.0-4.9] 3.5 [2.3-5.9] 2.9 [1.9-4.2] 0.0002 25(OH)D3(ng/ml) 10.3 [9.0-15.8] 10.8 [9.0-17.0] 10.0 [9.0-15.2] 0.98 PTH (pg/ml) 65.5 [48.2-90.4] 64.3 [48.0-91.8] 66.0 [48.5-89.5] 0.88 Phosphorus (mg/dl) 3.6 [3.3-4.0] 3.6 [3.2-4.0] 3.7 [3.3-4.1] 0.0005 Calcium (mg/dl) 9.1 [8.8-9.4] 9.1 [8.8-9.4] 9.1 [8.8-9.4] 0.93 Triglycerides (mg/dl) 131.0 [101.7-172.0] 142.0 [109.0-184.0] 126.0 [94.0-167.0] 0.0001 Total cholesterol (mg/dl) 218.0 [191.0-247.4] 188.0 [165.0-213.0] 193.0 [172.0-221.0] 0.11 LDL cholesterol (mg/dl) 144.0 [122.0-171.0] 120.0 [101.0-145.0] 123.0 [104.0-144.0] 0.78 HDL cholesterol (mg/dl) 50.0 [42.0-62.0] 37.0 [31.0-43.0] 45.0 [38.0-57.0] 0.0001 Patients with NGT (%) 37.8 26.2 46.2 0.0001
Patients with IFG-IGT (%) 40.5 45.2 37.0 0.05
Patients with T2DM (%) 21.7 28.5 16.8 0.001
Data are presented as median values and interquartile ranges. For comparative analysis between genders, significance is calculated by unpaired T test for age and BMI, and by analysis of covariance for all other variables with age and BMI as covariates. Theχ2
test was used for comparative analyses between patients with NGT, IFG + IGT and T2DM. For abbreviations: BMI, Body Mass Index; WHR, Waist-to-Hip Ratio; FPG, Fasting Plasma Glucose; HbA1c, Glycated Haemoglobin; HOMA-IR,
Homeostatic Model of Insulin Resistance; 25(OH)D3, 25-hydroxy-vitamin D; PTH, Parathyroid Hormone; NGT, Normal Glucose Tolerance; IFG, Impaired Fasting
Glucose; IGT, Impaired Glucose Tolerance; T2DM, Type 2 Diabetes Mellitus.
Table 2 Patients distribution according to vitamin D status and glucose homeostasis
25(OH)D3 deficiency 25(OH)D3 insufficiency 25(OH)D3 adequacy Total NGT 160 (30.5%) 28 (51.8%) 10 (38.5%) 198 (37.8%) IFG/IGT 184 (35.1%) 17 (31.5%) 11 (42.3%) 212 (40.5%) T2DM 100 (19.1%) 9 (16.7%) 5 (19.2%) 114 (21.7%) Total 444 (84.7%) 54 (10.3%) 26 (5.0%) 524 (100%) Data are presented as cumulative values with percentages in parentheses. For abbreviations: 25(OH)D3, 25-hydroxyvitamin D; PTH, Parathyroid Hormone;
NGT, Normal Glucose Tolerance; IFG, Impaired Fasting Glucose; IGT, Impaired Glucose Tolerance; T2DM, Type 2 Diabetes Mellitus.
positive association was seen between 25(OH)D3 and
HDL-CHO levels (r = 0.13, p = 0.002). In addition to the previous, 25(OH)D3concentrations were markedly
cor-related to PTH (r =−0.27, p < 0.0001) and calcium levels (r = 0.13, p = 0.002).
Multiple logistic regression analysis was conducted on patients grouped by their glucose homeostasis as toler-ant (NPG + NGT) and intolertoler-ant (IFG + IGT + T2DM). A correct vitamin D status was found to reduce the risk of glucose alterations (OR: 0.59; 95% CI: 0.36-1.00; p < 0.05), although aging (OR: 1.04; 95% CI: 1.02-1.05; p < 0.0001) and female gender (OR: 0.33; 95% CI: 0.22-0.50; p < 0.0001) played a more dominant role on such event. However, the effect of vitamin D was lost upon inclusion of BMI in the regression equation.
In stepwise multivariate regression analysis, vitamin D levels showed the ability to predict HbA1c levels
(β = −0.101, p = 0.026) after age (β =0.213, p = 0.001) and WHR (β = 0.207, p = 0.001). Neither BMI nor gender entered the regression equation. Vitamin D did not elicit any predictive effect on the remaining indices of glucose metabolism. When PTH replaced vitamin D levels as a continuous variable in analysis of covariance and in linear
Table 3 Differences in continuous variables according to vitamin D status
25(OH)D3deficiency 25(OH)D3insufficiency 25(OH)D3adequacy p
(N = 444) (N = 55) (N = 25) Age (years) 53.0 [40.0-61.0] 52.5 [38.7-64.0] 52.0 [46.2-68.0] 0.78 BMI (kg/m2) 46.7 [43.3-51.3] 46.4 [41.2-49.0] 43.4 [40.8-47.1] 0.01 WHR 0.94 [0.89-1.02] 0.93 [0.88-1.01] 0.97 [0.90-1.03] 0.33 Fat mass (%) 49.6 [44.3-54.5] 50.0 [41.9-53.9] 51.0 [41.8-53.5] 0.59 C-reactive protein (mg/dl) 0.6 [0.4-1.1] 0.5 [0.3-1.0] 0.5 [0.4-1.0] 0.59 FPG (mg/dl) 96.0 [90.0-107.0] 93.0 [86.7-101.2] 97.0 [91.5-111.2] 0.06 Post-OGTT glucose (mg/dl) 144.0 [113.0-178.0] 125.0 [104.5-171.0] 136.0 [97.5-185.5] 0.29 Fasting insulin (μU/ml) 12.9 [8.6-19.8] 15.3 [10.0-20.9] 12.8 [8.6-25.4] 0.08 Post-OGTT insulin (μU/ml) 89.9 [55.1-138.8] 81.0 [57.4-135.6] 78.2 [52.9-135.0] 0.91
Fasting C-peptide (μg/l) 3.6 [2.8-4.6] 3.2 [2.5-4.9] 4.0 [3.0-5.9] 0.04 HbA1c(%) 5.8 [5.5-6.1] 5.6 [5.4-5.9] 5.7 [5.4-6.0] 0.10 HOMA-IR 3.1 [2.0-5.0] 3.6 [2.2-4.8] 3.3 [1.9-5.3] 0.14 PTH (pg/ml) 67.7 [50.0-93.2] 52.4 [39.6-70.8] 60.2 [34.2-74.2] 0.002 Phosphorus (mg/dl) 3.6 [3.3-4.0] 3.6 [3.1-3.8] 3.7 [3.5-4.1] 0.44 Calcium (mg/dl) 9.1 [8.8-9.4] 9.2 [8.9-9.5] 9.3 [9.0-9.5] 0.20 Triglycerides (mg/dl) 133.0 [102.0-174.2] 122.5 [91.0-155.0] 130.0 [101.0-168.0] 0.02 Total cholesterol (mg/dl) 192.0 [169.0-218.2] 182.0 [165.5-205.7] 200.0 [167.7-233.5] 0.09 LDL cholesterol (mg/dl) 122.0 [102.0-144.0] 110.5 [91.2-139.7] 126.0 [104.0-151.2] 0.04 HDL cholesterol (mg/dl) 41.5 [34.0-49.2] 46.5 [38.0-56.2] 41.5 [33.2-55.7] 0.04 Data are presented as median values and interquartile ranges. For comparative analysis, significance is calculated by ANOVA for age and BMI, and by analysis of covariance for all other variables using age, BMI and gender as covariates. Categories of Vitamin D status are detailed in the Patients and Methods section. For abbreviations: BMI, Body Mass Index; WHR, Waist-to-Hip Ratio; FPG, Fasting Plasma Glucose; HbA1c, Glycated Haemoglobin; HOMA-IR, Homeostatic Model of Insulin
Resistance; 25(OH)D3, 25-hydroxy-vitamin D; PTH, Parathyroid Hormone; NGT, Normal Glucose Tolerance; IFG, Impaired Fasting Glucose; IGT, Impaired Glucose
Tolerance; T2DM, Type 2 Diabetes Mellitus.
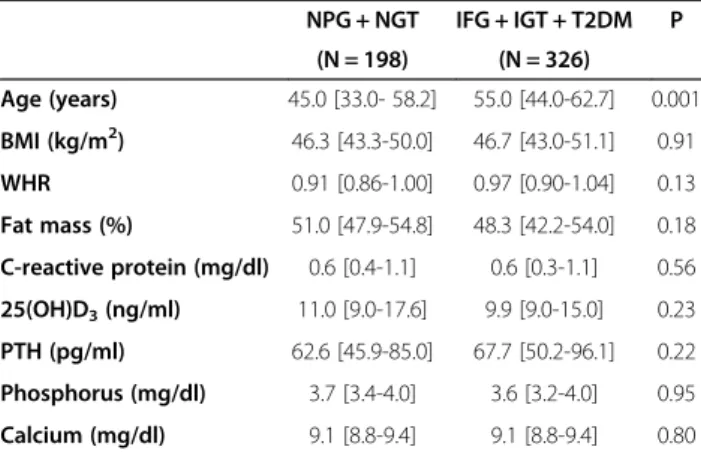
Table 4 Difference in continuous variables between patients aggregated by glucose homeostasis
NPG + NGT IFG + IGT + T2DM P (N = 198) (N = 326) Age (years) 45.0 [33.0- 58.2] 55.0 [44.0-62.7] 0.001 BMI (kg/m2) 46.3 [43.3-50.0] 46.7 [43.0-51.1] 0.91 WHR 0.91 [0.86-1.00] 0.97 [0.90-1.04] 0.13 Fat mass (%) 51.0 [47.9-54.8] 48.3 [42.2-54.0] 0.18 C-reactive protein (mg/dl) 0.6 [0.4-1.1] 0.6 [0.3-1.1] 0.56 25(OH)D3(ng/ml) 11.0 [9.0-17.6] 9.9 [9.0-15.0] 0.23 PTH (pg/ml) 62.6 [45.9-85.0] 67.7 [50.2-96.1] 0.22 Phosphorus (mg/dl) 3.7 [3.4-4.0] 3.6 [3.2-4.0] 0.95 Calcium (mg/dl) 9.1 [8.8-9.4] 9.1 [8.8-9.4] 0.80 Data are presented as median values and interquartile ranges. For
comparative analysis, significance is calculated by ANOVA for age and BMI, and by analysis of covariance for all other variables using age, BMI and gender as covariates. For abbreviations: NPG, Normal Plasma Glucose; NGT, Normal Glucose Tolerance; IFG, Impaired Fasting Glucose; IGT, Impaired Glucose Tolerance; T2DM, Type 2 Diabetes Mellitus; BMI, Body Mass Index; WHR, Waist-to-Hip Ratio; 25(OH)D3, 25-hydroxy-vitamin D; PTH, Parathyroid
or logistic regression equations, we failed to observe any significant effect of PTH levels on glucose and lipid me-tabolism after controlling for key covariates used through-out the data analysis procedures.
Discussion
This study, undertaken to assess if a causal relationship links glucose homeostasis and naive T2DM to vitamin D
status in obesity, documented a negative effect of vitamin D deficiency on glycated haemoglobin when the effect of age, BMI, and gender was accounted for. Our analysis did not capture a direct association between diabetes mellitus and vitamin D, possibly due to the overwhelming effects of obesity on both conditions, however patients with im-paired glucose tolerance clustered more frequently with an altered vitamin D status, after controlling for potential
Figure 1 Univariate regression analysis between metabolic variables of interest and vitamin D levels. Individual data represent continuous variables. Regression coefficients were calculated by the general linear model on individual log-transformed values after controlling for age, BMI and gender. For abbreviations: 25(OH)D3, 25-hydroxyvitamin D; HbA1c, Glycated Haemoglobin; PTH, Parathyroid Hormone; OGTT, Oral
confounding factors. The potential relationship linking vitamin D to metabolic homeostasis in obesity was substan-tiated by the observed association between vitamin D and insulin secretion, as well as HDL cholesterol levels.
Evidence collected until now shows that the relation-ship between T2DM and hypovitaminosis D is debatable, as the bulk of data is based on observational or epi-demiological studies, which are useful for generating hy-potheses but not for proving causality [31]. In previous studies, lower vitamin D concentrations were independ-ently associated with obesity, metabolic syndrome and IFG in a teenager population, with the risk of IFG being doubled in patients at the lowest compared to those at the highest quartile of vitamin D [32]. Similarly, waist circumference, triglycerides, fasting glucose and insulin sensitivity impairment were predicted by low vitamin D levels in an adult cohort of Australian patients [33]. Data from adults showed that hypovitaminosis D is correlated with the development of IGT [34], and an inverse correl-ation has been described between vitamin D concentrcorrel-ations and the risk of developing T2DM in a 22-year follow-up Finnish cohort study [35]; in obstructive sleep apnea syndrome-patients, vitamin D concentrations have also been inversely related to the risk of diabetes and metabolic syndrome [36]. Likewise, a higher prevalence of hypovita-minosis D was reported in diabetic patients compared to healthy controls in a population of middle aged Caucasian men and women and in South Asian UK residents [37,38]. Prospective studies prompted an inverse association between 25(OH)D3levels and future glycemia and
in-sulin resistance [39]. Finally, vitamin D seems to play a protective role on macrovascular damage in murine models of diabetes, slowing down one of the main diabetes related complications [40].
To the best of our knowledge, this is the first large study investigating such relationship in a homogeneous subset of severely obese patients, subjected to screening for T2DM by different biochemical approaches. One main finding consisted in the observation that neither 25(OH) D3 concentrations were lower nor hypovitaminosis D
was significantly more frequent in prediabetic and dia-betic obese patients compared to those with normogly-caemia, likely due to the blunting effect of obesity on circulating vitamin D levels. At variance with previous reports [32,34], we were unable to disclose negative effects of low 25(OH)D3concentrations on plasma glucose levels
both in fasting conditions and after the oral glucose challenge after correction for multiple variables known to affect glucose metabolism. Even so, we confirm the inverse correlation between 25(OH)D3 and glycated
haemoglobin, an established marker of glucose homeostasis [30,41,42]. It would be therefore important to expand to obesity results of prospective cohort studies describing an inverse association between vitamin D levels and the odds
of transitioning from normoglycaemia to IFG, from normoglycaemia to T2DM and from IFG to T2DM [43], confirmed by a recent meta-analysis [44]. Another cir-cumstance suggestive of this association involves the direct correlation found between 25(OH)D3and insulin
levels, both on fasting and after the OGTT. In previous studies on individuals at risk for T2DM [45], 25(OH)D3
concentrations were independently associated to insulin sensitivity and beta-cell function, and in subjects at risk or not for T2DM a positive correlation was found between vitamin D and early response of C-peptide and insulin levels to the oral glucose challenge [46]. Our findings may thus support the notion that vitamin D yields regulatory effects on insulin secretion in vitro and in vivo [47-49], while being in apparent contrast with previous inconclu-sive studies on poorly-controlled T2DM-patients with exhausted insulin secretion [50]. Because our patients harboured a glucose tolerance that spanned from normal to naive T2DM, and may have thus retained a superior beta-cell activity than patients with chronic T2DM, our results support the findings of Harris et al., who studied the effects of vitamin D supplementation in prediabetic obese patients and showed that the increase in 25(OH)D3
concentrations was associated with an increase of insulin secretion rate and C-peptide concentrations [51]. In a study by Guasch et al. [52], high 25(OH)D3levels were
significantly associated with HDL-cholesterol levels and diabetes/hyperglycemia, but this relationship was lost after adjustment for BMI. Also, vitamin D supple-mentation was shown to improve the metabolic profile of diabetic Saudi individuals undergoing different therapeutic regimens, with particular effectiveness on HDL-cholesterol levels [53]. In our analysis, the lipid profile clearly reflected vitamin D status, and high 25(OH)D3levels were
signifi-cantly associated with higher levels of HDL cholesterol, after adjustment for key confounding factors. This seems to confirm that vitamin D status is inversely related to atherogenic dyslipidemia [54,55], and indirectly suggests that vitamin D may be independently protective against the atherogenic profile in a population at high risk for cardiovascular disease.
Finally, current results substantiate the known high prevalence of vitamin D deficiency associated with obesity; the reason for this association has not been fully defined, and is commonly attributed to vitamin D accumulation in the adipose tissue [22,56-61]. In our experience, the cumu-lative prevalence of vitamin D deficiency and insufficiency was 95%. In our clinical practice, patients diagnosed with vitamin D deficiency receive cholecalciferol treatment (300.000 units p.o. for two consecutive days) and undergo regular follow-up. Also frequent was secondary hyperpara-thyroidism, affecting nearly 55% of subjects with vitamin D deficiency/insufficiency. These figures consolidate those found in similar studies [62,63]. Peculiarly, we observed
an inverse relationship between 25(OH)D3 and PTH
levels on one hand, and calcium concentrations on the other, both confirming the secondary origin of hyper-parathyroidism. In multivariate analysis, the enhancing effect of hypovitaminosis D on PTH secretion was inde-pendent of common confounding factors herein associ-ated. It is important to note that growing attention has recently focused on PTH as being a potentially closer factor associated to metabolic abnormalities than vita-min D levels. PTH plays a role in increasing the cardio-vascular risk possibly via its effects on blood pressure, insulin resistance, hyperglycaemia and low HDL-CHO levels [64]. In a population-based cross-sectional study of US men and women, the odds ratio for metabolic syndrome increased with increasing PTH in older men only [64], while a survey in aging European population showed that a decreased risk for metabolic syndrome with increasing quintiles of 25(OH)D3but not with PTH
[65]. Neither of these studies was adjusted for BMI. In another study in obese subjects, PTH was paradigmatically associated to the metabolic syndrome via other biomarkers like vitamin D and magnesium, albeit this association was only significant in women [66]. Based on our analysis in severely obese patients, our results do not appear to con-firm the predictive role of PTH on metabolic derangement when BMI, age and gender are accounted for. It would be valuable to corroborate this observation in a study encom-passing a wider BMI range.
The cross-sectional design of our study represents its main limitation, since no cause-effect relationship could have been investigated. Further studies are required to better define the impact of vitamin D status on the devel-opment of glucose metabolism alterations. Furthermore we have no data on the effect of vitamin D supplementa-tion on glycated haemoglobin. Recently, the correcsupplementa-tion of poor vitamin D status has been inversely associated with fasting insulin and HOMA-IR, in obese adolescents, but the effect on HbA1c levels has not been investigated [67].
An interventional study should specifically address this issue. Finally, if, on one hand, the high homogeneity of our sample could be considered a strength, on the other hand it could be seen as a weakness, since the selection of severely obese patients could have masked the relationship between vitamin D status and glucose metabolism. Some of the strengths of this study should not be neglected, in-cluding the significant amount of clinical data collected in a large population of obese people, the status of previously undiagnosed glucose abnormalities, and the adjustment for common confounders such as age, BMI, and gender.
Conclusions
While confirming the high prevalence of hypovitaminosis D in severe obesity, current data suggest a possible role for vitamin D in the regulation of glucose tolerance, insulin
secretion and lipid metabolism, on which obesity plays per se a dominant effect. Indirectly, our findings support the importance of vitamin D in contributing to metabolic homeostasis in obesity.
Competing interests
The authors have no potential competing interest to disclose. Authors’ contributions
MB contributed to data analysis and interpretation, and wrote the manuscript; GG and MR contributed to the study plan, patients recruitment and analysis, and data interpretation; EM, CF and AT contributed to patients recruitment and data collection; MP, GA and MS contributed to data interpretation and discussion; PM contributed to study plan and project management, patients recruitment and data analysis, manuscript writing. All authors read and approved the final manuscript.
Acknowledgments
We kindly acknowledge the contribution of Paola Quarto for data management and the nurse staff for their valuable contribution in clinical research. Funding
This work was partly funded by a grant from the Italian Ministry of Health (Progetto di Ricerca Corrente 18C203_2012).
Author details
1Department of Translational Medicine, Division of Internal Medicine,
Università del Piemonte Orientale“A. Avogadro”, Novara, Italy.2Division of
General Medicine, Ospedale S. Giuseppe, I.R.C.C.S. Istituto Auxologico Italiano, Verbania, Italy.3Department of Translational Medicine, Università del
Piemonte Orientale“A. Avogadro”, Novara, Italy.4Department of Clinical and
Community Sciences, University of Milan, Milan, Italy.
Received: 9 October 2013 Accepted: 27 February 2014 Published: 11 March 2014
References
1. Christakos S, Ajibade DV, Dhawan P, Fechner AJ, Mady LJ: Vitamin D: metabolism. Rheum Dis Clin North Am 2012, 38:1–1.
2. Jurutka PW, Whitfield GK, Hsieh JC, Thompson PD, Haussler CA, Haussler MR: Molecular nature of the vitamin D receptor and its role in regulation of gene expression. Rev Endocr Metab Disord 2001, 2:203–216.
3. Ramagopalan SV, Heger A, Berlanga AJ, Maugeri NJ, Lincoln MR, Burrell A, Handunnetthi L, Handel AE, Disanto G, Orton SM, Watson CT, Morahan JM, Giovannoni G, Ponting CP, Ebers GC, Knight JC: A ChIP-seq defined genome-wide map of vitamin D receptor binding: associations with disease and evolution. Genome Res 2010, 20:1352–1360.
4. Verhave G, Siegert CE: Role of vitamin D in cardiovascular disease. Neth J Med 2010, 68:113–118.
5. Hewison M: Vitamin D and the immune system: new perspectives on an old theme. Endocrinol Metab Clin North Am 2010, 39:365–379.
6. Herr C, Greulich T, Koczulla RA, Meyer S, Zakharkina T, Branscheidt M, Eschmann R, Bals R: The role of vitamin D in pulmonary disease: COPD, asthma, infection, and cancer. Respir Res 2011, 12:31.
7. Zittermann A, Gummert JF: Nonclassical vitamin D action. Nutrients 2010, 2:408–425.
8. Zerwekh JE: Blood biomarkers of vitamin D status. Am J Clin Nutr 2008, 87:1087–1091.
9. Chapuy MC, Preziosi P, Maamer M, Arnaud S, Galan P, Hercberg S, Meunier PJ: Prevalence of vitamin D insufficiency in an adult normal population. Osteoporos Int 1997, 7:439–443.
10. Bischoff-Ferrari H: Vitamin D: what is an adequate vitamin D level and how much supplementation is necessary? Best Pract Res Clin Rheumatol 2009, 23:789–795.
11. Holick MF, Binkley NC, Bischoff-Ferrari HA, Gordon CM, Hanley DA, Heaney RP, Murad MH, Weaver CM, Endocrine Society: Evaluation, treatment, and prevention of vitamin D deficiency: an Endocrine Society clinical practice guideline. J Clin Endocrinol Metab 2011, 96:1911–1930.
12. Rosen CJ, Abrams SA, Aloia JF, Brannon PM, Clinton SK, Durazo-Arvizu RA, Gallagher JC, Gallo RL, Jones G, Kovacs CS, Manson JE, Mayne ST, Ross AC,
Shapses SA, Taylor CL: IOM committee members respond to Endocrine Society vitamin D guideline. J Clin Endocrinol Metab 2012, 97:1146–1152. 13. Holick MF: High prevalence of vitamin D inadequacy and implications for
health. Mayo Clin Proc 2006, 81:353–373.
14. Mithal A, Wahl DA, Bonjour JP, Burckhardt P, Dawson-Hughes B, Eisman JA, El-Hajj Fuleihan G, Josse RG, Lips P, Morales-Torres J, IOF Committee of Scientific Advisors (CSA) Nutrition Working Group: Global vitamin D status and determinants of Hypovitaminosis D. Osteoporos Int 2009, 20:1807–1820. 15. Isaia G, Giorgino R, Rini GB, Bevilacqua M, Maugeri D, Adami S: Prevalence
of Hypovitaminosis D in elderly women in Italy: clinical consequences and risk factors. Osteoporos Int 2003, 14:577–582.
16. Holick MF, Matsuoka LY, Wortsman J: Age, vitamin D, and solar ultraviolet. Lancet 1989, 2:1104–1105.
17. Zgaga L, Theodoratou E, Farrington SM, Agakov F, Tenesa A, Walker M, Knox S, Wallace AM, Cetnarskyj R, McNeill G, Kyle J, Porteous ME, Dunlop MG, Campbell H: Diet, environmental factors, and lifestyle underlie the high prevalence of vitamin D deficiency in healthy adults in Scotland, and supplementation reduces the proportion that are severely deficient. J Nutr 2011, 141:1535–1542.
18. Vimaleswaran KS, Berry DJ, Lu C, Tikkanen E, Pilz S, Hiraki LT, Cooper JD, Dastani Z, Li R, Houston DK, Wood AR, Michaëlsson K, Vandenput L, Zgaga L, Yerges-Armstrong LM, McCarthy MI, Dupuis J, Kaakinen M, Kleber ME, Jameson K, Arden N, Raitakari O, Viikari J, Lohman KK, Ferrucci L, Melhus H, Ingelsson E, Byberg L, Lind L, Lorentzon M, et al: Causal relationship be-tween obesity and vitamin D status: bi-directional Mendelian randomization analysis of multiple cohorts. PLoS Med 2013, 10:e1001383. 19. Bell NH, Epstein S, Greene A, Shary J, Oexmann MJ, Shaw S: Evidence for
alteration of the vitamin D-endocrine system in obese subjects. J Clin Invest 1985, 76:370–373.
20. Snijder MB, van Dam RM, Visser M, Deeg DJ, Dekker JM, Bouter LM, Seidell JC, Lips P: Adiposity in relation to vitamin D status and parathyroid hormone levels: a population-based study in older men and women. J Clin Endocrinol Metab 2005, 90:4119–4123.
21. Hyppönen E, Power C: Vitamin D status and glucose homeostasis in the 1958 British birth cohort: the role of obesity. Diabetes Care 2006, 29:2244–2246. 22. Wortsman J, Matsuoka LY, Chen TC, Lu Z, Holick MF: Decreased
bioavailability of vitamin D in obesity. Am J Clin Nutr 2000, 72:690–693. 23. Farouhi NG, Ye Z, Rickard AP, Khaw KT, Luben R, Langenberg C, Wareham
NJ: Circulating 25-hydroxyvitamin D concentration and the risk of type 2 diabetes: results from the European prospective investigation into cancer (EPIC)-Norfolk color and updated meta-analysis of prospective studies. Diabetologia 2012, 55:2173–2182.
24. Maestro B, Molero S, Bajo S, Dávila N, Calle C: Transcriptional activation of the human insulin receptor gene by 1,25-dihydroxyvitamin D(3). Cell Biochem Funct 2002, 20:227–232.
25. Alvarez JA, Ashraf AP, Hunter GR, Gower BA: Serum 25-hydroxyvitamin D and parathyroid hormone are independent determinants of whole-body insulin sensitivity in women and may contribute to lower insulin sensitivity in African Americans. Am J Clin Nutr 2010, 92:1344–1349. 26. Huang Y, Li X, Wang M, Ning H, L A, Li Y, Sun C: Lipoprotein lipase links
vitamin D, insulin resistance, and type 2 diabetes: a cross-sectional epidemiological study. Cardiovasc Diabetol 2013, 12:17.
27. Lind L, Hänni A, Lithell H, Hvarfner A, Sörensen OH, Ljunghall S: Vitamin D is related to blood pressure and other cardiovascular risk factors in middle-aged men. Am J Hypertens 1995, 8:894–901.
28. Tai K, Need AG, Horowitz M, Chapman IM: Vitamin D, glucose, insulin, and insulin sensitivity. Nutrition 2008, 24:279–285.
29. Muscogiuri G, Sorice GP, Prioletta A, Policola C, Della Casa S, Pontecorvi A, Giaccari A: 25-hydroxyvitamin D concentration correlates with insulin-sensitivity and BMI in obesity. Obesity 2010, 18:1906–1910. 30. American Diabetes Association: Standards of medical care in diabetes - 2012.
Diabetes Care 2012, 35(Suppl 1):S11–S63.
31. Thacher TD, Clarke BL: Vitamin D insufficiency. Mayo Clin Proc 2011, 86:50–60.
32. Reis JP, von Mühlen D, Miller ER 3rd, Michos ED, Appel LJ: Vitamin D status and cardiometabolic risk factors in the United States adolescent population. Pediatrics 2009, 124:e371–e379.
33. Gagnon C, Lu ZX, Magliano DJ, Dunstan DW, Shaw JE, Zimmet PZ, Sikaris K, Ebeling PR, Daly RM: Low serum 25-hydroxyvitamin D is associated with increased risk of the development of the metabolic syndrome at five years: results from a national, population-based prospective study
(The Australian Diabetes, Obesity and Lifestyle Study: AusDiab). J Clin Endocrinol Metab 2012, 97:1953–1961.
34. Chiu KC, Chu A, Go VL, Saad MF: Hypovitaminosis D is associated with insulin resistance and beta cell dysfunction. Am J Clin Nutr 2004, 79:820–825. 35. Knekt P, Laaksonen M, Mattila C, Härkänen T, Marniemi J, Heliövaara M,
Rissanen H, Montonen J, Reunanen A: Serum vitamin D and subsequent occurrence of type 2 diabetes. Epidemiology 2008, 1:666–671. 36. Barceló A, Esquinas C, Piérola J, De la Peña M, Sánchez-de-la-Torre M,
Montserrat JM, Marín JM, Duran J, Arqué M, Bauça JM, Barbé F: Vitamin D status and parathyroid hormone levels in patients with obstructive sleep apnea. Respiration 2013, 86:295–301.
37. Tahrani AA, Ball A, Shepherd L, Rahim A, Jones AF, Bates A: The prevalence of vitamin D abnormalities in South Asians with type 2 diabetes mellitus in the UK. Int J Clin Pract 2010, 64:351–355.
38. Brock KE, Huang WY, Fraser DR, Ke L, Tseng M, Mason RS, Stolzenberg-Solomon RZ, Freedman DM, Ahn J, Peters U, McCarty C, Hollis BW, Ziegler RG, Purdue MP, Graubard BI: Diabetes prevalence is associated with serum 25-hydroxyvitamin D and 1,25-dihydroxyvitamin D in US middle-aged Caucasian men and women: a cross-sectional analysis within the prostate, lung, colorectal and ovarian cancer screening trial. Br J Nutr 2011, 106:339–344.
39. Forouhi NG, Luan J, Cooper A, Boucher BJ, Wareham NJ: Baseline serum 25-hydroxy vitamin d is predictive of future glycemic status and insulin resistance: the Medical Research Council Ely Prospective Study 1990–2000. Diabetes 2008, 57:2619–2625.
40. Salum E, Kampus P, Zilmer M, Eha J, Butlin M, Avolio AP, Põdramägi T, Arend A, Aunapuu M, Kals J: Effect of vitamin D on aortic remodeling in streptozotocin-induced diabetes. Cardiovasc Diabet 2012, 11:58. 41. Alemzadeh R, Kichler J, Babar G, Calhoun M: Hypovitaminosis D in obese
children and adolescents: relationship with adiposity, insulin sensitivity, ethnicity, and season. Metabolism 2008, 57:183–191.
42. Suzuki A, Kotake M, Ono Y, Kato T, Oda N, Hayakawa N, Hashimoto S, Itoh M: Hypovitaminosis D in type 2 diabetes mellitus: association with microvascular complications and type of treatment. Endocr J 2006, 53:503–510.
43. Tsur A, Feldman BS, Feldhammer I, Hoshen MB, Leibowitz G, Balicer RD: Decreased serum concentrations of 25-hydroxycholecalciferol are associated with increased risk of progression to impaired fasting glucose and diabetes. Diabetes Care 2013, 36:1361–1367.
44. Song Y, Wang L, Pittas AG, Del Gobbo LC, Zhang C, Manson JE, Hu FB: Blood 25-hydroxy vitamin D levels and incident type 2 diabetes: a meta-analysis of prospective studies. Diabetes Care 2013, 36:1422–1428. 45. Kayaniyil S, Vieth R, Retnakaran R, Knight JA, Qi Y, Gerstein HC, Perkins BA,
Harris SB, Zinman B, Hanley AJ: Association of vitamin D with insulin resistance and b-cell dysfunction in subjects at risk for type 2 diabetes. Diabetes Care 2010, 33:1379–1381.
46. Boucher BJ, Mannan N, Noonan K, Hales CN, Evans SJ: Glucose intolerance and impairment of insulin secretion in relation to vitamin D deficiency in east London Asians. Diabetologia 1995, 38:1239–1245.
47. Inomata S, Kadowaki S, Yamatani T, Fukase M, Fujita T: Effect of 1 alpha (OH)-vitamin D3 on insulin secretion in diabetes mellitus. Bone Miner 1986, 1:187–192.
48. Palomer X, González-Clemente JM, Blanco-Vaca F, Mauricio D: Role of vitamin D in the pathogenesis of type 2 diabetes mellitus. Diabetes Obes Metab 2008, 10:185–197.
49. Norman AW, Frankel JB, Heldt AM, Grodsky GM: Vitamin D deficiency inhibits pancreatic secretion of insulin. Science 1980, 209:823–882. 50. Orwoll E, Riddle M, Prince M: Effects of vitamin D on insulin and glucagon
secretion in non-insulin-dependent diabetes mellitus. Am J Clin Nutr 1994, 59:1083–1087.
51. Harris SS, Pittas AG, Palermo NJ: A randomized, placebo-controlled trial of vitamin D supplementation to improve glycaemia in overweight and obese African Americans. Diabetes Obes Metab 2012, 14:789–794. 52. Guasch A, Bulló M, Rabassa A, Bonada A, Del Castillo D, Sabench F, Salas-Salvadó
J: Plasma vitamin D and parathormone are associated with obesity and atherogenic dyslipidemia: a cross-sectional study. Cardiovasc Diabetol 2012, 11:149.
53. Alkharfy KM, Al-Daghri NM, Sabico SB, Al-Othman A, Moharram O, Alokail MS, Al-Saleh Y, Kumar S, Chrousos GP: Vitamin D supplementation in patients with diabetes mellitus type 2 on different therapeutic regimens: a one-year prospective study. Cardiovasc Diabetol 2013, 12(1):113.
54. Karhapaa P, Pihlajamaki J, Porsti I, Kastarinen M, Mustonen J, Niemela O, Kuusisto J: Diverse associations of 25-hydroxyvitamin D and
1,25-dihydroxy-vitamin D with dyslipidaemias. J Intern Med 2010, 268:604–610.
55. Martins D, Wolf M, Pan D, Zadshir A, Tareen N, Thadhani R, Felsenfeld A, Levine B, Mehrotra R, Norris K: Prevalence of cardiovascular risk factors and the serum levels of 25-hydroxyvitamin D in the united states: data from the third national health and nutrition examination survey. Arch Intern Med 2007, 167:1159–1165.
56. Yanoff LB, Parikh SJ, Spitalnik A, Denkinger B, Sebring NG, Slaughter P, McHugh T, Remaley AT, Yanovski JA: The prevalence of Hypovitaminosis D and secondary hyperparathyroidism in obese Black Americans. Clin Endocrinol (Oxf) 2006, 64:523–529.
57. Khor GL, Chee WS, Shariff ZM, Poh BK, Arumugam M, Rahman JA, Theobald HE: High prevalence of vitamin D insufficiency and its association with BMI-for-age among primary school children in Kuala Lumpur, Malaysia. BMC Public Health 2011, 11:95.
58. Çizmecioğlu FM, Etiler N, Görmüş U, Hamzaoğlu O, Hatun Ş: Hypovitaminosis D in obese and overweight schoolchildren. J Clin Res Pediatr Endocrinol 2008, 1:89–96.
59. Goldner WS, Stoner JA, Thompson J, Taylor K, Larson L, Erickson J, McBride C: Prevalence of vitamin D insufficiency and deficiency in morbidly obese patients: a comparison with non-obese controls. Obes Surg 2008, 18:145–150. 60. Rosenstreich SJ, Rich C, Volwiler W: Deposition in and release of vitamin
D3 from body fat: evidence for a storage site in the rat. J Clin Invest 1971, 50:679–687.
61. Mawer EB, Backhouse J, Holman CA, Lumb GA, Stanbury SW: The distribution and storage of vitamin D and its metabolites in human tissues. Clin Sci 1972, 43:413–431.
62. Vilarrasa N, Maravall J, Estepa A, Sánchez R, Masdevall C, Navarro MA, Alía P, Soler J, Gómez JM: Low 25-hydroxyvitamin D concentrations in obese women: their clinical significance and relationship with anthropometric and body composition variables. J Endocrinol Invest 2007, 30:653–658. 63. Moizé V, Deulofeu R, Torres F, de Osaba JM, Vidal J: Nutritional intake and
prevalence of nutritional deficiencies prior to surgery in a Spanish morbidly obese population. Obes Surg 2011, 21:1382–1388. 64. Reis JP, von Muhlen D, Miller ER: Relation of 25-hydroxyvitamin D and
parathyroid hormone levels with metabolic syndrome among US adults. Eur J Endocrinol 2008, 159:41–48.
65. Lee DM, Rutter MK, O’Neill TW, Boonen S, Vanderschueren D, Bouillon R, Bartfai G, Casanueva FF, Finn JD, Forti G, Giwercman A, Han TS, Huhtaniemi IT, Kula K, Lean ME, Pendleton N, Punab M, Silman AJ, Wu FC, European Male Ageing Study Group: Vitamin D, parathyroid hormone and the metabolic syndrome in middle-aged and older European men. Eur J Endocrinol 2009, 161:947–954.
66. Røislien J, Van Calster B, Hjelmesæth J: Parathyroid hormone is a plausible mediator for the metabolic syndrome in the morbidly obese:
a cross-sectional study. Cardiovasc Diabetol 2011, 10:17.
67. Belenchia AM, Tosh AK, Hillman LS, Peterson CA: Correcting vitamin D insufficiency improves insulin sensitivity in obese adolescents: a randomized controlled trial. Am J Clin Nutr 2013, 97:774–781.
doi:10.1186/1475-2840-13-57
Cite this article as: Bellan et al.: Altered glucose metabolism rather than naive type 2 diabetes mellitus (T2DM) is related to vitamin D status in severe obesity. Cardiovascular Diabetology 2014 13:57.
Submit your next manuscript to BioMed Central and take full advantage of:
• Convenient online submission
• Thorough peer review
• No space constraints or color figure charges
• Immediate publication on acceptance
• Inclusion in PubMed, CAS, Scopus and Google Scholar
• Research which is freely available for redistribution
Submit your manuscript at www.biomedcentral.com/submit