Early growth response 2 (Egr-2) expression is triggered by
NF-
κB activation
Solmaz Nafez
a, Kensuke Oikawa
a, Gary L. Odero
b, Michael Sproule
b, Ning Ge
b, Jason Schapansky
a,
Bernard Abrenica
b, Avril Hatherell
b, Chris Cadonic
c, Shunzhen Zhang
d, Xiaohua Song
e, Tiina Kauppinen
f,
Gordon W. Glazner
a, Mariagrazia Grilli
g, Michael P. Czubryt
h, David D. Eisenstat
i, Benedict C. Albensi
j,⁎
aSt. Boniface Hospital Research; University of Manitoba, Dept. of Pharmacology & Therapeutics, Winnipeg MB, Canada bSt. Boniface Hospital Research, Winnipeg MB, Canada
c
St. Boniface Hospital Research; University of Manitoba - Graduate Program in Biomedical Engineering, Winnipeg MB, Canada d
Manitoba Institute of Cell Biology, University of Manitoba, Winnipeg MB, Canada e
Dept. of Medical Genetics, University of Alberta, Edmonton AB, Canada f
University of Manitoba, Dept. of Pharmacology & Therapeutics, Winnipeg MB, Canada g
Dept. Pharmaceutical Sciences, University of Piemonte Orientale, Novara Italy
hSt. Boniface Hospital Research; University of Manitoba, Dept. of Physiology, Winnipeg MB, Canada i
Depts. of Pediatrics, Medical Genetics and Oncology, University of Alberta, Edmonton AB, Canada j
St. Boniface Hospital Research; University of Manitoba - Graduate Program in Biomedical Engineering; University of Manitoba, Dept. of Pharmacology & Therapeutics, Winnipeg MB, Canada
a b s t r a c t
a r t i c l e i n f o
Article history: Received 14 July 2013 Revised 18 November 2014 Accepted 27 December 2014 Available online 30 December 2014 Keywords: Transcription factor Gene expression Egr NF-κB Signal transduction MemoryTranscription factors are known to play multiple roles in cellular function. Investigators report that factors such as early growth response (Egr) protein and nuclear factor kappa B (NF-κB) are activated in the brain during cancer, brain injury, inflammation, and/or memory. To explore NF-κB activity further, we investigated the transcriptomes of hippocampal slices following electrical stimulation of NF-κB p50 subunit knockout mice (p50−/−) versus their controls (p50+/+). We found that the early growth response gene Egr-2 was upregulated
by NF-κB activation, but only in p50+/+hippocampal slices. We then stimulated HeLa cells and primary cortical
neurons with tumor necrosis factor alpha (TNFα) to activate NF-κB and increase the expression of Egr-2. The Egr-2 promoter sequence was analyzed for NF-κB binding sites and chromatin immunoprecipitation (ChIP) assays were performed to confirm promoter occupancy in vivo. We discovered that NF-κB specifically binds to an NF-κB consen-sus binding site within the proximal promoter region of Egr-2. Luciferase assay demonstrated that p50 was able to transactivate the Egr-2 promoter in vitro. Small interfering RNA (siRNA)-mediated p50 knockdown corroborated other Egr-2 expression studies. We show for thefirst time a novel link between NF-κB activation and Egr-2 expres-sion with Egr-2 expresexpres-sion directly controlled by the transcriptional activity of NF-κB.
© 2015 Elsevier Inc. All rights reserved.
1. Introduction
Transcription factors such as early growth response (Egr) protein and nuclear factor kappa B (NF-κB) play multiple roles in normal and pathological cellular function (Baldwin, 1996; Bhattacharyya et al., 2011; Ghosh et al., 1998; Gomez-Martin et al., 2010). These roles in-clude immune responses, cancer, inflammatory cascades, brain injury, and memory, to name a few. For example, Egr-2 and Egr-3 are nega-tive regulators involved in T-cell induction (Safford et al., 2005). In addition, deficits in Egr-2 appear to cause conditions such as congen-ital hypomyelination neuropathology (Kamholz et al., 2000). In can-cer cells, elevation of NF-κB activity is often seen. NF-κB has also
been documented as a central player in inflammatory responses. In addition, a growing body of knowledge implicates Egr and NF-κB activity in the nervous system (Albensi and Mattson, 2000; Beckmann and Wilce, 1997; Mattson, 2005; Mattson and Camandola, 2001; O'Donovan et al., 1999). However, how Egr and NF-κB activity might be regulated in some coordinated fashion is unknown.
Transcriptional regulators of the NF-κB family consisting of p65 and p50 subunits promote the expression of over 100 known target genes, many of which are active in the host immune response (Ghosh et al., 1998). In fact, current knowledge of NF-κB target genes in the nervous system relies mostly on genes identified in the immune system (Pahl, 1999). In recent microarray studies, several new tumor necrosis factor (TNF)-responsive genes have been identified in a human glioblastoma cell line (Schwamborn et al., 2003) as well as 17 genes regulated by p50 in the mouse hippocampus upon treatment with trimethyltin, a neurotoxin (Kassed and Herkenham, 2004). In the CA1 region of the ⁎ Corresponding author at: St. Boniface Hospital Research, 351 Tache Ave./R4050,
Winnipeg, MB R2H 2A6, Canada.
E-mail address:[email protected](B.C. Albensi).
http://dx.doi.org/10.1016/j.mcn.2014.12.008
1044-7431/© 2015 Elsevier Inc. All rights reserved.
Contents lists available atScienceDirect
Molecular and Cellular Neuroscience
hippocampus, 38 genes are selectively modulated by contextual long-term memory consolidation and 12 of these genes contain NF-κB c-Rel binding sites in their promoters (Ahn et al., 2008). In addition, our prior work (Albensi and Mattson, 2000) demonstrated that NF-κB plays a role in synaptic plasticity in vitro whereby we stimulated Schaffer collaterals in mouse hippocampal slices at high frequency (100 Hz) and induced long-term potentiation (LTP), an experimental paradigm of memory, which was blocked by administration of NF-κB decoy DNA (an inactivator of NF-κB). Our recent work has also shown that NF-κB p50−/−mice have
deficits in LTP in vitro and impairments in long term memory as measured in the Morris water maze (MWM) (Oikawa et al., 2012).
The literature also suggests that immediate early gene (IEG) families, such as Fos, Jun, and early growth response (Egr)-1 play important roles in brain function (Dragunow, 1996; Miyashita et al., 2008). Egr genes en-code transcription factors and are composed of four members: 1, Egr-2, Egr-3, and Egr-4. In brain tissue, Egr gene family members show a sim-ilar regional profile of basal expression. Distinct basal nuclear expression of Egr-2 is prominent in layers II and III of the neocortex, but sparse in layers IV and VI. In the hippocampus, pyramidal cells of the CA1–CA3 re-gions express Egr-2 protein but little immunostaining is seen in the den-tate gyrus (Herdegen et al., 1993a; Williams et al., 1995). To date, little is known about the functional role of Egr-2 in the adult brain.
The objective of this study was to identify the activity of NF-κB p50-dependent target genes involved in responses to electrical stimulation using a range of cell and molecular biology methods. Analyzing the reg-ulated activity of transcription factors may hold importance for under-standing cell function in general and nerve cell function in particular. Here we show a novel link between the activation of NF-κB and Egr-2 expression in HeLa and neuroblastoma cells and in primary neurons. These data suggest that the expression level of Egr-2 is directly con-trolled by the transcriptional activity of NF-κB.
2. Results
2.1. Egr-2 expression in stimulated NF-κB p50+/+slices
To evaluate the transcriptomes from hippocampal slices we used the Affymetrix GeneChip® microarray system. We found that several genes were upregulated specifically in theta-burst stimulated p50+/+slices
(Table 1). In particular, Egr-2 showed a 2.83 fold increase in p50+/+
stimulated slices, but not in p50−/−stimulated slices. Subsequent ex-periments focused solely on Egr-2 given its prior implication in synaptic plasticity and memory (Cole et al., 1989; Williams et al., 1995; Worley et al., 1993; Yamagata et al., 1994).
2.2. Egr-2 mRNA and protein expression in TNFα-treated cells
Since our microarray data suggested that Egr-2 expression was NF-κB p50-dependent, and because TNFα is a well-characterized activator of NF-κB signaling (Dolga et al., 2008), we examined Egr-2 expression fol-lowing administration of TNFα. To assess the time-dependent effect of TNFα treatment on Egr-2 mRNA expression (Fig. 1A), HeLa S3 cells were exposed to mouse TNFα (5 ng/ml) for 0, 0.5, 1, or 3 h. The HeLa S3 cell line, a human cervical carcinoma cell line that is insensitive to
TNFα apoptotic activity (Sekine et al., 2001), is an ideal cell line for TNFα applications. We also used HeLa cells to test our hypothesis in a non-neuronal cell line. Our results show that the expression of Egr-2 is in-creased approximately 60 fold at 30 min after TNFα treatment, ~150 fold 1 h after TNFα treatment, and ~3 fold 3 h after TNFα treatment (versus control). Increases in Egr-2 expression 30 min and 1 h after TNFα treat-ment were statistically significant (p b 0.05).
To characterize time-dependent Egr-2 mRNA expression in neuronal cells, primary embryonic cortical neurons were treated with mouse re-combinant TNFα (100 ng/ml) for 0, 0.5, 1, 2, or 4 h. The results show (Fig. 1B) that, similar to experiments in HeLa cells, the expression of Egr-2 significantly increases (p b 0.05). In this experiment, increases were seen 30 min after TNFα treatment as compared to control, reaching a maximum at 1 h, and then decreasing at 2 and 4 h after treat-ment. To study the effect of TNFα treatment on EGR-2 protein expres-sion in neuronal cells, cortical neurons were treated with TNFα (100 ng/ml). We found a trend (n = 3; pN 0.05) toward the increased EGR-2 protein expression at 4 h after exposure to mouse recombinant TNFα (100 ng/ml) compared to control (Fig. 1C and D).
2.3. Effects of NF-κB functional blockade on TNFα stimulated Egr-2 expression in cells
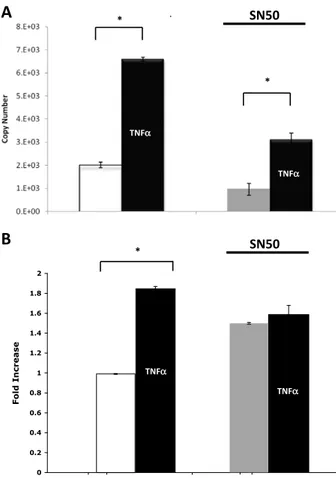
To determine whether the inactivation of NF-κB alters Egr-2 mRNA expression, SN-50 was administered for 1 h to TNFα-treated HeLa cells (Fig. 2A). SN-50 is known to block the translocation of the NF-κB complex to the nucleus (Pannaccione et al., 2005). The results demon-strate that TNFα significantly increases (p b 0.001) Egr-2 mRNA expres-sion when compared to HeLa cells not treated with TNFα. The results further show that the expression of Egr-2 mRNA is significantly de-creased (pb 0.001) in the presence of the NF-κB inhibitor, SN-50, when one compares TNFα stimulated cells with or without SN50 treat-ment. Decreased transcript levels of Egr-2 in TNFα treated cells after treatment with SN-50 are consistent with the NF-κB dependency of TNFα-mediated Egr-2 induction.
To determine if blocking NF-κB activation altered Egr-2 mRNA expres-sion in neurons, the NF-κB blocker SN-50 was administered for 12 h in TNFα treated cortical neurons (Fig. 2B). The data show that TNFα treat-ment alone significantly increases (p b 0.001) Egr-2 mRNA expression when compared to untreated cells. The data also show that the expression of Egr-2 mRNA is significantly decreased (p b 0.05) in the presence of SN-50 when one compares all conditions (SN-SN-50 + TNFα vs. TNFα; SN-50 + TNFα vs. no treatment; SN-50 vs. TNFα; SN-50 vs. no treatment; TNFα vs. no treatment) except with SN-50 + TNFα vs. SN-50 treatment alone there is a non-significant decrease (p N 0.05). All experiments were performed in triplicate. SN50 treatment significantly reduces Egr-2 mRNA expression (pb 0.01) in both TNFα-stimulated cells and in unstimulated cells compared to TNFα treatment alone.
2.4. Several putative binding sites for NF-κB are found in the Egr-2 promoter In order to identify potential NF-κB binding sites, we used a bioinfor-matics approach (http://www.gene-regulation.com). The 3000 bp im-mediate upstream sequence of the Egr-2 gene promoter was searched Table 1
Genes up-regulated in theta-burst stimulated CA1 hippocampal slices from p50+/+
mice, but not p50−/−mice. Genes listed indicates those genes that displayed more than a 2 fold in-crease in expression for the p50+/+group and no difference in expression in the p50−/−group. Each fold change value was calculated by comparing intensities from theta burst stimulated slices with those from unstimulated slices.
Probe set ID Accession number Description Fold change p50+/+
Fold change p50−/−
1427683_at gb:X06746.1 Egr-2 (Krox-20) 2.83 1.15
1459372_at gb:AV348246 Npas4 (neuronal PAS domain protein 4) 2.46 1.07 1437118_at gb:C77542 Usp7 (ubiquitin specific peptidase 7) 2.30 1.07 1437221_at gb:BB702377 Rrm2b (ribonucleotide reductase M2 B) 2.14 1.41 1440801_s_at gb:BB391602 Adrbk2 (adrenergic receptor kinase, beta 2) 2.14 1.15 1450120_at gb:NM_018733.1 Scn1a (sodium channel, voltage-gated, type I, alpha) 2.14 1.15
using P-Match software for possible NF-κB binding sites. Four candidate NF-κB binding sites with N80% homology to the NF-κB consensus se-quence were identified within the promoter region of the Egr-2 gene (Fig. 3).Fig. 3shows the positions of these binding sites compared to the transcription start site (TSS).
2.5. The p50 subunit of NF-κB transactivates an Egr-2 promoter reporter in vitro
To examine whether p50 is able to transactivate the Egr-2 promoter, luciferase assays were performed using a reporter driven by the Egr-2 proximal promoter (Fig. 4). The NF-κB p50 subunit potently activated the promoter compared to the empty vector control (pb 0.05). 2.6. NF-κB subunits occupy the Egr-2 promoter in vivo
To further evaluate and verify Egr-2 transcriptional regulation by NF-κB, specific NF-κB interactions with the Egr-2 promoter were investi-gated in vivo, using the ChIP assay with antibodies against the NF-κB p50 subunit and embryonic mouse forebrain tissues. We used the Egr-2 region IV given that we found that regions I, II, and III were ChIP negative (data not shown). Results (Fig. 5) indicate that p50 binds to the NF-κB binding region IV proximal to the Egr-2 transcription start site (Fig. 3). Given this result, we chose to focus on the Egr-2 proximal promoter region.Fig. 5C
provides an additional control demonstrating the lack of NF-κB p50 sub-unit occupancy of the Egr-2 promoter in p50 knockout tissues in vivo. 2.7. The NF-κB p50 subunit specifically binds to the Egr-2 promoter in vitro
To determine if NF-κB was activated and bound to Egr-2 in our sam-ples, we conducted EMSA experiments. EMSA results showed specific binding of recombinant p50 to Egr-2 promoter region IV oligonucleo-tides containing binding sites in vitro (Fig. 6). Radiolabeled Egr-2 region IV oligonucleotide probes were incubated alone (lanes 1, 7), with re-combinant p50 protein (lanes 2–6), with unlabeled Egr-2 probe (lane 5), with p50 antibodies (lane 3: 5μl antibody, lane 6: 10 μl antibody), and with nonspecific antibodies (lane 4: 1 μg IgG). Gel shifts, denoting specific binding of p50 proteins to Egr-2-DNA, are indicated with open arrowheads. Supershifts with specific p50 antibodies are indicated by a black solid arrowhead. The symbol I designates nonspecific polyclonal antibody (IgG). Ourfindings strongly support specific binding of NF-κB p50 sub-unit: Egr-2 promoter protein–DNA complexes in vitro. 2.8. Small interfering RNA (siRNA)
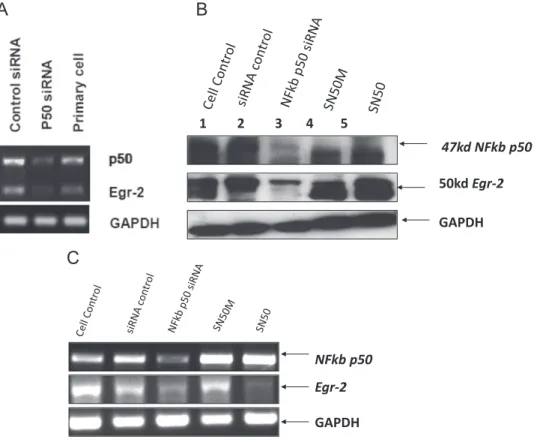
To further confirm the results obtained using NF-κB p50 knockout mice and treatments using the NF-κB blocker SN-50, siRNA knock down experiments (Fig. 7) were also performed in primary neuronal
A
B
C
D
*
*
*
*
Eg r-2 /a ct in*
Fig. 1. Time-dependent Egr-2 expression. (A) Egr-2 mRNA expression levels are significantly increased in TNFα-treated HeLa cells as compared to controls. HeLa cells were treated with mouse recombinant TNFα (5 ng/ml) for the indicated periods of time. Egr-2 mRNA expression levels in TNFα-treated cells were quantified using qRT-PCR and normalized to GAPDH mRNA expression at each time point. Values represent mean ± SEM (n = 4; *pb 0.05). (B) Egr-2 mRNA expression levels in TNFα-treated primary cortical neurons are significantly increased as compared to control. Cortical neurons were treated with mouse recombinant TNFα (100 ng/ml) for the indicated periods of time. mRNA from each well containing 1.25 × 10⁶
neurons was extracted and 1μg of each RNA sample was reverse transcribed to cDNA. Egr-2 mRNA expression levels in TNFα-treated cells were quantified using qRT-PCR and normalized to Gapdh mRNA expression at each time point. Values represent mean ± SEM (n = 3). *pb 0.05 considered to be significant. (C) Quantification of Western blot data (from panel D) shows the ex-pression of EGR-2 protein trends toward an increase at 4 h after exposure to mouse recombinant TNFα (100 ng/ml) compared to control (no TNFα treatment). Graph is represented as the ratio of Egr-2/actin (n = 3). Error bars are ± SD. (D) Raw Western blot data of EGR-2 protein expression in cortical neurons after TNFα treatment.
cultures (Fig. 7A) and replicated in SKNBE(2) neuroblastoma cells (Fig. 7B and C). Using this approach, we found that the reduction of p50 expression by siRNA knockdown resulted in decreased Egr-2 mRNA and protein expression, strongly supporting our other experi-mental data that the NF-κB transcription factor is required for Egr-2 gene expression.
3. Discussion
The transcription factors Egr and NF-κB have been shown to play multiple roles in normal and pathological cellular functions. Under-standing how these factors interact should shed light on how the cell
creates a coordinated response to environmental changes such as seen in immune responses and in synaptic plasticity and cognition. Our data here shows that Egr-2 expression is increased following electrical stimulation in p50+/+mouse hippocampal slices and that Egr-2
expres-sion levels are controlled by the transcriptional activity of the NF-κB transcription factor as measured in HeLa cells and primary neurons.
We previously demonstrated that NF-κB plays a role in synaptic plasticity (Albensi and Mattson, 2000). In addition, our lab (Oikawa et al., 2012) and other labs have shown the involvement of NF-κB p50 subunit activity and expression in studies of synaptic plasticity and mem-ory. In particular, in our study by Oikawa et al. we confirmed that LTP was induced by theta burst stimulation in hippocampal CA1 subfields. In this study, using GeneChip® technology we found that Egr-2 expression was induced by activity-dependent NF-κB activation in p50+/+, but not
in p50−/−hippocampal slices. Moreover, we verified the induction of Egr-2 upon NF-κB activation through the measurement of Egr-2 mRNA and protein expression and by analysis of specific NF-κB binding to the Egr-2 promoter region using non-neuronal and neuronal assay systems. In addition, using siRNA knockdown techniques we observed results con-sistent with those obtained with p50 knockout mice. Collectively, these data provide strong evidence for a novel link between NF-κB activation and Egr-2 expression. These data further suggest that Egr-2 expression level is directly regulated by the transcriptional activity of NF-κB. 3.1. NF-κB activation
NF-κB signaling and activation have been previously described (Baldwin, 1996; Mattson, 2005), which showed that NF-κB activation occurs in the cytosol and is critical for cell functions such as immunity,
* TNFα TNFα *
A
B
0 0.2 0.4 0.6 0.8 1 1.2 1.4 1.6 1.8 2 Fold I n c rease * TNFα TNFαSN50
SN50
Fig. 2. TNFα stimulated Egr-2 expression and effects of SN50 treatment. (A) Egr-2 mRNA ex-pression levels in TNFα-treated HeLa S3 cells in the presence of SN50. HeLa cells were treated with recombinant mouse TNFα (10 ng/ml) and subsequently with SN50 (100 μg/ml, 1 hour duration). Values represent mean ± SEM (n = 3). *pb 0.001 was considered highly signifi-cant (TNFα vs. untreated; SN50 + TNFα vs. SN50). (B) Quantitative real-time PCR for Egr-2 mRNA expression after SN50 treatment in cortical neurons. Cortical neurons were treated with TNFα (100 ng/ml), SN50 (100 μg/ml, 12 hour duration), SN50 (100 μg/ml, 12 hour du-ration), TNFα (100 ng/ml) or just vehicle. All samples were performed in triplicate as inde-pendent repeats and were normalized to Gapdh. Error bars represent ± SEMs. *pb 0.001 (TNFα vs. untreated).
TSS
Fig. 3. Schematic representation of the transcription factor binding sites in the Egr-2 promoter. Three kilobases of upstream sequence of the Egr-2 gene promoter were searched for putative NF-κB binding sites. Transcription Start Site (TSS) represents the first nucleotide (+1) of the Egr-2 gene.
0 pGL3 Egr-2 2 4 6 8 10 Luci fer ase act ivi ty ( fol d) Empty vector p50
*
#Fig. 4. Regulation of the Egr-2 proximal promoter by the NF-κB p50 sub-unit in vitro. COS7 cells were transiently transfected with a reporter vector comprised of the 1.3 kb proximal promoter of Egr-2 cloned into pGL3 Basic, or with empty pGL3 Basic. Cells also received p50 expression vector, or an empty vector control. Luciferase expression was measured 24 h later. All samples were performed in triplicate and were normalized to pGL3 Basic plus empty expression vector. Error bars represent mean ± SEM. *pb 0.05 vs. pGL3 Basic plus empty vector; #pb 0.05 vs. Egr-2 reporter plus empty vector.
inflammation, and brain function. Multiple stimuli including inflamma-tory cytokines (e.g., TNF), infection, injury, stress, and second messen-gers such as calcium can induce activation of NF-κB (Pahl, 1999). Once activated, NF-κB dimers move from the cytoplasm to the nucleus and occupy NF-κB binding sites in the promoter or enhancer regions of tar-get genes to regulate their expression. It is generally accepted that homodimers of p50 or the p50/p52 heterodimer function as transcrip-tional repressors, whereas the remaining combinations of NF-κB dimers (e.g., p65/p50) contain at least one monomer of p65, c-Rel, or RelB and function as activators (Mayeux et al., 1998). Studies have also shown that the p65/p50 heterodimer binds to DNA much more cooperatively than homodimer combinations (Mayeux et al., 1998). Some target
genes of NF-κB that play a role in neurodegenerative processes have been identified (Mattson and Camandola, 2001; Mattson et al., 2000); however, gene targets of NF-κB in synaptic plasticity and memory re-main largely unknown. In this study, wefirst examined potential target genes that were up- or down-regulated in theta burst stimulated CA1 hippocampal slices from p50+/+and p50−/−mice. We found that
sever-al genes, including Egr-2, were up-regulated only in p50+/+samples.
Our GeneChip® data showed a ~3 fold increase in Egr-2 expression fol-lowing theta burst stimulation, suggesting that EGR-2 is involved in synaptic plasticity. Thisfinding is consistent with other reports that found EGR-2 to be involved in the stabilization of LTP (Williams et al., 1995). Several other genes were upregulated (ranged from 2.1 to 2.5 fold change) in p50+/+samples as well, which included, Npas4, Usp7,
Rrm2b, Adrbk2, and Scn1a (Table 1). 3.2. NF-κB binding and Egr-2 expression
To confirm the upregulation of Egr-2 gene expression upon NF-κB activation, we measured Egr-2 mRNA and protein levels in several cell assays. Our results show an increase in the expression of Egr-2 one-half hour after TNFα treatment in HeLa cells that reached a maximum at 1 h. mRNA isolated from TNFα-treated primary cortical neurons were also used in qRT-PCR experiments to measure the mouse Egr-2 ex-pression level changes in TNFα-treated samples versus control. These results confirmed that, similar to HeLa cells, Egr-2 expression increases soon after TNFα treatment. Collectively, these results are consistent with the fact that Egr-2 is an IEG and has a rapid and transient induction pattern (Single et al., 2000).
We also tested for specific interactions of NF-κB with the Egr-2 pro-moter using ChIP assays and embryonic forebrain tissues. These exper-iments demonstrate that NF-κB occupies the NF-κB binding region closest to the transcription start site of the Egr-2 promoter. To our knowl-edge, no previous studies have shown that NF-κB binds to this region in vivo. Importantly, prior studies (Mayeux et al., 1998) have shown that unlike most transcription factors, NF-κB dimers do not use any sec-ondary structures for contacting DNA, so it is likely that NF-κB binds to the Egr-2 promoter without the participation of additional complexes. 3.3. Egr-2 in cellular function
What role might Egr-2 play in the cell? In general, Egr proteins have been shown to play roles in cellular growth and differentiation. In human studies, mutations involving EGR-2 have been found in patients with inherited peripheral neuropathy (Bellone et al., 1999). Further-more, in mouse models, Egr-2 has been shown to play a role in the reg-ulation of peripheral nerve myelination (Topilko et al., 1994).Nickols et al. (2003)also showed that NF-κB plays a role in the myelination pro-cess in Schwann cells where Egr-2 expression, up-regulated early in the myelination process, may be a critical regulator of genes encoding the proteins mediating myelination (Jessen and Mirsky, 2002). The induc-tion of Egr-2 mRNA or protein has also been demonstrated following seizure activity (Bhat et al., 1992) and focal cerebral ischemia (An et al., 1992). Other studies show that EGR-2 protein can also exist in both cyto-plasm and nucleus (Herdegen et al., 1993b,1993c). However, the zinc fin-gers of the EGR-2 protein each contain a nuclear localization signal (Matheny et al., 1994) and this DNA sequence might be involved in nucle-ar localization of the EGR-2 proteins (Beckmann and Wilce, 1997).
Several studies (Cole et al., 1989; Williams et al., 1995; Worley et al., 1993; Yamagata et al., 1994) have been conducted that have implicated Egr-2 in multiple brain functions, including developmental processes, immunity, apoptosis, and cognition. In particular, Worley et al. found that Egr-2 expression increased in hippocampal neurons after LTP in-duction (Worley et al., 1993). Other recent studies have also shown an interaction between CREB (cAMP responsive element binding protein) binding protein (CBP) and EGR-2 protein (Yoo and Lee, 2004). In addi-tion,Lemberger et al. (2008)showed that in mouse forebrain neurons,
A
M DNAB
C
Fig. 5. ChIP assay demonstrating p50 interaction with the NF-κB binding region in vivo. (A) Chromatin derived from embryonic mouse forebrain was sonicated to fragments of 300–400 bp in size and run on a 1% agarose gel. Ethidium bromide staining of a rep-resentative gel is shown. (B) DNA representing the most proximal NF-κB binding site to the transcription start site of the Egr-2 promoter was amplified by PCR from geno-mic DNA fragments that were precipitated by a p50 antibody. Input shows the non-immunoprecipitated genomic DNA. (C) Control experiment showing Egr-2 promoter binding in NF-κB p50+/+subunit versus NF-κB p50 knockout tissue. Abbreviations: M = DNA marker; DNA = sonicated DNA.
1
2 3 4 5
6
7
Labeled probe
Unlabeled probe
p50 protein
Antibody
--
--
I
--
-
-+
-+
+
+
+
+
+
+
+
-+
+
+
+
+
+
Supershifted band:αP50
Specific p50/EGR2 band
Free DNA
Fig. 6. p50 protein specifically binds to a regulatory element within the Egr-2 promoter in vitro EMSA demonstrates binding of recombinant p50 to Egr-2 promoter region IV oli-gonucleotides containing a putative NF-κB binding site in vitro. Radiolabeled Egr-2 region IV oligonucleotide probes were incubated alone (lanes 1, 7), with recombinant p50 pro-tein (lanes 2–6), with unlabeled Egr-2 probe (lane 5), with p50 antibodies (lane 3: 5 μl of antibody, lane 6: 10μl of antibody), and with nonspecific antibody (lane 4: 1 μg of poly-clonal IgG). Gel shifts, denoting specific binding of p50 proteins to Egr-2-DNA, are indicat-ed with a blue arrow. Supershifts with specific p50 antibodies are indicatindicat-ed by black arrows. I: nonspecific polyclonal antibody (IgG).
CREB1 and Crem (cAMP responsive element modulator) proteins are necessary for the expression of the Egr-2 gene. Still other studies report protein–protein interactions between NF-κB p50 and p65 subunits and CREB binding protein (Cao et al., 2006; Sung et al., 2004; Zhong et al., 2002) suggesting a complex interplay among these transcription factors.
3.4. Limitations and future directions
Overall, our data provide strong evidence for a link between NF-κB activation and subsequent Egr-2 expression, which is important for un-derstanding patterns of gene expression in neuronal and non neuronal cells.
We found that SN-50 treatment significantly reduces Egr-2 mRNA expression (pb 0.01) in both TNFα-stimulated cells and in unstimulated cells compared to TNFα treatment alone. Similar results were obtained in SKNBE(2) neuroblastoma cells when comparing SN50 (Calbiochem 481480) and SN50M, an inactive SN50 compound (Calbiochem 481486) (Fig. 7B, C). However, a few questions remain concerning the patterns of expression in specific cases. For example, inFig. 2B, the application of SN-50 (NF-κB inactivator) in TNFα-treated cortical neurons ap-peared to have no effect on Egr-2 mRNA expression; however, SN-50 application in TNFα-treated non-neuronal HeLa cells (Fig. 2A) and SKNBE(2) neuroblastoma cells (Fig. 7B) did show a significant decrease in Egr-2 mRNA expression. Although we cannot explain this finding in the treated primary neurons, one possibility is that this is due to a concentration-related effect. Also, if one compares thisfinding to Fig. 5B where NF-κB p50 subunit activity was suppressed by siRNA, Egr-2 mRNA expression levels were relatively lower than in untreated cortical neurons (Fig. 2), which implies that NF-κB activity was more efficiently
blocked by siRNA than SN50, which might be expected. It is also worth commenting on the specificity of SN50 (Boothby, 2001). SN50 has been used widely as an inhibitor of NF-κB. However, a few years ago, it was found that SN50 is not necessarily specific for p50 or for NF-kB transcrip-tion factors in general. Data shows that SN50 also blocks the nuclear in-duction of the transcription factors STAT, AP-1 and NFAT (Boothby, 2001). Since these other factors were not directly assessed in this study, it is unlikely that this non-specificity of SN50 has major importance in this study.
Although we found a direct relationship between NF-κB activation and Egr-2 expression, we acknowledge the possibility that the entire network of protein–protein interactions in this context could be much more complex. Future studies to address this question could use mice that overexpress Egr-2 to determine whether Egr-2 overexpression res-cues selective deficits observed in p50−/−mice. Furthermore, it should
be noted that TNFα is known to have other activation pathways as well, which could have influenced our findings in unknown ways. Final-ly, since p50 homodimers have been shown to repress transcription, we cannot rule out the possibility that in the absence of p50 one might see an elevated NF-κB-mediated transcriptional activity.
Furthermore, in this study we did not examine Egr-1, Egr-3, or Egr-4. Therefore, future studies would be warranted that also evaluate Egr-1, Egr-3, and Egr-4, in parallel with Egr-2, which may lend insight into po-tential differences among these isoforms and whether NF-κB activity is linked to the expression of these other isoforms.
4. Conclusions
In conclusion, our data show that Egr-2 expression is increased fol-lowing theta burst stimulation in p50+/+mouse hippocampal slices
A
50kd Egr-2
47kd NFkb p50
1 2 3 4 5
GAPDH
B
GAPDH
Egr-2
NFkb p50
C
Fig. 7. Representative NF-κB p50 subunit knock-down experiment using siRNA. (A) An siRNA pool targeting p50 was transfected into primary mouse embryonic cortical neurons. Neurons were incubated for 2 days and their RNAs were extracted, reverse transcribed to cDNA and subjected to qRT-PCR to assess the expression of Egr-2 after NF-κB p50 subunit knock-down. Results show a dramatic decrease in Egr-2 expression level in neurons transfected with p50 siRNA consistent with the role of NF-κB in the induction of the Egr-2 gene expression (n = 3). (B, C) siRNA targeting of p50 was compared to treatment for 1 h using SN50 (100μg/ml), inactive SN50M (50 μg/ml), and compounds in human SKNBE(2) neuroblastoma cells in vitro. NF-κB p50, Egr-2 and GAPDH levels were compared at the mRNA (B) and protein levels (C).
and that Egr-2 expression levels are directly controlled by the transcrip-tional activity of the NF-κB transcription factor as measured in non-neuronal and non-neuronal cells. Further studies are warranted that investi-gate the functions of NF-κB and EGR-2 in the whole animal and that determine the temporal dynamics of the gene regulation process in-volving these factors.
5. Experimental methods 5.1. Animal model
Two month-old homozygous NF-κB p50 knockout mice (B6;129P2-Nfkb1tm1Bal/J) (p50−/−) and the controls (B6129PF2/J) (p50+/+) were
purchased from The Jackson Laboratory (Bar Harbor, ME, USA). Targeted disruption of the NF-κB p50 subunit has previously been described in de-tail (Sha et al., 1995). These mice are incapable of producing the p50 pro-tein. Mice homozygous for the Nfkb1tm1Baltargeted mutation are viable.
Homozygous mutant mice exhibit ineffective responses to infection, de-fective B cell responses, and abnormalities in basal and specific antibody production. Timed pregnant wild-type CD1 mice were purchased from Central Animal Care at the University of Manitoba. Mice were maintained on a 12 hour light/12 hour dark cycle at 22 °C in the pathogen-free an-imal facility at the St. Boniface Research Centre. Mice were tested at 9–10 weeks of age. The University of Manitoba Animal Care Committee approved all procedures, which conformed to guidelines published by the Canadian Council on Animal Care.
5.2. Preservation of brain slices for microarray analysis
We previously showed (Oikawa et al., 2012) that mice with NF-κB p50−/−subunit deletion had deficits in late LTP in vitro and impairments in retention in the Morris water maze as compared to p50+/+mice. To
evaluate brain samples using Affymetrix Mouse DNA microarrays (Affymetrix, Santa Clara, CA, USA), we used hippocampal slices from this prior study (Oikawa et al., 2012) that were stimulated with LTP-inducing protocols (theta burst stimulation). For every hippocampal slice that was used in the present study, LTP was confirmed. These hip-pocampal slices (which included CA1, CA3 and dentate gyrus subfields) were then preserved for microarray analysis according to the manufacturer's instructions; that is, 3 h after stimulation, hippocampal slices that were stimulated versus unstimulated control slices from both p50-/−and p50+/+mice were stored in RNAlater (4 °C)
immedi-ately following stimulation for analysis. Changes in gene expression as-sociated with LTP responses at three or more hours have been previously demonstrated by several labs (Abraham et al., 1991; Alberini, 2009; Barco et al., 2005; Kandel, 2001).
5.3. Affymetrix mouse DNA microarrays
GeneChip Mouse Genome 430 2.0 microarrays (Affymetrix, Santa Clara, CA, USA) were used for gene expression analysis. Total RNA was pooled fromfive hippocampus slices (either stimulated or unstimulated, from p50+/+or p50−/−mice) and prepared for microarray hybridization
as per the manufacturer's instructions. Results were collected and analyzed using GeneChip Operating System software. Fold change values were calculated by comparing intensities from stimulated and unstimulated slices using robust multi-array averaging. 5.4. Cell culture and maintenance
HeLa S3 cells were cultured in Dulbecco's Modified Eagle's Me-dium (DMEM, Gibco) supplemented with 10% fetal bovine serum (FBS, Hyclone) and 1% penicillin–streptomycin solution (Gibco). SKNBE(2) human neuroblastoma cells were routinely grown in DMEM-F12 medium containing 1% penicillin–streptomycin solution and 10% heat inactivated fetal calf serum. Cells were maintained as monolayer
cultures at 37 °C in a humidified incubator with 5% CO2. Experiments
were performed on days 7–8. To culture primary cortical neurons, fetal brains of timed-pregnant CD-1 mice at gestational days 16–18 were re-moved and cerebral cortices were dissociated by gentle pipetting. Dissoci-ated tissue wasfiltered using a 40 μm cell strainer (BD Falcon), washed and suspended in Neurobasal medium (GIBCO) with B27 supplement (GIBCO), 5% FBS (Hyclone), 1.2 mM glutamine and 5 mM HEPES. Cells were plated at 5 × 10⁵cells/cm2on poly-D-lysine-coated plates (NUNC,
VWR). Twenty four hours after plating, 2 mM Cytosine Arabinoside (Ara-c, Sigma) was added to inhibit non-neuronal cell growth. Subse-quently, medium was completely replaced after another 24 h with Neurobasal/B27. Cortical neurons were cultured 7–9 days in vitro before treating with SN50 or TNFα.
5.5. RNA isolation and quantitative real-time PCR (qRT-PCR)
HeLa S3 cells or primary cortical neurons were treated with 5–100 ng/ml of TNFα at different time points. RNA was isolated from HeLa S3 cells with AllPrep DNA/RNA/Protein Mini Kit (QIAGEN) and TRIZOL was used for RNA extraction from primary cortical neurons as per the manufacturer's instructions. One microgram total RNA was re-verse transcribed to cDNA using the Bio-Rad iScriptTM cDNA Synthesis kit. The cDNA mixture was subjected to real-time PCR with the Biorad iQ SYBR Green Supermix and the iCycler iQ® real-time system using the primers listed in Supplemental Table 1. The qRT-PCR running protocols for mouse Egr-2 and Gapdh are listed in Supplemental Table 2. Melt curve analyses verified the formation of single desired PCR products. For quantification of Egr-2 gene expression changes, the Pfaffl method (Real-Time PCR Applications Guide from Bio-Rad) was used to calculate relative fold changes normalized against the Gapdh gene.
5.6. Protein extraction
Proteins of TNFα-treated HeLa cells were extracted using Allprep/ DNA/RNA Mini kit (QIAGEN) following the manufacturer's instructions. For the TNFα-treated primary cortical neurons, after collecting the media, 60μl lysis buffer containing 50 mM Tris–HCl pH 6.8, 2% SDS and 1 × Protease Inhibitor (PI) Cocktail (Roche) was added to each well. Using a cell scraper, neurons were transferred to a 1.5 ml tube on ice. To lyse the cells, all samples were frozen in liquid nitrogen and thawed four times. To remove intact cells and membrane, the samples were centrifuged in an Eppendorf 5810 R centrifuge at a maximum speed for 15 min at 4 °C. The supernatant from the cell lysate containing proteins was transferred to new tubes.
5.7. Western blotting
NuPAGE® Bis-Tris, 4–12% Mini Gels (1 mm thickness — Invitrogen) were used for electrophoresis of proteins. Aliquots of proteins (10–80 μg) were prepared and separated on NuPAGE gels at a constant voltage (100 V) for 120 min following the instructions of the NuPAGE® technical guide. Proteins separated on NuPAGE gels were transferred onto PVDF membrane using a Trans-Blot SD Semi-Dry Electrophoretic Transfer Cell (Bio-Rad) following the manufacturer's instructions. Trans-fer was carried out at a constant voltage (20 V) for 35 min at room tem-perature. After blocking with 5% skim-milk in TBS solution containing 0.2% Tween-20 (TBST) overnight at 4 °C, the membrane was incubated with a rabbit anti-EGR-2 polyclonal antibody (Covance Research Prod-ucts, Inc., San Diego, CA, USA), diluted in TBST containing 1% skim milk, overnight with gentle shaking at 4 °C. The membrane was washed 4 times in 30 min (15 min followed by 3 × 5 min) with TBST containing 1% skim milk. After the last wash, the blot was incubated with a secondary antibody, goat anti-rabbit IgG conjugated with horseradish peroxidase (HRP) from Santa Cruz, diluted 1:6500 in TBST at room temperature for 1 h. The membrane was then washed with TBST only. The chemilumines-cence signal was visualized using the ECL-Plus detection system (GE
Health Care Bio-Sciences) following the manufacturer's instruction. Den-sitometry was performed on all blots. Standard curves were generated to ensure that the density of the bands fell within the linear range. The spec-ificity of the Egr-2 antibody has been previously described (Dillon et al., 2007).
5.8. Analysis ofκB-binding sites within the Egr-2 promoter
The mouse Egr-2 upstream sequence information was obtained from the Ensemble website (http://www.ensembl.org/, gene ID: ENSMUSG00000037868). Using the P-Match program (http://www. gene-regulation.com/), 3000 bp of the immediate upstream sequence of the Egr-2 gene promoter was searched for putative NF-κB binding sites. Primers targeting these regions were designed using Primer 3 software and used for chromatin immunoprecipitation (ChIP) analysis. Moreover, the primer sequences were analyzed using the BLAST-like alignment tool (http://genome.ucsc.edu/) which confirmed that these oligonucleo-tide sequences contained 100% homology to sequences within the Egr-2 gene without homology to any other known sequences in the mouse genome.
5.9. Chromatin immunoprecipitation assay
The chromatin immunoprecipitation (ChIP) assay was performed as previously described (Zhou et al., 2004) with the whole forebrains of CD-1 mice (E16–E18) using a p50 primary antibody (Santa Cruz) to im-munoprecipitate protein–DNA complexes. The DNA was extracted using a Qiaquick PCR purification kit (QIAGEN) following the manufacturer's instructions. Approximately 10% of the precipitated DNA was used for PCR detection using the primers targeting the four NF-κB binding sites on the promoter region of the Egr-2 gene listed in Supplemental Table 3, 10% of 5 M Betaine and the running protocol listed in Supplemental Table 4. Sample without added antibody was used as a negative control and non-immunoprecipitated genomic DNA (input) was used as a positive control for each condition tested. ChIP was also performed using p50−/−forebrain tissues as an additional neg-ative control. Bands obtained from PCR following ChIP were isolated, subcloned and sequenced to confirm target gene identity.
5.10. Electrophoretic mobility shift assay (EMSA)
We used the Egr-2 promoter region IV (the NF-κB binding region most proximal to the transcription start site identified by ChIP as a pu-tative NF-κB binding site in vivo). This region was subcloned into the pCR™4-TOPO® vector for sequencing (Invitrogen). Following EcoRI restriction enzyme digestion, the plasmid was run on a 2% agarose gel and purified (Qiagen gel purification kit). The double stranded DNA frag-ment (0.5μg) was radiolabeled with 2 μl32
P-dATP (Perkin Elmer) using 2 units of Klenow large fragment of DNA Polymerase I (Invitrogen) at 37 °C for 30 min. The labeled probe was purified with illustraTM MicroSpin TM G-25 Columns (GE Healthcare UK). The gel shift binding re-action mixture (total volume 20μl) contained 1 μg recombinant protein (NF-κB subunit (residues 35–381) untagged, human recombinant, BIOMOL International), 1μg poly(dI-dc), 0.2 μl PMSF (100 mM), and 0.2μl 1% BSA in 1× EMSA binding buffer (Promega). Excess unlabeled probe was added for“cold competition” and for supershift experiments, a specific polyclonal anti-p50 antibody (NF-κB p105/p50, Epitomics) or a nonspecific antibody for control was used. The binding reaction was in-cubated for 30 min at room temperature, and then labeled probe (100,000 CPM) was added to the reaction and incubated for another 20 min. The whole reaction (20μl) was run on a 4% acrylamide/ bisacrylamide gel with 0.5× TBE buffer at 300 V and the gel was stored at−80 °C. Kodak film (X-Omat™-LS) was used for autoradiography.
5.11. Luciferase reporter assay
The Egr-2 promoter luciferase construct containing 1.3 kb sequence upstream of the transcription start site cloned into pGL3 Basic has been described previously and was obtained from Addgene (Kao et al., 2009). COS7 cells in 6-well plates (8 × 10⁵cells/well) were grown to 90%
confluence in high-glucose DMEM supplemented with 10% FBS, 1%L-glutamine and 1% penicillin–streptomycin at 37 °C. Medium was removed and cells were washed with 1× PBS, then 1.5 ml Opti-Mem was added to each well followed by a 30 minute incubation. Cells were transfected with Lipofectamine (Invitrogen) plus 500 ng plasmid and 5 ng pRL Renilla luciferase transfection control plasmid as per manufacturer's directions. Cells were maintained at 37 °C for 24 h, medi-um removed and lysed for the luciferase assay using the Dual-Luciferase Reporter System (Promega) according to the manufacturer's directions. Each sample was assayed in duplicate, and three individual experiments were carried out. Results were normalized to pRL expression.
5.12. Small interfering RNA (siRNA)
Timed-pregnant CD-1 mice were used to generate primary cortical neuron cultures (see above). Neocortex was dissected and collected in Hank's Balanced Salt solution (HBSS). The tissue was incubated for 10 min at room temperature with 0.05 mg/ml trypsin (GIBCO). The cells were pelleted by centrifugation (1200 rpm, 5 min), then resuspended and gently triturated to a single cell suspension in HBSS containing 100μg/ml DNase I (Sigma). The cell suspension was transferred to a tube containing Neurobasal medium with B-27 (GIBCO) and penicillin– streptomycin–fungizone (100 U/ml) (Life Technologies). Cells were counted and 3×10⁵cells were plated per well (poly-D-lysine coated 24
well plates (Cel-lines Associates, Inc.)) and cultured at 37 °C with 5% CO2. NF-κB p50 siRNA (sc-29408, Santa Cruz Biotech) and control siRNA
(sc-37007) were obtained. The siRNAs consist of pools of three tofive spe-cific 19–25 nucleotide siRNAs designed to knock-down NF-κB p50 gene expression. Transient transfection using siRNA transfection reagents (sc-45064) was carried out on culture day 2 in vitro. Ten picomoles (1μl) of siRNA was added per well on 24 well plates following the siRNA transfec-tion protocol. Forty-eight hours after transfectransfec-tion, cells were washed with cold PBS twice and subjected to qRT-PCR. The SKNBE(2) cells were seeded onto 60 mm2dishes ~70% confluent on the second day and siRNA control
(sc-36869) or NFκb p50 siRNA(h) (sc-29407) was applied. Transient transfection using Lipofectamine 2000 reagent was carried out on culture day 2. One hundred picomoles (100μl) of siRNA was added to each plate following the siRNA transfection protocol.
5.13. Statistical analyses
Some analyses were performed by the Student's t-test (two-sided) with a 95% confidence interval. LTP experiments were analyzed using mixed model ANOVA and post hoc special effect t test when appropriate. SPSS Software v13 (SPSS Inc., Chicago, IL, USA) was used for most anal-yses. pb 0.05 was considered significant in all cases. For Western blot-ting data, band intensities were quantified using ImageJ software (http://rsbweb.nih.gov/ij/) and data are expressed as S.E.M. or S.D. as in-dicated in each case.
Supplementary data to this article can be found online athttp://dx. doi.org/10.1016/j.mcn.2014.12.008.
Acknowledgments
This work was funded in part by the National Sciences and Engineer-ing Research Council (to B.C.A.), Manitoba Health Research Council (to B.C.A. and K.O. in separate grants), Manitoba Institute of Child Health (to D.D.E.), Foundation Fighting Blindness— Canada (to D.D.E.), Everett Endowment (to B.C.A.), Alzheimer's Society (to B.C.A.), University of Manitoba (to B.C.A.), Canadian Foundation for Innovation (to B.C.A.
and M.P.C. in separate grants), and St. Boniface General Hospital Re-search Foundation (to B.C.A.). B.C.A. is a ReRe-search Affiliate at the Univer-sity of Manitoba's Centre on Aging and holds the Honourable Douglas Everett, Patricia Everett and the Royal Canadian Properties Endowment Fund Chair. We thank Drs. P. Fernyhough, W. Snow, and F. Parkinson for a critical reading of the manuscript. We also thank Dr. Michael J. Bernstein for his help with the statistical analyses. Finally we thank Viktoriya Mozolevska for her technical assistance with the molecular assays.
References
Abraham, W.C., Dragunow, M., Tate, W.P., 1991.The role of immediate early genes in the stabilization of long-term potentiation. Mol. Neurobiol. 5, 297–314.
Ahn, H.J., Levenson, J.M., Lubin, F.D., Liou, H.C., Sweatt, J.D., 2008.c-Rel, an NF-kappaB fam-ily transcription factor, is required for hippocampal long-term synaptic plasticity and memory formation. Learn. Mem. 15, 539–549.
Albensi, B.C., Mattson, M.P., 2000.Evidence for the involvement of TNF and NF-kappaB in hippocampal synaptic plasticity. Synapse 35, 151–159.
Alberini, C.M., 2009.Transcription factors in long-term memory and synaptic plasticity. Physiol. Rev. 89, 121–145.
An, G., Lin, T.N., Liu, J.S., Hsu, C.Y., 1992.Induction of Krox-20 expression after focal cere-bral ischemia. Biochem. Biophys. Res. Commun. 188, 1104–1110.
Baldwin Jr., A.S., 1996.The NF-kappa B and I kappa B proteins: new discoveries and in-sights. Annu. Rev. Immunol. 14, 649–683.
Barco, A., Patterson, S., Alarcon, J.M., Gromova, P., Mata-Roig, M., Morozov, A., Kandel, E.R., 2005.Gene expression profiling of facilitated L-LTP in VP16-CREB mice reveals that BDNF is critical for the maintenance of LTP and its synaptic capture. Neuron 48, 123–137.
Beckmann, A.M., Wilce, P.A., 1997.Egr transcription factors in the nervous system. Neurochem. Int. 31, 477–510 (discussion 517–476).
Bellone, E., Di Maria, E., Soriani, S., Varese, A., Doria, L.L., Ajmar, F., Mandich, P., 1999.A novel mutation (D305V) in the early growth response 2 gene is associated with se-vere Charcot–Marie–Tooth type 1 disease. Hum. Mutat. 14, 353–354.
Bhat, R.V., Worley, P.F., Cole, A.J., Baraban, J.M., 1992.Activation of the zincfinger encoding gene krox-20 in adult rat brain: comparison with zif268. Brain Res. Mol. Brain Res. 13, 263–266.
Bhattacharyya, S., Wu, M., Fang, F., Tourtellotte, W., Feghali-Bostwick, C., Varga, J., 2011.
Early growth response transcription factors: key mediators offibrosis and novel tar-gets for anti-fibrotic therapy. Matrix Biol. 30, 235–242.
Boothby, M., 2001.Specificity of sn50 for NF-kappa B? Nat. Immunol. 2, 471–472.
Cao, S., Zhang, X., Edwards, J.P., Mosser, D.M., 2006.NF-kappaB1 (p50) homodimers dif-ferentially regulate pro- and anti-inflammatory cytokines in macrophages. J. Biol. Chem. 281, 26041–26050.
Cole, A.J., Saffen, D.W., Baraban, J.M., Worley, P.F., 1989.Rapid increase of an immediate early gene messenger RNA in hippocampal neurons by synaptic NMDA receptor acti-vation. Nature 340, 474–476.
Dillon, R.L., Brown, S.T., Ling, C., Shioda, T., Muller, W.J., 2007.An EGR2/CITED1 transcrip-tion factor complex and the 14-3-3sigma tumor suppressor are involved in regulating ErbB2 expression in a transgenic-mouse model of human breast cancer. Mol. Cell. Biol. 27, 8648–8657.
Dolga, A.M., Granic, I., Blank, T., Knaus, H.G., Spiess, J., Luiten, P.G., Eisel, U.L., Nijholt, I.M., 2008.TNF-alpha-mediates neuroprotection against glutamate-induced excitotoxicity via NF-kappaB-dependent up-regulation of K2.2 channels. J. Neurochem. 107, 1158–1167.
Dragunow, M., 1996.A role for immediate-early transcription factors in learning and memory. Behav. Genet. 26, 293–299.
Ghosh, S., May, M.J., Kopp, E.B., 1998.NF-kappa B and Rel proteins: evolutionarily con-served mediators of immune responses. Annu. Rev. Immunol. 16, 225–260.
Gomez-Martin, D., Diaz-Zamudio, M., Galindo-Campos, M., Alcocer-Varela, J., 2010.Early growth response transcription factors and the modulation of immune response: im-plications towards autoimmunity. Autoimmun. Rev. 9, 454–458.
Herdegen, T., Brecht, S., Mayer, B., Leah, J., Kummer, W., Bravo, R., Zimmermann, M., 1993a.Long-lasting expression of JUN and KROX transcription factors and nitric oxide synthase in intrinsic neurons of the rat brain following axotomy. J. Neurosci. 13, 4130–4145.
Herdegen, T., Kiessling, M., Bele, S., Bravo, R., Zimmermann, M., Gass, P., 1993b.The KROX-20 transcription factor in the rat central and peripheral nervous systems: novel ex-pression pattern of an immediate early gene-encoded protein. Neuroscience 57, 41–52.
Herdegen, T., Sandkuhler, J., Gass, P., Kiessling, M., Bravo, R., Zimmermann, M., 1993c.JUN, FOS, KROX, and CREB transcription factor proteins in the rat cortex: basal expression and induction by spreading depression and epileptic seizures. J. Comp. Neurol. 333, 271–288.
Jessen, K.R., Mirsky, R., 2002.Signals that determine Schwann cell identity. J. Anat. 200, 367–376.
Kamholz, J., Menichella, D., Jani, A., Garbern, J., Lewis, R.A., Krajewski, K.M., Lilien, J., Scherer, S.S., Shy, M.E., 2000.Charcot–Marie–Tooth disease type 1: molecular patho-genesis to gene therapy. Brain 123 (Pt 2), 222–233.
Kandel, E.R., 2001.The molecular biology of memory storage: a dialogue between genes and synapses. Science 294, 1030–1038.
Kao, S.C., Wu, H., Xie, J., Chang, C.P., Ranish, J.A., Graef, I.A., Crabtree, G.R., 2009.Calcineurin/ NFAT signaling is required for neuregulin-regulated Schwann cell differentiation. Sci-ence 323, 651–654.
Kassed, C.A., Herkenham, M., 2004.NF-kappaB p50-deficient mice show reduced anxiety-like behaviors in tests of exploratory drive and anxiety. Behav. Brain Res. 154, 577–584.
Lemberger, T., Parkitna, J.R., Chai, M., Schutz, G., Engblom, D., 2008.CREB has a context-dependent role in activity-regulated transcription and maintains neuronal cholester-ol homeostasis. FASEB J. 22, 2872–2879.
Matheny, C., Day, M.L., Milbrandt, J., 1994.The nuclear localization signal of NGFI-A is lo-cated within the zincfinger DNA binding domain. J. Biol. Chem. 269, 8176–8181.
Mattson, M.P., 2005.NF-kappaB in the survival and plasticity of neurons. Neurochem. Res. 30, 883–893.
Mattson, M.P., Camandola, S., 2001.NF-kappaB in neuronal plasticity and neurodegener-ative disorders. J. Clin. Invest. 107, 247–254.
Mattson, M.P., Culmsee, C., Yu, Z., Camandola, S., 2000.Roles of nuclear factor kappaB in neuronal survival and plasticity. J. Neurochem. 74, 443–456.
Mayeux, R., Saunders, A.M., Shea, S., Mirra, S., Evans, D., Roses, A.D., Hyman, B.T., Crain, B., Tang, M.X., Phelps, C.H., 1998.Utility of the apolipoprotein E genotype in the diagno-sis of Alzheimer's disease. Alzheimer's Disease Centers Consortium on Apolipoprotein E and Alzheimer's Disease. N. Engl. J. Med. 338, 506–511.
Miyashita, T., Kubik, S., Lewandowski, G., Guzowski, J.F., 2008.Networks of neurons, net-works of genes: an integrated view of memory consolidation. Neurobiol. Learn. Mem. 89, 269–284.
Nickols, J.C., Valentine, W., Kanwal, S., Carter, B.D., 2003.Activation of the transcription factor NF-kappaB in Schwann cells is required for peripheral myelin formation. Nat. Neurosci. 6, 161–167.
O'Donovan, K.J., Tourtellotte, W.G., Millbrandt, J., Baraban, J.M., 1999.The EGR family of transcription-regulatory factors: progress at the interface of molecular and systems neuroscience. Trends Neurosci. 22, 167–173.
Oikawa, K., Odero, G.L., Platt, E., Neuendorff, M., Hatherell, A., Bernstein, M.J., Albensi, B.C., 2012.NF-kappa B p50 subunit knockout impairs late LTP and alters long term mem-ory in the mouse hippocampus. BMC Neurosci. 13, 45.
Pahl, H.L., 1999.Activators and target genes of Rel/NF-kappaB transcription factors. Onco-gene 18, 6853–6866.
Pannaccione, A., Secondo, A., Scorziello, A., Cali, G., Taglialatela, M., Annunziato, L., 2005.
Nuclear factor-kappaB activation by reactive oxygen species mediates voltage-gated K+ current enhancement by neurotoxic beta-amyloid peptides in nerve growth factor-differentiated PC-12 cells and hippocampal neurones. J. Neurochem. 94, 572–586.
Safford, M., Collins, S., Lutz, M.A., Allen, A., Huang, C.T., Kowalski, J., Blackford, A., Horton, M.R., Drake, C., Schwartz, R.H., Powell, J.D., 2005.Egr-2 and Egr-3 are negative regu-lators of T cell activation. Nat. Immunol. 6, 472–480.
Schwamborn, J., Lindecke, A., Elvers, M., Horejschi, V., Kerick, M., Rafigh, M., Pfeiffer, J., Prullage, M., Kaltschmidt, B., Kaltschmidt, C., 2003.Microarray analysis of tumor ne-crosis factor alpha induced gene expression in U373 human glioblastoma cells. BMC Genomics 4, 46.
Sekine, K., Fujii, H., Abe, F., Nishikawa, K., 2001.Augmentation of death ligand-induced apoptosis by aminopeptidase inhibitors in human solid tumor cell lines. Int. J. Cancer 94, 485–491.
Sha, W.C., Liou, H.C., Tuomanen, E.I., Baltimore, D., 1995.Targeted disruption of the p50 subunit of NF-kappa B leads to multifocal defects in immune responses. Cell 80, 321–330.
Single, F.N., Rozov, A., Burnashev, N., Zimmermann, F., Hanley, D.F., Forrest, D., Curran, T., Jensen, V., Hvalby, O., Sprengel, R., Seeburg, P.H., 2000.Dysfunctions in mice by NMDA receptor point mutations NR1(N598Q) and NR1(N598R). J. Neurosci. 20, 2558–2566.
Sung, S., Yang, H., Uryu, K., Lee, E.B., Zhao, L., Shineman, D., Trojanowski, J.Q., Lee, V.M., Pratico, D., 2004.Modulation of nuclear factor-kappa B activity by indomethacin in-fluences A beta levels but not A beta precursor protein metabolism in a model of Alzheimer's disease. Am. J. Pathol. 165, 2197–2206.
Topilko, P., Schneider-Maunoury, S., Levi, G., Baron-Van Evercooren, A., Chennoufi, A.B., Seitanidou, T., Babinet, C., Charnay, P., 1994.Krox-20 controls myelination in the pe-ripheral nervous system. Nature 371, 796–799.
Williams, J., Dragunow, M., Lawlor, P., Mason, S., Abraham, W.C., Leah, J., Bravo, R., Demmer, J., Tate, W., 1995.Krox20 may play a key role in the stabilization of long-term potentiation. Brain Res. Mol. Brain Res. 28, 87–93.
Worley, P.F., Bhat, R.V., Baraban, J.M., Erickson, C.A., McNaughton, B.L., Barnes, C.A., 1993.
Thresholds for synaptic activation of transcription factors in hippocampus: correla-tion with long-term enhancement. J. Neurosci. 13, 4776–4786.
Yamagata, K., Sanders, L.K., Kaufmann, W.E., Yee, W., Barnes, C.A., Nathans, D., Worley, P.F., 1994.rheb, a growth factor- and synaptic activity-regulated gene, encodes a novel Ras-related protein. J. Biol. Chem. 269, 16333–16339.
Yoo, Y.G., Lee, M.O., 2004.Hepatitis B virus X protein induces expression of Fas ligand gene through enhancing transcriptional activity of early growth response factor. J. Biol. Chem. 279, 36242–36249.
Zhong, H., May, M.J., Jimi, E., Ghosh, S., 2002.The phosphorylation status of nuclear NF-kappa B determines its association with CBP/p300 or HDAC-1. Mol. Cell 9, 625–636.
Zhou, Q.P., Le, T.N., Qiu, X., Spencer, V., de Melo, J., Du, G., Plews, M., Fonseca, M., Sun, J.M., Davie, J.R., Eisenstat, D.D., 2004.Identification of a direct Dlx homeodomain target in the developing mouse forebrain and retina by optimization of chromatin immuno-precipitation. Nucleic Acids Res. 32, 884–892.