PERSPECTIVE
Perspective: Essential Study Quality Descriptors
for Data from Nutritional Epidemiologic Research
Chen Yang,
1Mariona Pinart,
5Patrick Kolsteren,
1John Van Camp,
1Nathalie De Cock,
1Katharina Nimptsch,
5Tobias Pischon,
5–8Eamon Laird,
9Giuditta Perozzi,
10Raffaella Canali,
10Axelle Hoge,
11Marta Stelmach-Mardas,
12,13Lars Ove Dragsted,
14Stéphanie Maria Palombi,
14Irina Dobre,
14Jildau Bouwman,
15Peter Clarys,
16Fabio Minervini,
17Maria De Angelis,
17Marco Gobbetti,
18Jean Tafforeau,
19Oscar Coltell,
20,21Dolores Corella,
21,22Hendrik De Ruyck,
23Janette Walton,
24Laura Kehoe,
24Christophe Matthys,
25Bernard De Baets,
2Guy De Tré,
3Antoon Bronselaer,
3Angela Rivellese,
26Rosalba Giacco,
27Rosario Lombardo,
28Sofian De Clercq,
29Niels Hulstaert,
4,30and Carl Lachat
1Departments of1Food Safety and Food Quality,2Mathematical Modelling, Statistics and Bioinformatic,3Telecommunications and Information Processing, and4Biochemistry, Ghent University, Ghent, Belgium;5Molecular Epidemiology Research Group, Max Delbrück Centre for Molecular Medicine, Berlin, Germany;6Charité– Berlin University of Medicine, Berlin, Germany;7Max Delbrück Center for Molecular Medicine and Berlin Institute of Health, Berlin, Germany;8German Centre for Cardiovascular Research, partner site, Berlin, Germany;9Vitamin Research Group, Trinity College Dublin, Dublin, Ireland;10Food and Nutrition Research Centre, Rome, Italy;11Department of Public Health, University of Liège, Liège, Belgium;12Department of Epidemiology, German Institute of Human Nutrition Potsdam-Rehbruecke, Nuthetal, Germany;13Department of Pe-diatric Gastroenterology and Metabolic Diseases, Poznan University of Medical Sciences, Poznan, Poland;14Department of Nutrition, Exercise and Sports, University of Copenhagen, Frederiksberg, Denmark;15Netherlands Organisation for Applied Scientific Research, Zeist, Netherlands;16Vrije Universiteit Brussels, Brussels, Belgium;17Department of Soil, Plant and Food Science, University of Bari Aldo Moro, Bari, Italy;18Faculty of Science and Technology, Free University of Bozen-Bolzano, Bolzano, Italy;19Department of Public Health and Surveillance, Scientific Institute of Public Health, Brussels, Belgium;20Department of Computer Languages and Systems, University Jaume I, Castellón, Spain;21Department of Preventive Medicine and Public Health, University of Valencia, Valencia, Spain;22Biomedical Research Centre in Physiopathology of Obesity and Nutrition, Institute of Health Carlos III, Madrid, Spain;23Flanders research institute for agriculture, fisheries and food, Technology and Food Science Unit, Food Safety and Product Innovation, Melle, Belgium;24School of Food and Nutritional Sciences, University College Cork, Cork, Ireland;25KU Leuven, Clinical and Experimental Endocrinology and University Hospitals Leuven/KU Leuven, Department of Endocrinology, Campus Gasthuis-berg, Leuven, Belgium;26Department of Clinical Medicine and Surgery, School of Medicine, University Federico II, Naples, Italy;27Institute of Food Sciences of National Research Council, Avellino, Italy;28The Microsoft Research, University of Trento Centre for Computational and Systems Biology, Trento, Italy;29Department of Biochemistry, Ghent University, Faculty of Medicine and Health Sciences, Ghent, Belgium; and30VIB-UGent Center for Medical Biotechnology, VIB, Ghent, Belgium
ABSTRACT
Pooled analysis of secondary data increases the power of research and enables scientific discovery in nutritional epidemiology. Information on study characteristics that determine data quality is needed to enable correct reuse and interpretation of data. This study aims to define essential quality characteristics for data from observational studies in nutrition. First, a literature review was performed to get an insight on existing instruments that assess the quality of cohort, case-control, and cross-sectional studies and dietary measurement. Second, 2 face-to-face workshops were organized to determine the study characteristics that affect data quality. Third, consensus on the data descriptors and controlled vocabulary was obtained. From 4884 papers retrieved, 26 relevant instruments, containing 164 characteristics for study design and 93 characteristics for measurements, were selected. The workshop and consensus process resulted in 10 descriptors allocated to“study design” and 22 to“measurement” domains. Data descriptors were organized as an ordinal scale of items to facilitate the identification, storage, and querying of nutrition data. Further integration of an Ontology for Nutrition Studies will facilitate interoperability of data repositories. Adv Nutr 2017;8:639–51.
Keywords: data quality, observational study, dietary assessment, nutritional epidemiology, data interoperability
Introduction
Poor diets are among the leading causes of disease and
inade-quate health worldwide (1). Observational studies are an
essen-tial source of information in nutritional epidemiology. They
assess the relation between diet and health outcomes (2, 3)
and allow for the inference of
findings from mechanistic
and laboratory studies in free-living populations (4).
Obser-vational studies need to be adequately powered for this
pur-pose, which requires substantial funding, resources, participant
involvement, and time. Reuse of secondary data can increase
by guest on September 17, 2017
advances.nutrition.org
the return on investments from observational studies. Apart
from providing additional power, the analysis of secondary
data can allow for the assessment of the robustness of
findings
across study settings, study design, and participants (5). The
Global Burden of Disease (1), the Non-Communicable Disease
Risk Factor Collaboration (6), and the Global Dietary Database
(7) demonstrate how the reanalysis of secondary data can
gen-erate new insights into diet, nutrition, and human health.
Sharing research data has gained considerable
momen-tum. Despite this, however, low accessibility (i.e., dif
ficulties
in
finding appropriate secondary datasets) and validation of
data (i.e., challenges in identifying the characteristics of
available data sets as well as their collection method) remain
key concerns for secondary data analysis in epidemiology
(8). A key requirement to enable effective use and machine
readability of research data is the use of appropriate data
de-scriptors (9). To date, however, no consensus has been
reached on the required metadata for nutritional studies.
Knowledge of data quality is key to interpreting
findings of
secondary analyses. It enables the performance of uncertainty
analysis of risk factors for disease (10) and is of interest for
comparing data sets and their contribution to overall
findings
in pooled analysis (11, 12). Quality tools exist for
epidemio-logic research (13) but are designed to appraise the quality of
the study
findings, rather than the study data, and are
influ-enced by the reporting quality of the study or judgement of
external assessors. Research data, however, can be (re)used
for different research questions. Because secondary data
anal-ysis may demand specific data quality, a clear description of
data characteristics by data providers is needed.
The present report provides guidelines to facilitate the
collection of a uniform set of information (i.e., data
descrip-tors) from nutritional epidemiologic studies. This
informa-tion would be helpful to describe the quality of available data
from observational nutrition studies in the event researchers
attempt to pool data and perform secondary analyses.
This study was performed in the context of ENPADASI
(European Nutritional Phenotype Assessment and Data
Sharing Initiative), a collaborative effort of 16
multidisci-plinary consortia from 50 research centers in 9 countries.
ENPADASI aims to enable sharing and reuse of existing
nu-tritional data through a nunu-tritional data infrastructure called
DASH-IN (Data Sharing In Nutrition) (14).
Methods
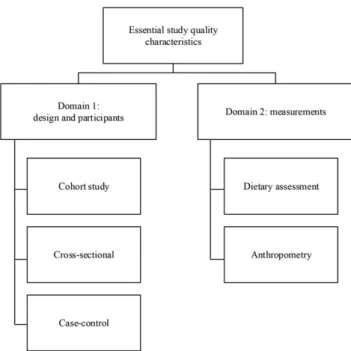
This study was organized in 3 consecutive steps. First, a systematic literature review was performed to identify existing tools that assess quality of observational studies. Second, face-to-face and online meetings with the relevant ENPADASI partners were organized to determine the descriptors and their structure. Third, we built consensus on the descriptors. A controlled vocabulary was developed to avoid ambiguity and facilitate understanding of descriptors and wording. Step 1: literature review
To guide the literature review, a scoping study was conducted to identify avail-able study quality appraisal tools and reviews on the topic. The websites of the Scottish Intercollegiate Guidelines Network initiative (15) and Cochrane Handbook (16) were searched, and a citation analysis of systematic reviews on the topic (13, 17–19) and reporting guidelines (20) were performed. The scoping study confirmed the lack of existing tools for describing the quality characteristics of study data from nutritional epidemiology. Existing instruments and standards in biosciences, such as the “investigation-study-assay” framework (21), provided further input to organize the data qual-ity descriptors into 2 domains: study design and measurements (Figure 1). Such modular structure enables combination of descriptors from the 2 do-mains. Following recommendations for the reporting of observational studies in epidemiology (20) and nutritional epidemiology (22), we focused on the main study designs for observational studies: cross-sectional, case-control, and cohort studies. In this first instance, the measurements domain was limited to dietary assessment and anthropometric status.
The scoping review led to the development of a search syntax ( Supple-mental Table 1) to review available literature systematically. Because nutri-tional epidemiology uses general epidemiologic methods (23), we searched and reviewed all tools for epidemiologic studies. The consortium discussed the procedures for the data extraction and data extraction templates were before the search and are available on request.
Perspective articles allow authors to take a position on a topic of current major importance or controversy in the field of nutrition. As such, these articles could include statements based on author opinions or point of view. Opinions expressed in Perspective articles are those of the author and are not attributable to the funder(s) or the sponsor(s) or the publisher, Editor, or Editorial Board of Advances in Nutrition. Individuals with different positions of the topic of a Perspective are invited to submit their comments in the form of a Perspectives article or in a Letter to the Editor.
ENPADASI (European Nutritional Phenotype Assessment and Data Sharing Initiative) is part of the Joint Programming Initiative “a healthy diet for a healthy life” and is funded by national funding agencies in 9 European countries. The work in this manuscript is funded by the FWO Research Foundation–Flanders, grant number G0D4815N and the German Ministry of Food and Agriculture through the Federal Office for Agriculture and Food, grant number 2814ERA01F. CY is funded by a scholarship from the Chinese Scholarship Council. CL received funding from Bioversity International for the work on standards for dietary assessment. LOD received funding from The Innovation Fond Denmark (grant number 4203-00001B). This is a free access article, distributed under terms (http://www.nutrition.org/publications/guidelines-and-policies/license/) that permit unrestricted noncommercial use, distribution, and reproduction in any medium, provided the original work is properly cited.
Author disclosures: CY, MP, PK, JVC, NDC, KN, TP, EL, GP, RC, AH, MS-M, LOD, SMP, ID, JB, PC, FM, MDA, MG, JT, OC, DC, HDR, JW, LK, CM, BDB, GDT, AB, AR, RG, RL, SDC, NH, and CL, no conflicts of interest.
Supplemental Table 1 is available from the “Online Supporting Material” link in the online posting of the article and from the same link in the online table of contents at http://advances.nutrition.org.
Address correspondence to CL (e-mail: [email protected]).
Abbreviations used: DASH-IN, Data Sharing In Nutrition; ENPADASI, European Nutritional Phenotype Assessment and Data Sharing Initiative; ONS, Ontology for Nutritional Studies.
FIGURE 1
The domain-based structure of the essential study
quality characteristics.
by guest on September 17, 2017
advances.nutrition.org
MEDLINE (entry: PubMed) was searched twice by MP to retrieve rele-vant tools. Afirst search was performed on 1 July 2015, with the limit for publication dates set between 1 January 2000 and 31 December 2015. Be-cause the search syntax did not retrieve some essential tools, a second search was performed on 8 July 2015 using broader search syntax (Supplemental
Table 1) with higher sensitivity and extended publication dates from 1 January 1990 to 31 December 2015.
Studies were included if they met the following criteria: studies that de-veloped instruments with items assessing 1) the methodological quality of $1 of the following study designs: cohort and panel studies, case-control
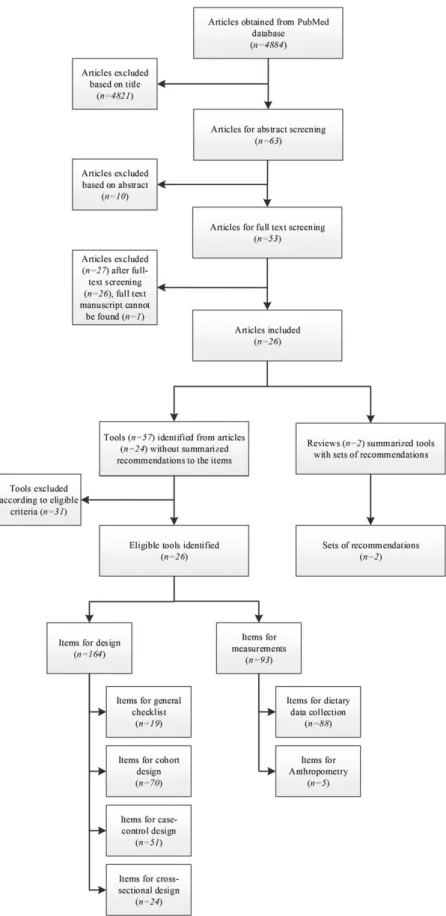
FIGURE 2
Flowchart of study screening and
extraction of items for essential study quality
characteristics.
by guest on September 17, 2017
advances.nutrition.org
studies, and cross-sectional studies and analyses, transversal studies, and prevalence studies, and 2) the methodological quality of $1 of the measurements done in nutritional epidemiology: diet, food intake or anthropometry. Items were excluded if they assessed 1) statistical analysis or assessment of study results and 2) the reporting quality of studies.
Two reviewers screened titles (CL and MP) and abstracts (CY and MP) independently. Before data extraction, the independent reviewers (CL and MP) screened the full text of the selected studies. Reference lists from the in-cluded studies were manually searched to identify additional eligible studies. Disagreements were resolved by discussion until consensus was achieved. In case of doubt, we used a conservative approach and included the studies.
A pre-established data extraction form was used to summarize relevant studies, instruments, and quality appraisal items of the included studies. Step 2: selection and modification of items
On 18 March 2016, a face-to-face meeting with ENPADASI researchers in-volved in the development of standards and identification of data sets for joint data analysis was organized in Brussels to define essential descriptors. At the inception of the meeting, the guiding principles for item selection and modi fi-cation were determined. The principles used were 1) independent nature of the descriptors (i.e., every descriptor must capture a distinct data quality parame-ter), 2) conciseness (i.e., the number of descriptors of the tool should be as concise as possible), 3) objectiveness (i.e., those specifying the data characteristics should be able to provide an objective assessment of how the study was done without value judgment), and 4) generalizability (i.e., the de-scriptors can be applied to other nutrition study data systems).
Because the discussions were based on existing items from the literature study, the tool made use of existing knowledge as much as possible. The se-lection and modification of specific descriptors was conducted in small working groups of 3–5 people that were moderated by the lead researchers
of this report (CY, MP, and CL). After the face-to-face meeting, the working groups finalized a draft of the study descriptors through conference calls and e-mail communications.
Step 3: consensus building
A conference call was organized on 10 May 2016 to reach consensus within the working group that participated in the face-to-face meeting on the short-listed descriptors and labels. Absent researchers were informed about the tool and were encouraged to provide comments electronically.
Final consensus in the ENPADASI consortium was obtained during the annual meeting held on 5 September 2016 in Copenhagen, Denmark. Dur-ing thefirst week of August, all attendees received the relevant material for the discussion, which included the draft proposed by the working group with a short description of the objective of the study descriptors. Then, stan-dardized definitions of identified terms in quality descriptors were retrieved from the Medical Subject Headings database of US National Library of Med-icine (24) and A Dictionary of Epidemiology (Sixth Edition) (25). In case terms were not found, manuscripts were used to describe the terms (26–30). We achieved consensus on the structure, the scope, and description of the included descriptors and how they should be implemented in the DASH-IN database. Unresolved disagreements were further discussed thereafter through electronic communications or conference calls, or both, untilfinal consensus was reached.
Results
Step 1: literature review
We identi
fied 4884 citations after removal of duplicates from
the 2 literature searches, of which 24 studies (containing 26
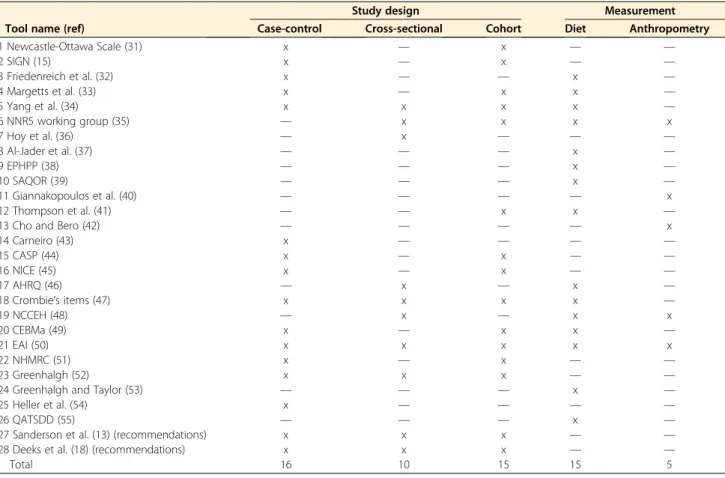
TABLE 1 Eligible study quality appraisal tools identified from the literature review1
Tool name (ref)
Study design Measurement
Case-control Cross-sectional Cohort Diet Anthropometry
1 Newcastle-Ottawa Scale (31) x — x — — 2 SIGN (15) x — x — — 3 Friedenreich et al. (32) x — — x — 4 Margetts et al. (33) x — x x — 5 Yang et al. (34) x x x x — 6 NNR5 working group (35) — x x x x 7 Hoy et al. (36) — x — — — 8 Al-Jader et al. (37) — — — x — 9 EPHPP (38) — — — x — 10 SAQOR (39) — — — x — 11 Giannakopoulos et al. (40) — — — — x 12 Thompson et al. (41) — — x x —
13 Cho and Bero (42) — — — — x
14 Carneiro (43) x — — — — 15 CASP (44) x — x — — 16 NICE (45) x — x — — 17 AHRQ (46) — x — x — 18 Crombie’s items (47) x x x x — 19 NCCEH (48) — x — x x 20 CEBMa (49) x — x x — 21 EAI (50) x x x x x 22 NHMRC (51) x — x — — 23 Greenhalgh (52) x x x — —
24 Greenhalgh and Taylor (53) — — — x —
25 Heller et al. (54) x — — — —
26 QATSDD (55) — — — x —
27 Sanderson et al. (13) (recommendations) x x x — —
28 Deeks et al. (18) (recommendations) x x x — —
Total 16 10 15 15 5
1
The“x” means the tool includes quality appraisal item(s) for that design. AHRQ, Agency for Healthcare Research and Quality; CASP, Critical Appraisal Skills Programme; CEBMa, Center for Evidence-Based Management; EAI, epidemiological appraisal instrument; EPHPP, Effective Public Health Practice Project; NCCEH, National Collaborating Centre for Environmental Health; NHMRC, National Health and Medical Research Council; NICE, National Institute for Health and Care Excellence; NNR, Nordic Nutrition Recommendations; QATSDD, Quality Assessment Tool for Studies with Diverse Designs; ref, reference; SAQOR, Systematic Assessment of Quality in Observational Research; SIGN, Scottish Intercollegiate Guidelines Network.
by guest on September 17, 2017
advances.nutrition.org
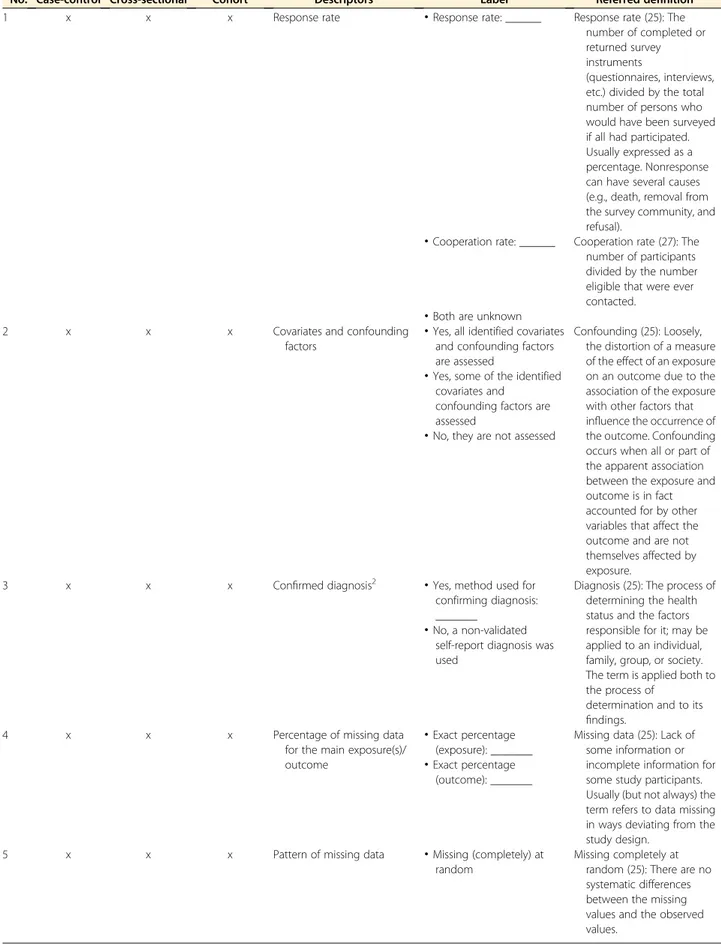
TABLE 2 Items for quality assessment of study design1
No. Case-control Cross-sectional Cohort Descriptors Label Referred definition
1 x x x Response rate
·
Response rate: ______ Response rate (25): Thenumber of completed or returned survey instruments
(questionnaires, interviews, etc.) divided by the total number of persons who would have been surveyed if all had participated. Usually expressed as a percentage. Nonresponse can have several causes (e.g., death, removal from the survey community, and refusal).
·
Cooperation rate: ______ Cooperation rate (27): The number of participants divided by the number eligible that were ever contacted.·
Both are unknown2 x x x Covariates and confounding
factors
·
Yes, all identified covariates and confounding factors are assessed
Confounding (25): Loosely, the distortion of a measure of the effect of an exposure on an outcome due to the association of the exposure with other factors that influence the occurrence of the outcome. Confounding occurs when all or part of the apparent association between the exposure and outcome is in fact accounted for by other variables that affect the outcome and are not themselves affected by exposure.
·
Yes, some of the identified covariates andconfounding factors are assessed
·
No, they are not assessed3 x x x Confirmed diagnosis2
·
Yes, method used forconfirming diagnosis: _______
Diagnosis (25): The process of determining the health status and the factors responsible for it; may be applied to an individual, family, group, or society. The term is applied both to the process of
determination and to its findings.
·
No, a non-validated self-report diagnosis was used4 x x x Percentage of missing data
for the main exposure(s)/ outcome
·
Exact percentage (exposure): _______Missing data (25): Lack of some information or incomplete information for some study participants. Usually (but not always) the term refers to data missing in ways deviating from the study design.
·
Exact percentage (outcome): _______5 x x x Pattern of missing data
·
Missing (completely) atrandom
Missing completely at random (25): There are no systematic differences between the missing values and the observed values.
(Continued)
by guest on September 17, 2017
advances.nutrition.org
TABLE 2 (Continued )
No. Case-control Cross-sectional Cohort Descriptors Label Referred definition Missing at random (25): Any
systematic difference between the missing values and the observed values can be explained by differences in observed data.
·
Missing, not at random Missing, not at random (25): Even after the observed data are taken into account, systematic differences remain between the missing values and the observed values.·
Unknown6 — x x Random selection
·
Yes Selection bias (25): Bias in theestimated association or effect of an exposure on an outcome that arises from the procedures used to select individuals into the study or the analysis. When the selection involves conditioning on a factor that is affected by the exposure or a cause of the exposure, and also affected by the outcome or a cause of the outcome, selection bias can arise even in the absence of a causal effect of exposure on outcome.
·
No 7 x (if applicable) x x (if applicable)Representative sample
·
Yes: representative sample for the study populationRepresentative sample (25): A sample that to a large extent resembles a population of interest.
·
No, a nonrepresentativesample was taken
8 x — x Incidence
·
Yes, cases reported asincident cases
Incidence (25): The number of instances of illness commencing, or of persons falling ill, during a given period in a specified population. More generally, the number of new health-related events in a defined population within a specified period of time. It may be measured as a frequency count, a rate, or a proportion.
·
No, cases not reported as incident cases9 x — — Controls
·
Controls are from the samepopulation as cases
Controls (25): Subjects with whom a comparison is made. In a case-control study, controls are often defined as noncases or by other postexposure events, making them especially susceptible to selection bias. Selection of appropriate controls is crucial to the validity of epidemiologic and clinical studies.
·
Controls are from similar population as cases·
Controls are from anotherpopulation or national controls (Continued) by guest on September 17, 2017 advances.nutrition.org Downloaded from
tools) were
finally selected for inclusion and data extraction
(
Figure 2
). Recommendations from 2 relevant systematic
re-views were also considered (13, 18). Although both systematic
reviews have much broader scopes compared with the present
study, their recommendations were considered key to guide the
selection of descriptors.
From the 26 selected tools and 2 sets of recommendations,
16, 10, and 15 contained relevant items for design of
case-control, cross-sectional, and cohort studies, respectively, and
15 and 5 tools contained items to assess quality of measuring
food intake and anthropometry, respectively (
Table 1
).
Step 2: selection and modification of descriptors
All of the 18 invited ENPADASI partners participated in the
face-to-face meeting. During the workshop, 164 items derived
from the 26 eligible tools were considered for assessment of
the study design and 93 items for measurement assessment.
After discussion, the working groups proposed a draft tool
with 10 quality descriptors for study design and 22 quality
de-scriptors for nutritional measurements (16 for dietary intake
and 6 for anthropometry).
Step 3: consensus building
There were 35 attendees at the ENPADASI consortium meeting.
The meeting participants agreed to organize the descriptors as
an ordinal scale without an overall score. Meanwhile, controlled
vocabularies were added to most of the descriptors in
Tables 2
–
4
to ensure a common understanding and correct
interpreta-tion for each of them.
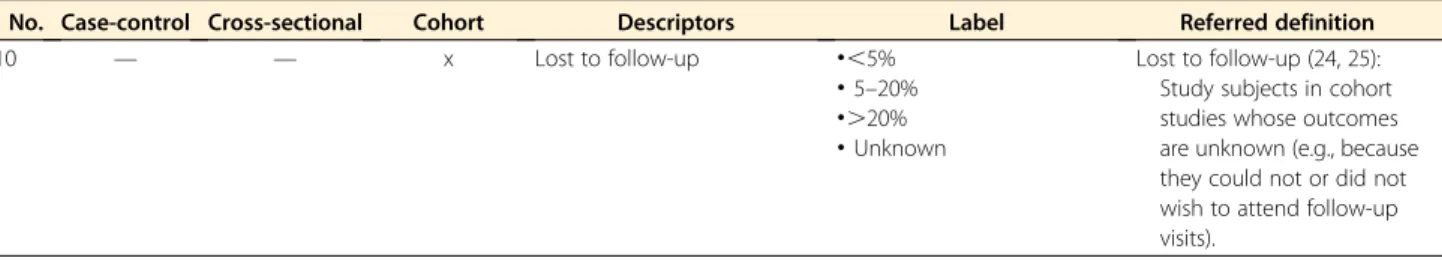
Table 2
contains the 10 descriptors related to study design.
Among the 10 descriptors, 6 descriptors are applicable for all
the 3 included study designs. For the remainder, the descriptor
“random selection” applies to cohort and cross-sectional study
designs. The descriptor for
“incidence” applies to case-control
and cohort study designs. The descriptors for
“controls” and
“loss to follow-up” were identified for case-control and cohort
study designs, respectively. Among the 6 general descriptors,
de-scriptor
“representative sample” might not be applicable for
case-control studies or cohort studies in some cases. Three types
of information should be provided: 1) exact response and
coop-eration rate, 2) diagnosis method, and 3) missing data rate.
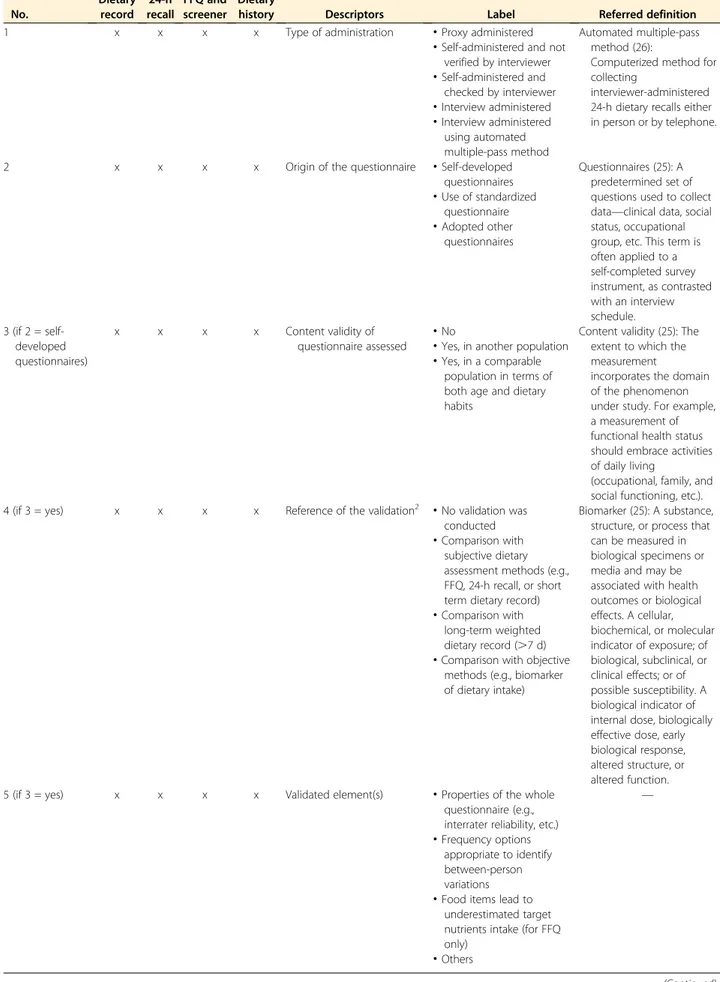
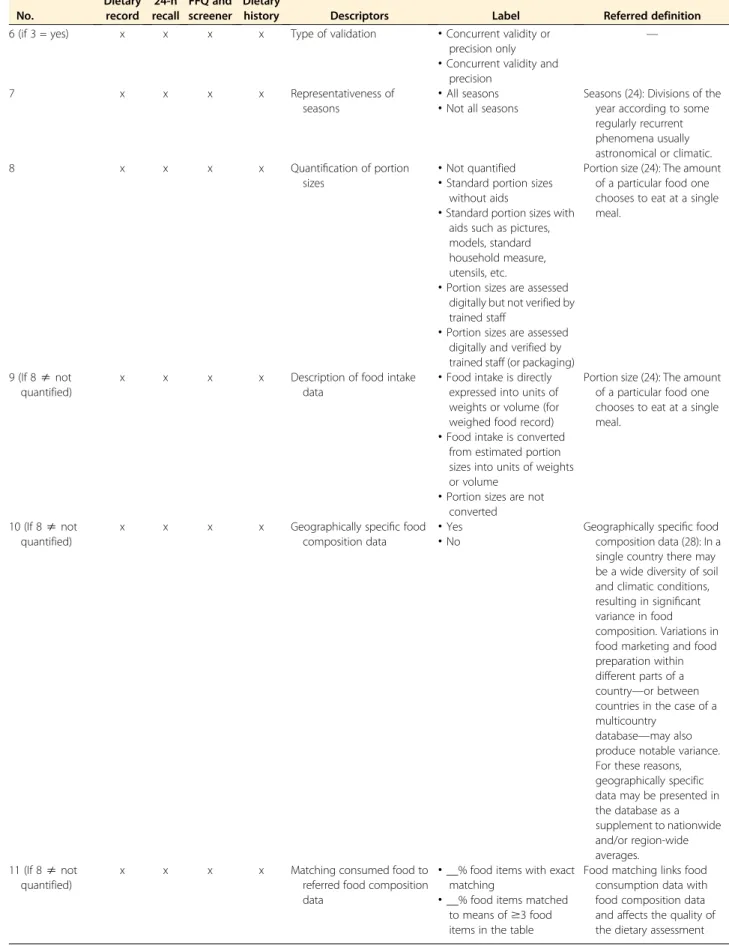
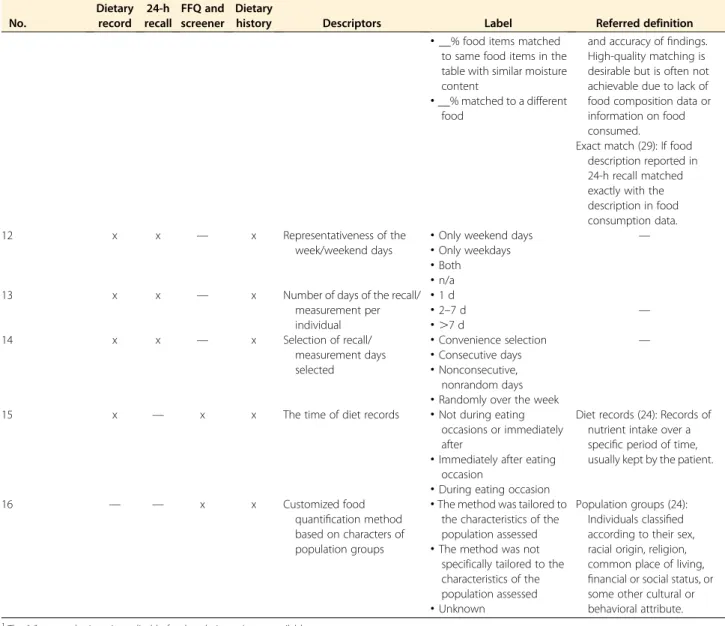
Table 3
summarizes the 16 quality descriptors for dietary
assessment by the most popular data collection instruments
(i.e., dietary record, 24-h recall, FFQ and screener, and
die-tary history). These descriptors include 2 items for recall
method (descriptor
“type of administration” and “the time
of diet records”), 5 for data collection instruments
(descrip-tor
“origin of the questionnaire,” “content validity of
ques-tionnaire assessed,
” “reference of the validation,” “validated
elements
” and “type of validation”), 4 for representativeness
of days (descriptor
“representativeness of seasons,”
“repre-sentativeness of the week/weekend days,
” “number of days
of the recall/measurement per individual,
” and “selection
of recall/measurement days selected
”), and 5 for the food
quantification method (descriptor
“quantification of
por-tion sizes,
” “description of food intake data,” “geographically
specific food composition data,
” “matching consumed food
to referred food composition data.
” and “customized food
quantification method based on characters of population
groups”). To date, traditional methods are combined with
digital technologies, such as 1) dietary assessment through
personal digital assistant technologies, mobile phone–based
technologies, camera and tape recorder–based technologies
developed from dietary record, 2) interactive
computer-based technologies, web-computer-based developed from 24-h dietary
recall, and 3) interactive computer- and web-based
technol-ogies developed from the FFQ (56). The data quality
de-scriptors can be equally used for these combined methods.
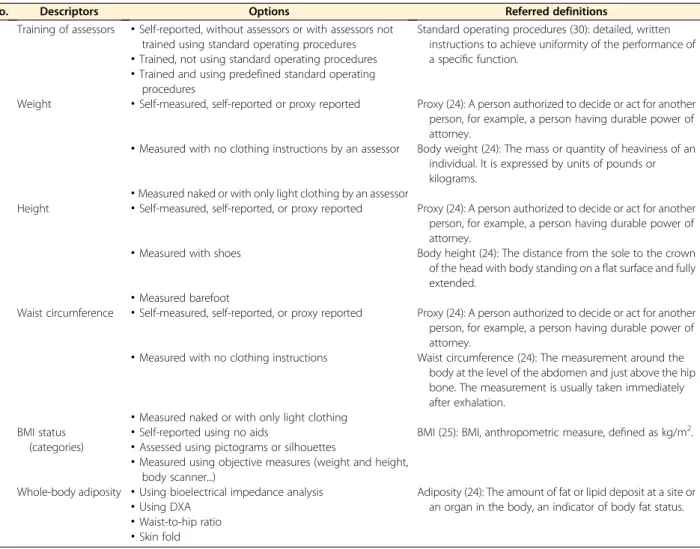
Table 4
summarizes 6 descriptors for anthropometry
measurement, which focused on training of assessors, weight,
height, waist circumference, BMI status (categories), and
whole-body adiposity.
Discussion
Here, we propose essential quality descriptors for study data
from nutritional epidemiology. Unlike existing quality
as-sessment tools for studies, the present set of quality
descrip-tors provides essential items to be added as metadata of
nutrition research data. Apart from having a different scope,
the present set of descriptors has several differences
com-pared with existing tools.
First, existing quality appraisal tools assign quality scores
to studies. Unlike these tools, the present set of descriptors
describes essential quality aspects of the study without
ranking or scoring studies and their data. Because data
qual-ity requirements depend on the purpose of the research, an
absolute assessment of study quality was considered
unreal-istic. As such, data quality might be judged acceptable for
one speci
fic purpose but not for another. Instead of assessing
absolute quality, the present tool ensures that studies are
ad-equately characterized with descriptors relevant for assessing
TABLE 2 (Continued )
No. Case-control Cross-sectional Cohort Descriptors Label Referred definition
10 — — x Lost to follow-up
·
,5% Lost to follow-up (24, 25):Study subjects in cohort studies whose outcomes are unknown (e.g., because they could not or did not wish to attend follow-up visits).
·
5–20%·
.20%·
Unknown1
The“x” means the tool includes quality appraisal item(s) for that design. 2
For a data set with.1 outcome, it is better to provide an answer for each of the outcomes.
by guest on September 17, 2017
advances.nutrition.org
TABLE 3 Items for measurement of diet and food intake1 No. Dietary record 24-h recall FFQ and screener Dietary
history Descriptors Label Referred definition
1 x x x x Type of administration
·
Proxy administered Automated multiple-pass method (26):Computerized method for collecting
interviewer-administered 24-h dietary recalls either in person or by telephone.
·
Self-administered and notverified by interviewer
·
Self-administered and checked by interviewer·
Interview administered·
Interview administered using automated multiple-pass method2 x x x x Origin of the questionnaire
·
Self-developedquestionnaires
Questionnaires (25): A predetermined set of questions used to collect data—clinical data, social status, occupational group, etc. This term is often applied to a self-completed survey instrument, as contrasted with an interview schedule.
·
Use of standardized questionnaire·
Adopted other questionnaires 3 (if 2 = self-developed questionnaires) x x x x Content validity of questionnaire assessed·
No Content validity (25): The extent to which the measurement
incorporates the domain of the phenomenon under study. For example, a measurement of functional health status should embrace activities of daily living
(occupational, family, and social functioning, etc.).
·
Yes, in another population·
Yes, in a comparable population in terms of both age and dietary habits4 (if 3 = yes) x x x x Reference of the validation2
·
No validation was conductedBiomarker (25): A substance, structure, or process that can be measured in biological specimens or media and may be associated with health outcomes or biological effects. A cellular, biochemical, or molecular indicator of exposure; of biological, subclinical, or clinical effects; or of possible susceptibility. A biological indicator of internal dose, biologically effective dose, early biological response, altered structure, or altered function.
·
Comparison withsubjective dietary assessment methods (e.g., FFQ, 24-h recall, or short term dietary record)
·
Comparison withlong-term weighted dietary record (.7 d)
·
Comparison with objectivemethods (e.g., biomarker of dietary intake)
5 (if 3 = yes) x x x x Validated element(s)
·
Properties of the whole questionnaire (e.g., interrater reliability, etc.)—
·
Frequency optionsappropriate to identify between-person variations
·
Food items lead tounderestimated target nutrients intake (for FFQ only)
·
Others (Continued) by guest on September 17, 2017 advances.nutrition.org Downloaded fromTABLE 3 (Continued ) No. Dietary record 24-h recall FFQ and screener Dietary
history Descriptors Label Referred definition
6 (if 3 = yes) x x x x Type of validation
·
Concurrent validity or precision only—
·
Concurrent validity andprecision
7 x x x x Representativeness of
seasons
·
All seasons Seasons (24): Divisions of the year according to some regularly recurrent phenomena usually astronomical or climatic.
·
Not all seasons8 x x x x Quantification of portion
sizes
·
Not quantified Portion size (24): The amount of a particular food one chooses to eat at a single meal.
·
Standard portion sizes without aids·
Standard portion sizes with aids such as pictures, models, standard household measure, utensils, etc.·
Portion sizes are assessed digitally but not verified by trained staff·
Portion sizes are assessed digitally and verified by trained staff (or packaging) 9 (If 8s notquantified)
x x x x Description of food intake
data
·
Food intake is directly expressed into units of weights or volume (for weighed food record)
Portion size (24): The amount of a particular food one chooses to eat at a single meal.
·
Food intake is converted from estimated portion sizes into units of weights or volume·
Portion sizes are not converted 10 (If 8s notquantified)
x x x x Geographically specific food composition data
·
Yes Geographically specific food composition data (28): In a single country there may be a wide diversity of soil and climatic conditions, resulting in significant variance in food composition. Variations in food marketing and food preparation within different parts of a country—or between countries in the case of a multicountry
database—may also produce notable variance. For these reasons, geographically specific data may be presented in the database as a supplement to nationwide and/or region-wide averages.
·
No 11 (If 8s not quantified)x x x x Matching consumed food to
referred food composition data
·
__% food items with exact matching·
__% food items matched to means of$3 food items in the tableFood matching links food consumption data with food composition data and affects the quality of the dietary assessment
(Continued)
by guest on September 17, 2017
advances.nutrition.org
data quality by the user of the data. In doing so, researchers
extracting data from nutrition data research infrastructure
can determine quality parameters and boundaries relative
to their specific research interest. By requesting data
pro-viders to describe data quality, we avoid quality assessment
from external assessors. No predefined quality scores are
provided because this could trigger data providers to
indicate a better quality of their data with respect to the
“most important” quality measures.
Second, because the tool describes methodological
as-pects of nutritional epidemiologic data, descriptors for
data analysis and data interpretation were not considered.
Such items are typically included in tools that appraise study
quality based on information reported in manuscripts (13).
Third, throughout the discussion, we decided to allocate
several items under minimal study data requirements. These
minimal study data requirements are mandatory and ensure
basic information is added to describe uploaded data for
in-terpretation and use. For instance, previous studies indicate
that the source of funding could bias study
findings (57).
This information was considered different from the
meth-odological aspects and rather part of minimal study data
re-quirements. Unlike the minimal study data requirements,
descriptors related to study quality are presented as an
op-tional set of questions for those uploading data to databases.
The number of answered descriptors, however, can also be
used as a quality parameter to indicate how well uploaded
data are described.
To minimize the burden to the data providers, only
de-scriptors related to methodological issues of data collection
were considered. We acknowledge that the methodological
considerations of studies here are only one aspect to describe
data quality (58). Equally relevant to data quality are data
en-try accuracy and data completeness. This information,
TABLE 3 (Continued ) No. Dietary record 24-h recall FFQ and screener Dietary
history Descriptors Label Referred definition
and accuracy offindings. High-quality matching is desirable but is often not achievable due to lack of food composition data or information on food consumed.
·
__% food items matchedto same food items in the table with similar moisture content
Exact match (29): If food description reported in 24-h recall matched exactly with the description in food consumption data.
·
__% matched to a different food 12 x x — x Representativeness of the week/weekend days·
Only weekend days —
·
Only weekdays·
Both·
n/a13 x x — x Number of days of the recall/
measurement per individual
·
1 d·
2–7 d —·
.7 d 14 x x — x Selection of recall/ measurement days selected·
Convenience selection —·
Consecutive days·
Nonconsecutive, nonrandom days·
Randomly over the week15 x — x x The time of diet records
·
Not during eatingoccasions or immediately after
Diet records (24): Records of nutrient intake over a specific period of time, usually kept by the patient.
·
Immediately after eatingoccasion
·
During eating occasion16 — — x x Customized food
quantification method based on characters of population groups
·
The method was tailored to the characteristics of the population assessedPopulation groups (24): Individuals classified according to their sex, racial origin, religion, common place of living, financial or social status, or some other cultural or behavioral attribute.
·
The method was notspecifically tailored to the characteristics of the population assessed
·
Unknown1
The“x” means the item is applicable for that design. n/a, not available. 2
If applicable, tick multiple options to describe the combination of methods.
by guest on September 17, 2017
advances.nutrition.org
however, can be assessed objectively from the data and does
not require additional information provided by data providers
(30). A combination of methodological and statistical aspects
(e.g., data entry accuracy, data completeness, data cleaning
ap-proaches, etc.) of data is needed to fully describe data quality.
Further efforts will be devoted to developing data quality
de-scriptors based on statistical aspects of data in the next years.
Information collected through the data descriptors will
be made available to those interacting with the DASH-IN
(14) system as options during the construction of data queries.
When users extract data from the system, study descriptors
will be available that allow users to 1) construct queries by
choosing appropriate study quality descriptors and minimal
study data requirements and 2) check the quality
characteris-tics of data retrieved by a query. To guide users toward the best
data source, a summary statistic will be provided to indicate
the relative share of its descriptors filled. Querying of the
data system using the descriptors will hence enable
explora-tory and associational analysis and predictive modeling.
Together with minimal study data requirements, we
inte-grated the set of essential quality descriptors in Mica (59), an
open-access infrastructure to describe and share
epidemio-logic data. The JavaScript Object Notation script to define
the descriptors in Mica is available publicly to encourage
use and further development (https://github.com/enpadasi/
enpadasi-mica-forms).
As a generic tool for observational data in nutrition, this
tool can be applied to nutrition data systems other than
DASH-IN and is a relevant contribution to initiatives such
as the Global Dietary Database (7), which collects pooled
food intake data worldwide. Similarly, the FAO/WHO Global
Individual Food Consumption Data Tool aims to make food
intake data available for reuse and analysis (60). Adding the
tool to the templates and study data descriptors will enable
the careful consideration of the quality of data considered
and sensitivity of the pooled analysis.
The present report describes a controlled vocabulary of
study descriptors by an interdisciplinary group of domain
ex-perts. Additional efforts are needed to integrate them in the
nutrition research data infrastructure, including DASH-IN,
among others. Machine-operable terms and their relations,
at-tributes, and values are required to enable the interoperability
of data (61, 62). To ensure interoperability of nutrition data
systems, ENPADASI is developing an Ontology for Nutritional
Studies (ONS) (26, 63). All descriptors of these study data
characteristics will be made part of ONS and implemented
TABLE 4 Descriptors for measurement of anthropometry
No. Descriptors Options Referred definitions
1 Training of assessors
·
Self-reported, without assessors or with assessors not trained using standard operating proceduresStandard operating procedures (30): detailed, written instructions to achieve uniformity of the performance of a specific function.
·
Trained, not using standard operating procedures·
Trained and using predefined standard operatingprocedures
2 Weight
·
Self-measured, self-reported or proxy reported Proxy (24): A person authorized to decide or act for another person, for example, a person having durable power of attorney.·
Measured with no clothing instructions by an assessor Body weight (24): The mass or quantity of heaviness of an individual. It is expressed by units of pounds or kilograms.·
Measured naked or with only light clothing by an assessor3 Height
·
Self-measured, self-reported, or proxy reported Proxy (24): A person authorized to decide or act for another person, for example, a person having durable power of attorney.·
Measured with shoes Body height (24): The distance from the sole to the crown of the head with body standing on aflat surface and fully extended.·
Measured barefoot4 Waist circumference
·
Self-measured, self-reported, or proxy reported Proxy (24): A person authorized to decide or act for another person, for example, a person having durable power of attorney.·
Measured with no clothing instructions Waist circumference (24): The measurement around the body at the level of the abdomen and just above the hip bone. The measurement is usually taken immediately after exhalation.·
Measured naked or with only light clothing 5 BMI status(categories)
·
Self-reported using no aids BMI (25): BMI, anthropometric measure, defined as kg/m2.
·
Assessed using pictograms or silhouettes·
Measured using objective measures (weight and height, body scanner...)6 Whole-body adiposity
·
Using bioelectrical impedance analysis Adiposity (24): The amount of fat or lipid deposit at a site or an organ in the body, an indicator of body fat status.·
Using DXA·
Waist-to-hip ratio·
Skin fold by guest on September 17, 2017 advances.nutrition.org Downloaded fromas such in the research infrastructure. The descriptors for
data quality will be mapped to existing or newly developed
ontology terms. Integration of study quality characteristics
with the ONS will enable the consideration of study quality
during the querying of the nutrition research infrastructure
and interoperability with other data systems.
The present set of descriptors was informed by existing
tools and guidance on study quality appraisal. Our search,
however, was limited to MEDLINE, and although it is
con-sidered as the most comprehensive database for medical
lit-erature to date, we are conscious that we may have missed
some quality appraisal tools. The aim of the literature search,
however, was to derive a set of quality descriptors that could
be discussed and complemented by consortium participants
in a consecutive consultation.
Although validity and reliability assessment of a tool are
essen-tial, these properties have only been assessed for a few quality
ap-praisal instruments until now (64). During the following years,
the set of descriptors will be evaluated and extra modules will
be added. The modular structure of the tool enables easy
integra-tion of descriptors related to other study designs (e.g.,
interven-tion study, etc.) or measurements (e.g., physical activity, smoking,
etc.). In addition, data descriptors of both observational and
in-tervention studies will be linked in DASH-IN to enable the
de-scription and extraction of data from hybrid collection events
(e.g., observational analyses from clinical trials, etc.). Care will
be taken not to inflate the number of descriptors to go beyond
what is practically acceptable by data providers. An online survey
for both those uploading and extracting data will be organized to
determine the acceptable number of descriptors in the tool.
The descriptors of quality characteristics proposed in the
present report will contribute to an adequate description of
nutritional and dietary intake data as a determinant of
dis-ease and can facilitate the re-use and uncertainty analysis
of risk factors for diseases in this regard.
Acknowledgments
The authors’ responsibilities were as follows—CL and CY:
conceived and designed the research; CL, CY, and MP:
con-ducted the research; CY, MP, PK, JVC, NDC, KN, TP, EL,
GP, RC, AH, MS-M, LOD, SMP, ID, JB, PC, FM, MDA,
MG, JT, OC, DC, HDR, JW, LK, CM, BDB, GDT, AB, AR,
RG, RL, SDC, and CL: drafted the list of descriptors and
wrote the first draft of the manuscript; and all authors:
re-vised the manuscript and read and approved the final
ver-sion of the manuscript.
References
1. Lim SS, Vos T, Flaxman AD, Danaei G, Shibuya K, Adair-Rohani H, Amann M, Anderson HR, Andrews KG, Aryee M, et al. A comparative risk assessment of burden of disease and injury attributable to 67 risk factors and risk factor clusters in 21 regions, 1990–2010: a systematic analysis for the Global Burden of Disease Study 2010. Lancet 2012;380:2224–60. 2. Ligthelm RJ, Borzì V, Gumprecht J, Kawamori R, Yang WY, Valensi P.
Importance of observational studies in clinical practice. Clin Ther 2007;29:1284–92.
3. Carlson MD, Morrison RS. Study design, precision, and validity in observational studies. J Palliat Med 2009;12:77–82.
4. Byers T. The role of epidemiology in developing nutritional recom-mendations: past, present, and future. Am J Clin Nutr 1999;69:1304S–8S. 5. van Ommen B, Bouwman J, Dragsted LO, Drevon CA, Elliott R, de Groot P, Kaput J, Mathers JC, Muller M, Pepping F, et al. Challenges of molecular nutrition research 6: the nutritional phenotype database to store, share and evaluate nutritional systems biology studies. Genes Nutr 2010;5:189–203.
6. NCD Risk Factor Collaboration (NCD-RisC). Trends in adult body-mass index in 200 countries from 1975 to 2014: a pooled analysis of 1698 population-based measurement studies with 19.2 million partic-ipants. Lancet 2016;387:1377–96.
7. Del Gobbo LC, Khatibzadeh S, Imamura F, Micha R, Shi P, Smith M, Myers SS, Mozaffarian D. Assessing global dietary habits: a comparison of national estimates from the FAO and the Global Dietary Database. Am J Clin Nutr 2015;101:1038–46.
8. Sorensen HT, Sabroe S, Olsen J. A framework for evaluation of sec-ondary data sources for epidemiological research. Int J Epidemiol 1996; 25:435–42.
9. Wilkinson MD, Dumontier M, Aalbersberg IJ, Appleton G, Axton M, Baak A, Blomberg N, Boiten JW, da Silva Santos LB, Bourne PE, et al. The FAIR guiding principles for scientific data management and stewardship. Sci Data 2016;3:160018.
10. Mathers CD. Uncertainty and data availability for the global burden of disease estimates 2000–2002. Geneva (Switzerland): WHO; 2005. 11. Stroup DF, Berlin JA, Morton SC, Olkin I, Williamson GD, Rennie D,
Moher D, Becker BJ, Sipe TA, Thacker SB. Meta-analysis of observa-tional studies in epidemiology: a proposal for reporting. Meta-analysis Of Observational Studies in Epidemiology (MOOSE) group. JAMA 2000;283:2008–12.
12. Colditz GA, Burdick E, Mosteller F. Heterogeneity in meta-analysis of data from epidemiologic studies: a commentary. Am J Epidemiol 1995;142:371–82.
13. Sanderson S, Tatt ID, Higgins JP. Tools for assessing quality and sus-ceptibility to bias in observational studies in epidemiology: a systematic review and annotated bibliography. Int J Epidemiol 2007;36:666–76. 14. ENPADASI. Phenotype database (DASH-IN) [Internet]. [cited 2017
May 17]. Available from: https://dashin.eu/interventionstudies/. 15. Scottish Intercollegiate Guidelines Network (SIGN). Methodology
checklist 3 & 4 for cohort and case-control studies. 7th September [In-ternet]. [cited 2016 Jan 20]. Available from: http://www.sign.ac.uk/ checklists-and-notes.html.
16. Higgins J, Green S. Cochrane handbook for systematic reviews of in-terventions version 5.1.0. Oxford (United Kingdom): The Cochrane Collaboration; 2011.
17. Katrak P, Bialocerkowski AE, Massy-Westropp N, Kumar S, Grimmer KA. A systematic review of the content of critical appraisal tools. BMC Med Res Methodol 2004;4:22.
18. Deeks JJ, Dinnes J, D’Amico R, Sowden AJ, Sakarovitch C, Song F, Petticrew M, Altman DG; International Stroke Trial Collaborative Group, European Carotid Surgery Trial Collaborative Group. Evaluating non-randomised intervention studies. Health Technol Assess 2003;7:iii–x, 1–173. 19. Crowe M, Sheppard L. A general critical appraisal tool: an evaluation of
construct validity. Int J Nurs Stud 2011;48:1505–16.
20. von Elm E, Altman DG, Egger M, Pocock SJ, Gøtzsche PC, Vandenbroucke JP; STROBE-Initiative. The Strengthening the Reporting of Observational Studies in Epidemiology (STROBE) statement: guidelines for reporting observational studies. PLoS Med 2007;4:e296.
21. Sansone SA, Rocca-Serra P, Field D, Maguire E, Taylor C, Hofmann O, Fang H, Neumann S, Tong W, Amaral-Zettler L, et al. Toward inter-operable bioscience data. Nat Genet 2012;44:121–6.
22. Lachat C, Hawwash D, Ocke MC, Berg C, Forsum E, Hornell A, Larsson C, Sonestedt E, Wirfalt E, Akesson A, et al. Strengthening the Reporting of Observational Studies in Epidemiology-Nutritional Epi-demiology (STROBE-nut): an extension of the STROBE Statement. PLoS Med 2016;13:e1002036.
23. Willett W. Nutritional epidemiology. New York: Oxford University Press; 1998.
by guest on September 17, 2017
advances.nutrition.org
24. National Library of Medicine. Medical subject headings [Internet]. 2017. [cited 2016 Nov 25]. Available from: https://www.nlm.nih.gov/ mesh/meshhome.html.
25. Porta M. A dictionary of epidemiology. 6th ed. [Internet]. [cited 2017 Apr 26]. Available from: http://www.oxfordreference.com/view/10.1093/ acref/9780199976720.001.0001/acref-9780199976720.
26. Raper N, Perloff B, Ingwersen L, Steinfeldt L, Anand J. An overview of USDA’s dietary intake data system. J Food Compos Anal 2004;17:545–55. 27. The American Association for Public Opinion Research. Standard defi-nitions: final dispositions of case codes and outcome rates for surveys. 9th ed. Oakbrook Terrace (IL): AAPOR; 2016.
28. Greenfield H, Southgate DA. Food composition data: production, management and use. 2nd ed. Rome (Italy): FAO UN; 2003. 29. FAO/INFOODS. FAO/INFOODS Guidelines for food matching.
Ver-sion 1.2. Rome (Italy): FAO; 2012.
30. Bergdahl M, Ehling M, Elvers E, Földesi E, Körner T, Kron A, Lohauß P, Mag K, Morais V, Nimmergut A, et al.. Handbook on data quality assessment methods and tools. Wiesbaden (Germany): Euro-pean Commission Eurostat; 2007.
31. Wells GA, Shea B, O’Connell D, Peterson J, Welch V, Losos M, Tugwell P. The Newcastle-Ottawa Scale (NOS) for assessing the quality of nonrandomised studies in meta-analyses. [Internet]. [cited 2015 Mar 17]. Available from: http://www.ohri.ca/programs/clinical_epidemiology/ oxford.htm.
32. Friedenreich CM, Brant RF, Riboli E. Influence of methodologic factors in a pooled analysis of 13 case-control studies of colorectal cancer and dietary fiber. Epidemiology 1994;5:66–79.
33. Margetts BM, Thompson RL, Key T, Duffy S, Nelson M, Bingham S, Wiseman M. Development of a scoring system to judge the scientific quality of information from case-control and cohort studies of nutrit-ion and disease. Nutr Cancer 1995;24:231–9.
34. Yang WY, Burrows T, MacDonald-Wicks L, Williams LT, Collins C, Chee WS. Quality of dietary assessment methodology and reporting in epidemiology studies examining relationship between dietary outcome and childhood obesity in developing Asian countries: a systematic re-view. Nutr Diet 2014;71:201–9.
35. NNR5 Working Group. A guide for conducting systematic literature reviews for the 5th edition of the Nordic Nutrition Recommendations. Revised ed. Copenhagen (Denmark): Nordic Council of Ministers; 2011.
36. Hoy D, Brooks P, Woolf A, Blyth F, March L, Bain C, Baker P, Smith E, Buchbinder R. Assessing risk of bias in prevalence studies: modification of an existing tool and evidence of interrater agreement. J Clin Epi-demiol 2012;65:934–9.
37. Al-Jader LN, Newcombe RG, Hayes S, Murray A, Layzell J, Harper PS. Developing a quality scoring system for epidemiological surveys of genetic disorders. Clin Genet 2002;62:230–4.
38. Jackson N, Waters E. Guidelines for Systematic Reviews in Health Promotion and Public Health Taskforce. Criteria for the systematic review of health promotion and public health interventions. Health Promot Int 2005;20:367–74.
39. Ross LE, Grigoriadis S, Mamisashvili L, Koren G, Steiner M, Dennis CL, Cheung A, Mousmanis P. Quality assessment of observational studies in psychiatry: an example from perinatal psychiatric research. Int J Methods Psychiatr Res 2011;20:224–34.
40. Giannakopoulos NN, Rammelsberg P, Eberhard L, Schmitter M. A new instrument for assessing the quality of studies on prevalence. Clin Oral Investig 2012;16:781–8.
41. Thompson S, Ekelund U, Jebb S, Lindroos AK, Mander A, Sharp S, Turner R, Wilks D. A proposed method of bias adjustment for meta-analyses of published observational studies. Int J Epidemiol 2011;40: 765–77.
42. Cho MK, Bero LA. Instruments for assessing the quality of drug studies published in the medical literature. JAMA 1994;272:101–4.
43. Carneiro AV. Critical appraisal of prognostic evidence: practical rules. Rev Port Cardiol 2002;21:891–900.
44. Singh J. Critical appraisal skills programme. J Pharmacol Pharmacother 2013;4:76.
45. National Institute for Health and Care Excellence. National Institute for Health and Care Excellence (NICE). [Internet]. [cited 2016 Jan 20]. Available from: https://www.nice.org.uk/process/pmg10/chapter/ appendix-e-methodology-checklist-casecontrol-studies.
46. Rostom A, Dubé C, Cranney A, Saloojee N, Sy R, Garritty C, Sampson M, Zhang L, Yazdi F, Mamaladze V, et al. Celiac disease. Evidence report/technology assessment no. 104. (Prepared by the Uni-versity of Ottawa evidence-based practice center, under contract No. 290-02-0021). Rockville (MD): Agency for Healthcare Research and Quality; 2004.
47. Zeng X, Zhang Y, Kwong JS, Zhang C, Li S, Sun F, Niu Y, Du L. The methodological quality assessment tools for preclinical and clinical studies, systematic review and meta-analysis, and clinical practice guideline: a systematic review. J Evid Based Med 2015;8:2–10. 48. National Collaborating Centre for Environmental Health (NCCEH). A
primer for evaluating the quality of studies on environmental health. Critical appraisal of cross-sectional studies [Internet]. [updated 2014 Jun 5; cited 2015 Dec 20]. Available from: http://www.ncceh.ca/sites/ default/files/Critical_Appraisal_Cross-Sectional_Studies_Aug_2011.pdf. 49. Center for Evidence-Based Management (CEBMa). Critical appraisal of
case-control study, cohort/panel study and survey [Internet]. [updated 2014 Jun 5; cited 2016 Jan 20]. Available from: http://www.cebma.org/wp-content/ uploads/Critical-Appraisal-Questions-for-a-Case-Control-Study.pdf. 50. Genaidy AM, Lemasters GK, Lockey J, Succop P, Deddens J, Sobeih T,
Dunning K. An epidemiological appraisal instrument - a tool for evaluation of epidemiological studies. Ergonomics 2007;50:920–60. 51. National Health and Medical Research Council (NHMRC). How to use
the evidence: assessment and application of scientific evidence. Can-berra (Australia): National Health and Medical Research Council; 2000. 52. Greenhalgh T. How to read a paper: assessing the methodological
quality of published papers. BMJ 1997;315:305–8.
53. Greenhalgh T, Taylor R. How to read a paper: papers that go beyond numbers (qualitative research). BMJ 1997;315:740–3.
54. Heller RF, Verma A, Gemmell I, Harrison R, Hart J, Edwards R. Critical appraisal for public health: a new checklist. Public Health 2008;122:92–8. 55. Sirriyeh R, Lawton R, Gardner P, Armitage G. Reviewing studies with diverse designs: the development and evaluation of a new tool. J Eval Clin Pract 2012;18:746–52.
56. Illner AK, Freisling H, Boeing H, Huybrechts I, Crispim SP, Slimani N. Review and evaluation of innovative technologies for measuring diet in nutritional epidemiology. Int J Epidemiol 2012;41:1187–203. 57. Bes-Rastrollo M, Schulze MB, Ruiz-Canela M, Martinez-Gonzalez MA.
Financial conflicts of interest and reporting bias regarding the associ-ation between sugar-sweetened beverages and weight gain: a systematic review of systematic reviews. PLOS Med 2013;10:e1001578.
58. Even A, Shankaranarayan G. Understanding impartial versus utility-driven quality assessment in large datasets. Presented at 12th Interna-tional Conference on Information Quality; 2007 Nov 9-11, MIT, Cambridge, MA.
59. Maelstrom Research program. Publish with Mica: what is Mica? [In-ternet]. [cited 2017 June 22]. Available from: http://www.obiba.org/ pages/products/mica/.
60. Food and Agricultural Organization of the United Nations. Nutrition. FAO/WHO Global Individual Food consumption data Tool (FAO/WHO GIFT) [Internet]. [updated 2016 Mar 22; cited 2016 Aug 19]. Available from: http://www.fao.org/nutrition/assessment/food-consumption-database/en/. 61. Preece A, Missier P, Ernbury S, Jin B, Greenwood M. An
ontology-based approach to handling information quality in e-science. Concurr Comp-Pract E 2008;20:253–64.
62. Min H, Manion FJ, Goralczyk E, Wong YN, Ross E, Beck JR. Inte-gration of prostate cancer clinical data using an ontology. J Biomed Inform 2009;42:1035–45.
63. ENPADASI. Ontology-for-nutritional-studies [Internet]. 2016. [cited 2017 Jun 24]. Available from: https://github.com/enpadasi/Ontology-for-Nutritional-Studies.
64. Hootman JM, Driban JB, Sitler MR, Harris KP, Cattano NM. Reliability and validity of three quality rating instruments for systematic reviews of observational studies. Res Synth Methods 2011;2:110–8.
by guest on September 17, 2017
advances.nutrition.org