June, 2015 AgricEngInt: CIGR Journal Open access at http://www.cigrjournal.org Vol. 17, No. 2 23
Assessment of flooring slipperiness for food industry buildings
Barreca F.
*, G. Cardinali, C.R. Fichera
(Università degli Studi Mediterranea di Reggio, Dipartimento di Agraria, Italy)
Abstract: One of the most common causes of accidents in food industry buildings is slipping caused, in particular, by the spilling of liquid substances on the floor, which reduces the coefficient of friction between floor and sole. The aim of this study was to assess the performance of the most common types of flooring used in the food industry, where, owing to the characteristics of the manufacturing stages, the probability of liquid spilling is higher. Five different types of flooring, usually utilized in the food industry, were tested: two unglazed gres tiles and three resin floors. The tiles were different in surface shape: one was flat (gres A), the other was a tile with embossed surface (gres B). The surface of the resin used was made up of a three-component polyurethane/cement-based mortar (resin A), a two-component epoxy (resin B) and a two-component epoxy in water dispersion (resin C). To classify a surface as anti-slip the Dynamic Friction Coefficient (DFC) was measured in five different conditions (dry, wet with distilled water, contaminated by olive oil, cow’s milk and red wine) and with three types of sliders (leather only for dry condition, rubber and synthetic for contaminated conditions) for each floor panel. The analysis of ANOVA showed that the slipping properties of the floors did not depend only on surface roughness but also on the chemical characteristics of the surfaces in contact with each other (sole surface/floor).
Keywords: floor, slip, worker safety, food industry buildings, dynamic friction coefficient
Citation: Barreca, F., G. Cardinali, and C.R. Fichera. 2015. Assessment of flooring slipperiness for food industry buildings. Agric Eng Int: CIGR Journal, 17(2):23-30.
1 Introduction
1Safety in the workplace is one of the main goals of the European Commission, because it is a factor that helps assess the quality of work and improve the safety of workers through a sustainable reduction of accidents (Barreca et al., 2013).
A statistical analysis on employment shows that, in the fourth quarter of 2013, in Italy, the labour force was approximately 25,663,000 units (ISTAT, 2014 a), with a number of workers of 22,408,000, of which 822,000 in Agriculture, 4,596,000 in Industry, 1,598,000 in the Construction sector and 15,392,000 in the Service sector. As to the Italian industry, the subsector of food products and beverages is of fundamental importance for the national economy (i.e. 15% of the industrial sector sales proceeds) and in the European scenario, as it is the second attractor of labour and employment and the
Received date: 2015-01-19 Accepted date: 2015-03-19 *Corresponding author: Barreca F., Università degli Studi Mediterranea di Reggio, Dipartimento di Agraria, Italy. Tel .: +39 096516944215. E-mail: [email protected].
leading manufacturer in terms of value of goods sold. These values highlight the special importance that safety in the workplace has in different productive sectors, since a high percentage of people are employed in activities where the risks of accidents are high if not properly considered.
In 2013, the number of accidents was 605,484 (2.7% of the total number of workers), of which 536,828 in the Industry and Service sectors, 40,234 in Agriculture and 28,422 among civil servants (ISTAT, 2014 a).
Of the 536,828 accidents recorded in 2013 in the Industry and Service sector, 131,899 occurred in the Industry sector, 68,162 in the crafts sector and 153,583 in the Service sector, while 73,042 accidents took place in Other Activities (ISTAT, 2014 b). In particular, in the Industry sector, 68,076 accidents were reported in manufacturing (ISTAT, 2014 c), of which 4,975 in the food industry (ISTAT, 2014 c), which thus ranks third for risk of occurrence. However, between 2007 and 2011, the food industry recorded a negative trend of reported accidents equal to 14%. Even in terms of accident rates,
24 March, 2015 AgricEngInt: CIGR Journal Open access at http://www.cigrjournal.org Vol. 17, No. 2 with its 31.9 complaints out of 1,000 workers, the food
industry exceeds the value for the entire manufacturing industry, which records 30.9 complaints out of 1,000 workers (Amatucci, 2013).
An analysis of statistical data has shown that the most common causes of accidents within the workplace are sliding, tripping and falls, which are the main reasons of absence for periods longer than three days and are the first causes of accidents in small and medium-sized enterprises. In fact, the report “Causes and
circumstances of accidents at work in the EU”, sponsored
by the European Community to promote safety and health in the workplace, has shown that the falls on the same level (slipping, tripping or falling in general) are among the leading causes of accidents in all productive sectors. In the EU, it was found that approximately 67.3% of accidents are due to slipping, tripping or falling; only 8.2% to a loss of control and 11.4% to body movements with mild external injuries (European Commission, 2008). One of the most common causes of accidents in industry buildings is slipping caused, in particular, by the spilling of liquid substances on the floor, which reduces the coefficient of friction between floor and sole . (Hsu and Li, 2010).
Therefore, it is important to study this phenomenon in order to promote the reduction of accidents in the workplace caused by slipping and/or tripping through the assessment of the greater or lesser capacity of the floor to reduce the effects of instability generated by the presence of liquid contaminant on the surface (Leclercq and Saulnier, 2002).
The aim of this study was to assess the performance of the most common types of flooring used in the food industry, where, owing to the characteristics of the manufacturing stages, the probability of liquid spilling is higher.
In particular, the study was meant to assess the level of sustainability of the flooring in terms of safety to slipping by analysing the influence of some characteristics, such as the surface roughness of the floor, the material of the shoe soles and the type of contaminant liquid, which depends on the manufacturing activity carried out within the company premises (Kim et al., 2013; Liu, Li et al., 2010).
2 Materials and methods
2.1 Slipmeter
Most floor slipperiness testers evaluate the coefficient of friction at the surface/shoe interface. The literature includes various test devices (Gronqvist et al., 2003; Leclercq and Englert, 2002), such as the British Pendulum Tester (Ricotti et al., 2009), Brungraber Mark (ASTM, 2005) and Tortus (Ricotti et al., 2009). Power et al. (2007) noticed that, among nine tribometers tested, only the Tortus and Mark were able to differentiate between surfaces of different degrees of slipperiness (Powers et al., 2007). In accordance with the Italian law (Ministerial Decree n.236/89) and the ISO 10545-17, in this study, the Tortus was used to measure the Dynamic Friction Coefficient (DFC). In particular, the FSC 2011, produced by MCS Mechanik UG (Figure1a), was adopted. This device uses a friction slider, made up of the same surface material as the sole shoes, mounted on the underside and held in contact with the surface under examination by a fixed vertical load. The instrument moves forward by means of four wheels at a constant velocity (200 mm/s) and the friction force is measured by strain gauges attached to the slider. Materials, such as leather, rubber and synthetic, are applied on the slider surface to simulate the soles of the footwear most commonly used in the workplace (Figure 1b).
June, 2015 Assessment of flooring slipperiness for food industry buildings Vol. 17, No. 2 25
2.2. Flooring specimens
In this study, five different types of flooring, usually utilized in the food industry, were tested: two unglazed gres tiles and three resin floors. The tiles were different in surface shape: one was flat (gres A), the other was a tile with embossed surface (gres B) (Figure 2). The surface of the resin used was made up of a three-component polyurethane/cement-based mortar (resin A), a two-component epoxy (resin B) and a two-component epoxy in water dispersion (resin C). All floors were made in the laboratory on rigid 0.8 m × 0.8 m
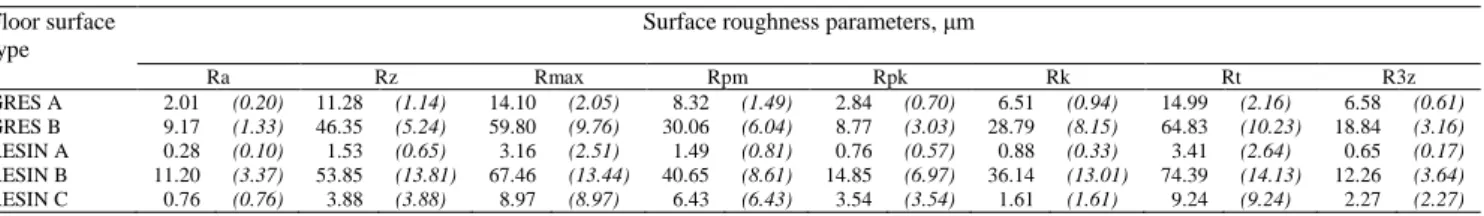
wood panels. The commercial profilometer Mahr PS1 was used to make over twenty measurements of the surface roughness parameters for each floor in different directions. A Gaussian filter was used to remove the waviness components of the surfaces, with a cut-off and a single traverse length determined in accordance with DIN EN ISO 4288. The parameters were evaluated in accordance with DIN EN ISO 13565-2 and mean values and standard deviations (Table1) were calculated for each floor specimens.
a) b)
Figure 1 a) The Tortus slipmeter FSC 2011 b) the slider: Synthetic (Blue); Rubber (Black); Leather (Red)
Figure 2 Unglazed gres tiles with embossed surface (gres B)
Table 1 Surface roughness values of the tested five floors utilized in the food industry
Floor surface type
Surface roughness parameters, μm
Ra Rz Rmax Rpm Rpk Rk Rt R3z GRES A 2.01 (0.20) 11.28 (1.14) 14.10 (2.05) 8.32 (1.49) 2.84 (0.70) 6.51 (0.94) 14.99 (2.16) 6.58 (0.61) GRES B 9.17 (1.33) 46.35 (5.24) 59.80 (9.76) 30.06 (6.04) 8.77 (3.03) 28.79 (8.15) 64.83 (10.23) 18.84 (3.16) RESIN A 0.28 (0.10) 1.53 (0.65) 3.16 (2.51) 1.49 (0.81) 0.76 (0.57) 0.88 (0.33) 3.41 (2.64) 0.65 (0.17) RESIN B 11.20 (3.37) 53.85 (13.81) 67.46 (13.44) 40.65 (8.61) 14.85 (6.97) 36.14 (13.01) 74.39 (14.13) 12.26 (3.64) RESIN C 0.76 (0.76) 3.88 (3.88) 8.97 (8.97) 6.43 (6.43) 3.54 (3.54) 1.61 (1.61) 9.24 (9.24) 2.27 (2.27)
26 June, 2015 AgricEngInt: CIGR Journal Open access at http://www.cigrjournal.org Vol. 17, No. 2 In particular, the floor with the surface in Resin B
showed the worst values of standard deviation of the roughness parameters owing to the different diameters of sand of quartz used in the substrate.
2.3 Contamination conditions
In this study, the most common conditions of the floors in the food industry were examined: dry, wet with water and contaminated by vegetable oil, milk or wine (Chang, 2004).
To that purpose, after cleaning the floors, 25 mL of distilled water, cow’s milk, olive oil and red wine were spread on each of them over an area of 4.80×10⁻² m2 for each condition of contamination, while one area was left dry. The liquid and semiliquid contaminants were distributed on the floor in such a way to cover the test area and were replenished before each measurement so that the thickness of contaminant was controlled by the surface tension. The olive oil was poured onto the floor to duplicate oil spillage conditions. The shape of the contaminated areas was obtained by means of a plastic rectangular frame 8×10⁻² m wide, 60×10-2 m long and 3×10⁻³ m thick. Such a frame was fixed to floor panels to contain the contaminant liquid and, at same time, to allow the slipmeter to move freely forward and its drive
wheels to rest over a clean surface so as to assure optimum adhesion on floors.
2.4. Survey of floor slipperiness
The DFC was measured in five different conditions (dry, wet with distilled water, contaminated by olive oil, cow’s milk and red wine) and with three types of sliders (leather 96 shore A only for dry condition, rubber 71 shore A and synthetic 76 shore A for contaminated conditions) for each floor panel. The method adopted for DFC evaluation was the Tortus, which was developed by the British Ceramic Research Association Ltd. (B.C.R.A.) Rep. CEC.6/81 and is recognized as a reference method by the Italian legislation, as stated in Ministerial Decree n.236/89 under paragraph 8.2.2.
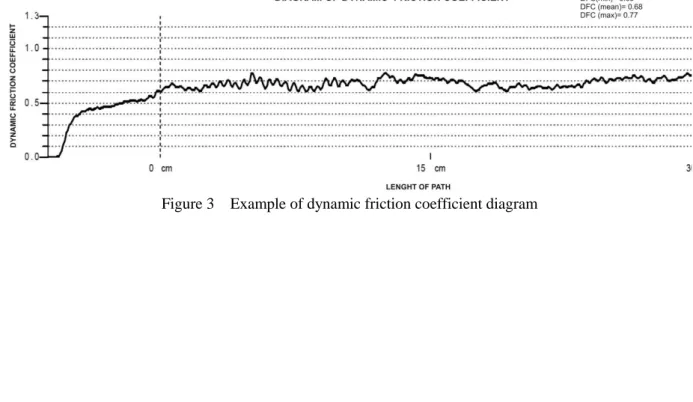
The Tortus method measures the coefficient of dynamic friction to classify a surface as anti-slip and evaluates the slipping condition using leather on dry surfaces and hard rubber on wet surfaces. The length of path was 30×10-2 m in each measurement and the device supplied the graphical measurement diagrams with the min, max and mean value of the DCF along the path (Figure 3). The measurements were replicated six times in two opposite directions and the means of the values were calculated for each survey (Table 2).
27 June, 2015 AgricEngInt: CIGR Journal Open access at http://www.cigrjournal.org Vol. 17, No. 2
3 Results
A two-way analysis of variance was performed to determine the significant effects of floors and sliders combined with contaminants and their interactions on the DFC (dependent variable). The 9×5 (Slider/Contaminant x Floor) Anova (α=0.01) proved to be statistically significant (p<0.0001) among all the independent variables
Table 3 – Results of Anova test
Effect on DFC
Sum of squares DF
Mean
square F value p- value Slider/contaminant 1.747776 8 0.218472 9.647813 1.09E-06
Floor type 1.087221 4 0.271805 12.00303 4.54E-06 Error 0.724631 32 0.022645
European guidelines and Italian Ministerial Decree n.236/89 establish that a DFC value over 0.4 is considered suitable. Floors with DFC values lower than 0.2 are dangerously slippery, floors with DFC values between 0.2 and 0.4 are excessively slippery, and floors with DFC values over 0.75 are excellent.
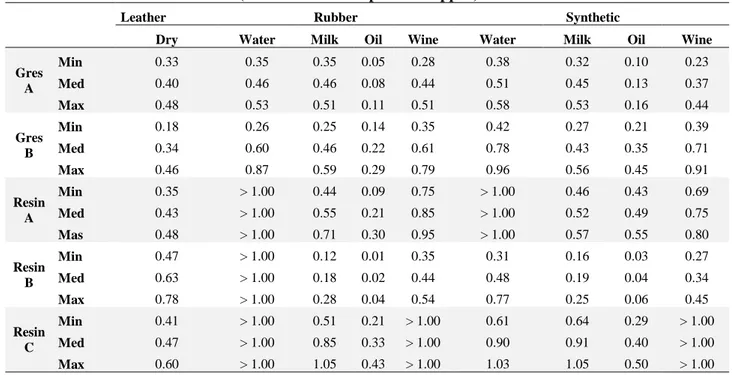
Table 2 Dynamic friction coefficients of the floors in different combinations of slider/contaminant (for DFC > 1 the slipmeter stopped)
Leather Rubber Synthetic
Dry Water Milk Oil Wine Water Milk Oil Wine
Gres A Min 0.33 0.35 0.35 0.05 0.28 0.38 0.32 0.10 0.23 Med 0.40 0.46 0.46 0.08 0.44 0.51 0.45 0.13 0.37 Max 0.48 0.53 0.51 0.11 0.51 0.58 0.53 0.16 0.44 Gres B Min 0.18 0.26 0.25 0.14 0.35 0.42 0.27 0.21 0.39 Med 0.34 0.60 0.46 0.22 0.61 0.78 0.43 0.35 0.71 Max 0.46 0.87 0.59 0.29 0.79 0.96 0.56 0.45 0.91 Resin A Min 0.35 > 1.00 0.44 0.09 0.75 > 1.00 0.46 0.43 0.69 Med 0.43 > 1.00 0.55 0.21 0.85 > 1.00 0.52 0.49 0.75 Mas 0.48 > 1.00 0.71 0.30 0.95 > 1.00 0.57 0.55 0.80 Resin B Min 0.47 > 1.00 0.12 0.01 0.35 0.31 0.16 0.03 0.27 Med 0.63 > 1.00 0.18 0.02 0.44 0.48 0.19 0.04 0.34 Max 0.78 > 1.00 0.28 0.04 0.54 0.77 0.25 0.06 0.45 Resin C Min 0.41 > 1.00 0.51 0.21 > 1.00 0.61 0.64 0.29 > 1.00 Med 0.47 > 1.00 0.85 0.33 > 1.00 0.90 0.91 0.40 > 1.00 Max 0.60 > 1.00 1.05 0.43 > 1.00 1.03 1.05 0.50 > 1.00
Figure 4 Graph shows the mean values of the dynamic friction coefficient detected for each type of floor, slider and contaminant used (water, milk, vegetable oil, wine)
28 June, 2015 AgricEngInt: CIGR Journal Open access at http://www.cigrjournal.org Vol. 17, No. 2 An analysis of regression was conducted to establish
the relationship between the DFC (dependent variable) and the independent variables. It was assumed that the DFC is a function not only of the type of floor, of contaminants and sliders, but also of the surface roughness parameters. In particular, Chang W. (1999) assessed the effect of surface roughness on the measurement of slip resistance. He concluded that surface parameters Ra and R3z had the highest correlation
with the measured friction indices for dry surfaces whereas Rpk and Rpm had the highest correlation with the
measured friction indices for wet surfaces.
Four variables, x1, x2, x3, x4, were used for the Ra, R3z,
Rpm,Rpk values. Five dummy variables, x5, x6, x7, x8, x9,
were used to indicate the floor types, Gres A, Gres B, Resin A, Resin B, Resin C. Three dummy variables, x10,
x11, x12, were used to indicate the slider types (Leather,
Rubber and Synthetic). Five dummy variables, x13, x14,
x15, x16, x17, were adopted to categorize the five conditions
of contamination of the floors (dry, wet with water, wet with milk, wet with oil, wet with wine).
More explicitly:
x1= Ra for dry floor surface
= 0 otherwise
x2= R3z for dry floor surface
= 0 otherwise
X3= Rpm for wet floor surface
= 0 otherwise
x4= Rpk for wet floor surface
= 0 otherwise
x5= 1 for gres A floor type
= 0 otherwise
x6= 1 for gres B floor type
=0 otherwise
x7= 1 for resin A floor type
=0 otherwise
x8= 1 for resin B floor type
= 0 otherwise
x9= 1 for resin C floor type
= 0 otherwise
x10= 1 for leather slider and dry floor surface
= 0 otherwise
x11= 1 for rubber slider and floor contaminated with water
= 0 otherwise
x12= 1 for rubber slider and floor contaminated with milk
= 0 otherwise
x13= for rubber slider and floor contaminated with oil
= 0 otherwise
x14= for rubber slider and floor contaminated with wine
=0 otherwise
x15= for synthetic slider and floor contaminated with water
= 0 otherwise
x16= for synthetic slider and floor contaminated with milk
= 0 otherwise
x17= for synthetic slider and floor contaminated with oil
=0 otherwise
x18= for synthetic slider and floor contaminated with wine
= 0 otherwise
The function of the DFC was assumed as follows (Equation1):
𝐷𝐹𝐶 = (𝑎𝑥1+ 𝑏𝑥2+ 𝑐𝑥3+ 𝑑𝑥4)(𝑒𝑥5+ 𝑓𝑥6+ 𝑔𝑥7+
ℎ𝑥8+ 𝑖𝑥9)(𝑙𝑥10+ 𝑚𝑥11+ 𝑛𝑥12+ 𝑜𝑥13+ 𝑝𝑥14+
𝑞𝑥15+ 𝑟𝑥16+ 𝑠𝑥17+ 𝑡𝑥18)(1)
The equation is the estimated Dynamic Friction Coefficient calculated as the product of the regression coefficient and the independent variables for the 45 combinations of roughness parameters, floor types, sliders and contaminations.
The following regression coefficients were calculated interpolating the measured DFC:
a = -0.864; b = -0.596; c = -0.137; d = 0.109; e = 0.735; f
= 0.250; g = 3.175; h = 7.088; i = 0.338; l = -0.085;
m = 1.398; n = 0.903; o = 0.326; p = 1.198; q = 1.293; r =
0.091; s = 0.053; t = 1.150
The final equation showed a Standard Error=0.15 and a Correlation Coefficient = 0.90.
4 Discussion
The comparison of the DFCs of the floors under different contamination conditions (Figure 4) permitted
June, 2015 Assessment of flooring slipperiness for food industry buildings Vol. 17, No. 2 29 an assessment of their possible fields of applications.
All the floors were suitable (DFC>0.4) in the environment whose surface was wet with water (the floor in Resin showed an excellent performance) and, apart from Gres B, they showed suitable performance in the environment with a dry surface (and worker with leather shoe soles). Gres B showed the lowest value of DFC (0.34) under dry conditions, although it had an embossed surface and a surface roughness bigger than Gres A (Figure 2). Under all the other conditions, gres B showed higher DFC values than gres A. The reason could be that, under dry conditions, the embossed surface reduced the contact surface below the soles of shoes, while, under wet conditions, the liquid film did not come into contact with the soles of shoes but flowed between the protuberances of the surface. Moreover, the lubrication effect of the liquid is lower than in a plane surface. The performance of the tested floors under food industry conditions was interesting. In particular, no tested floor was suitable for utilization in olive mills, above all if workers wore shoes with rubber soles. The utilization of floors in Resin B is extremely dangerous in olive mills (DFC=0.02) and cheese factories (DFC=0.04), while floors in gres A are dangerous in olive mills (DFC=0.08). Only the floors in resin A or resin C were suitable for utilization in olive mills, but only if the workers wore shoes with synthetic soles. In general, the resin floors showed the best performance. Moreover, the low value of surface roughness of the floor in resin A (Ra= 0.28 μm and Rmax= 3.16 μm ) could be an advantage for the cleaning operation of the floor, although it is important to underline that, after the tests, some marks of the liquid contaminants, particularly of red wine, were visible (Figure 5). The maximum values of DFCs under all conditions were those of the floor in resin C (a two-component epoxy) with an arithmetical average of surface heights (Ra) of 0.76 μm and a maximum
roughness depth (Rmax) equal to 8.97 μm. The analysis
of ANOVA showed that the slipping properties of the floors did not depend only on surface roughness but also
on the chemical characteristics of the surfaces in contact with each other (sole surface/floor). The regression model in Equation 1 is particularly useful because it may predict the value of DFC in different cases (e.g. different surface roughness) and assist food industry designers in the choice of the best floor surface.
Figure 5 Floor panel in resin A after the test. The mark of red wine is evident
Limitations of the study
The DFC was measured with the Tortus method, the only method accepted by the Italian law. Yet, this method is not very appreciated in the international field. In fact, in the scientific literature, results are often criticized, above all when the floor is under wet conditions. The surveys of DFC were performed in specimens of new floors. It would be important to assess the real DFC when the floor has already been used and worn and its surface roughness has been modified (Kim and Smith, 2000). In fact, food materials and environmental conditions in the food industry may modify the characteristics of the floor. For example, some chemical components of liquid food (e.g. acetic, oleic, citric acid) may corrode the floor surfaces. Moreover, an important characteristic of the surface in the food industry is cleanability. Hence, to correlate anti-slip properties with the easy cleaning of the floors would be very important and could be the aim of future work.
5 Conclusions
The evaluation of the slipping risk in food industry is important for the prevention of accidents in this important productive sector. The choice of the most suitable floor,
30 March, 2015 AgricEngInt: CIGR Journal Open access at http://www.cigrjournal.org Vol. 17, No. 2 taking into account workers’ safety and hygienic safety,
is fundamental for the sustainability of food productions. In this study, the floors most commonly found in the food industry were tested: two floors in ceramic tiles and three in anti-slipping resin. Results showed that the choice should be made with specific reference to the food manufactured and not to any type of food industry facility. Each food contains different chemical and biological substances and has different effects on the surfaces of the floors. For example, food with higher contents of fats (e.g. oils, milk, meat, etc.) makes the floor more slippery. Therefore, it is crucial to evaluate the performances of the food industry building components in relation to the specific characteristics of their products.
Acknowledgements
The research was carried out in the framework of the Ministry of Education, University and Research by research program: SAFE@MED “Research infrastructure for sustainable agriculture and food in mediterranean area”
References
Amatucci, S. 2013. Dati INAIL. Andamento degli infortuni sul lavoro. Numero 5. Maggio 2013. ISSN 2035-5645 ASTM. 2005. Standard method of test for using a portable
inclinable articulated strut slip tester (PIAST). Annual book of ASTM Standards, vol.15.07. American Society for Testing and Materials, West Conshohochen, PA. Barreca, F., G.Cardinali, , C.R.Fichera, L.Lamberto, , and G
Modica. 2013. A fuzzy-based model to implement the global safety buildings index assessment for agri-food buildings. Journal of Agricultural Engineering,45(1): 24-31.
Chang, W. 1999. The effect of surface roughness on the measurement of slip resistance. International Journal of Industrial Ergonomics, 24(3): 299-313.
Chang, W.R. 2004. Preferred surface microscopic geometric features on floors as potential interventions for slip and fall accidents on liquid contaminated surfaces. Journal of Safety Research, 35(1): 71–9.
European Commission. 2008. Causes and circumstances of accidents at work in the EU. Directorate General for Employment, Social Affairs and Equal Opportunities. F4 unit. ISBN 978-92-79-11806-7. doi 10.2767/39711
Grönqvist, R., M.Hirvonen, , E.Rajamäki, , and S.Matz. 2003. The validity and reliability of a portable slip meter for determining floor slipperiness during simulated heel strike. Accident; Analysis and Prevention, 35(2): 211–25.
Hsu, Y.W. and K. W.Li. 2010. A field assessment of floor slipperiness in a fish market in Taiwan. Safety Science, 48(5): 556–561.
ISTAT. 2014 c. Banca dati statistica. http://internetws.inail.it/BDSbi/saw.dll?Dashboard& NQUser=PUBLIC2&PortalPath=/shared/IM_INF_DEN/ _portal/Industria&Page=IM_INF_DEN_CO_ICS_I_ Accessed : 09-10-2014
ISTAT. 2014 a. Banca dati statistica. http://bancadaticsa.inail.it/bancadaticsa/bancastatistica .as p?cod=2. Accessed : 09-10-2014
ISTAT.. 2014 b. Banca dati statistica. http://internetws.inail.it/BDSbi/saw.dll?Dashboard& NQUser=PUBLIC2&PortalPath=/shared/IM_INF_DEN/ _portal/Tutti_i_settori&Page=IM_INF_DEN_CO_ICS_T T. Accessed : 09-10-2014
Kim, I. J., H.Hsiao, , and P.Simeo nov. 2013. Functional levels of floor surface roughness for the prevention of slips and falls: clean-and-dry and soapsuds-covered wet surfaces. Applied Ergonomics, 44(1): 58–64.
Kim, I.J. and R.Smith. 2000. Observation of the floor surface topography changes in pedestrian slip resistance measurements. International Journal of Industrial Ergonomics, 26(6): 581–601.
Leclercq, S. and H. Saulnier. 2002. Floor slip resistance changes in food sector workshops: prevailing role played by “fouling.” Safety Science, 40(7-8): 659–673. Leclercq, S. and M.Englert. 2002. Slip prevention: validation of
duplicates reproducing industrial floor surface state microgeometry. Applied Ergonomics, 33(1): 95–100. Liu, L., K. W.Li, , Y.H.Lee, , C. C.Chen, and C.Y. Chen. 2010.
Friction measurements on “anti-slip” floors under shoe sole, contamination, and inclination conditions. Safety Science, 48(10): 1321–1326.
Powers, C. M., J. R.Brault, , M. a Stefanou, , Y.-J Tsai,., J.Flynn, , and G. P.Siegmund. 2007. Assessment of walkway tribometer readings in evaluating slip resistance: a gait-based approach. Journal of Forensic Sciences, 52(2): 400–5.
Ricotti, R., M.Delucchi, , and G.Cerisola. 2009. A comparison of results from portable and laboratory floor slipperiness testers. International Journal of Industrial Ergonomics, 39(): 353–357.