https://doi.org/10.1177/1477370820980368 European Journal of Criminology 1 –32 © The Author(s) 2020 Article reuse guidelines: sagepub.com/journals-permissions DOI: 10.1177/1477370820980368 journals.sagepub.com/home/euc
Who are our owners?
Exploring the ownership
links of businesses to identify
illicit financial flows
Alberto Aziani
Università Cattolica del Sacro Cuore - Transcrime
Joras Ferwerda
Utrecht University School of Economics, The Netherlands
Michele Riccardi
Università Cattolica del Sacro Cuore - Transcrime
Abstract
This article investigates the patterns of business ownership in Europe, using a unique dataset on the nationality of 28.7 million shareholders of companies registered in 41 European countries. By means of an exploratory multivariate analysis, it tests whether ownership links between different countries are driven exclusively by social and macroeconomic variables – such as trade or geographical or cultural proximity – or are also related to measures of financial secrecy, corruption and lack of compliance with anti-money laundering regulations. The results indicate that factors other than licit economic incentives explain the international ownership structure of European companies. European firms have an abnormal number (that is, above the predicted value) of owners from tax havens and countries with poor financial transparency, which may suggest the use of holding companies for money laundering and tax evasion and to conceal illicit financial flows. However, ceteris paribus, the number of owners is abnormal in countries where rule of law and the control of corruption are more effective, suggesting that a high level of corruption may be a cost in money laundering activities. The findings contribute to the current international debate on illicit financial flows – as framed by United Nations Sustainable Development Goal 16.4 – and can be used by public agencies and private actors to detect anomalies in business ownership and prevent potential financial crime schemes at corporate level.
Corresponding author:
Joras Ferwerda, Utrecht University School of Economics, PO Box 80125, 3508 TC Utrecht, The Netherlands.
Email: [email protected]
Keywords
Corporate ownership, offshore countries, money laundering, corruption, tax evasion
Introduction
In recent years, a global consensus has emerged about the need to increase the transpar-ency of company ownership to prevent transnational crimes (European Commission, 2017; FATF, 2016). Criminals can hide their identities or their illicit proceeds behind a veil of complex and extensive corporate structures, often set up offshore. As stressed by recent media investigations such as the Panama or Paradise Papers (ICIJ, 2017, 2018), opaque corporate entities can be used for tax evasion and tax avoidance (Alstadsæter et al., 2017; Cobham and Janský, 2019; Zucman, 2013), to conceal large-scale corruption schemes (Van der Does de Willebois et al., 2011), to launder money (Savona and Riccardi, 2017; Unger et al., 2014), and to facilitate transnational organized crime (Savona and Riccardi, 2018; Steinko, 2012). Therefore, more knowledge about business ownership (especially cross-border ownership) is of the utmost importance in detecting and preventing illicit financial flows (IFFs).
This need has also been stressed by the Recommendations of the Financial Action Task Force (FATF, 2012) and acknowledged at European Union (EU) level in the updated versions of the anti-money laundering (AML) Directive (EU Directive 2018/843). The EU AML regime requires (i) obliged entities – such as banks, notaries and other professionals – to investigate the ownership structure and identify the benefi-cial owners of their customers; and (ii) EU Member States to set up central public registers of beneficial owners (Art. 13:1(b)). Despite the regulatory developments, knowledge about who owns European businesses remains scant. Just as scant is an understanding of the extent to which business ownership connections with certain for-eign countries are ‘risky’.
This article addresses this gap in knowledge by analysing cross-border ownership links as ‘red flags’ of IFFs. This study is one of the first empirical analyses of the deter-minants of companies’ cross-border ownership links, and one of the first empirical investigations of the role played by financial secrecy and effective governance in shap-ing the transnational structures of IFFs. We define as a cross-border ownership link or a cross-border shareholding any case in which a shareholder – either a natural or a legal person – from a j-country holds a share in the share capital of a legal person reg-istered in an i-country, when i is not equal to j (see the next section for an example and details). The focus of this article is on legal persons only and the unit of analysis is the country, that is, the aggregate volume of ownership links between legal persons located in i and j. In accordance with most of the literature (for example, Aziani, 2018; UNODC, 2017), we use the expression ‘illicit financial flows’ to refer to the transna-tional movements of assets related to illicit activities such as money laundering, cor-ruption (especially grand corcor-ruption) and tax evasion schemes – eventually including some forms of tax avoidance.1
Using an exploratory multivariate analysis of data on the nationality of shareholders of companies registered in 41 European countries, the article analyses whether cross-border business ownership links are exclusively driven by legitimate determinants – for
example, economic size, cultural proximity, trade or other social and macroeconomic drivers – or whether they are explained also by illicit determinants, related to countries’ financial secrecy and level of corruption.
The article tests two hypotheses: (H1) that, after controlling for legitimate determi-nants, cross-border ownership links are explained by the financial and corporate secrecy of the jurisdiction in which the shareholder is located: the higher the level of secrecy, the more likely a legal person will be registered in that country and control a firm in another (more transparent) country; (H2) that, ceteris paribus, cross-border ownership is nega-tively correlated with the level of corruption of the country in which the shareholder is located: for setting up holding companies, shareholders will look at countries with higher secrecy but lower corruption. In other words, we hypothesize secrecy and corruption to be inversely correlated, meaning that a high corruption level represents a cost for people willing to design an IFF scheme.
To test these hypotheses, the article develops a methodology, based on a gravity model, which makes it possible to detect ‘anomalous’ cross-border ownership links, that is, ties that are abnormally above the value predicted by legitimate determinants such as geographical, social and economic relations between two countries, and which therefore suggests that corporate entities are possibly used to manage IFFs. The ranking of anoma-lous links produced by this article can help countries to identify more precisely those foreign jurisdictions on which to focus their monitoring and investigation resources and with which to strengthen international police and judicial cooperation.
The article is structured as follows. The first section provides a literature review and presents our theoretical model and research hypothesis. The second section describes the data and methodology. We report the results of our estimation models in the third section, and discuss the theoretical and policy implications in the fourth and fifth sections, respectively.
Literature overview and research hypothesis
Defining cross-border ownership and understanding its legitimate
determinants
Assume a company Alpha, registered in any country i, is controlled by two shareholders – a natural and a legal person – based in a country j (Figure 1). We define such a situation and the two shareholding ties as a ‘cross-border ownership link’. Why is this happening? Why should a company located in i-country be owned by a shareholder of j-country nationality? There can be many reasons. Although most ownership links have fair and legal economic explanations, some may be driven by illicit purposes, such as the need to conceal tax eva-sion, money laundering and other IFFs. For example, an individual trying to hide his/her identity or the origin of his/her funds may decide to set up a holding company in country j (like company Beta in the example in Figure 1) because this jurisdiction has lower corpo-rate transparency standards, which makes it more difficult for investigators or banks to identify the ultimate owner and to understand where the funds come from.
The contention of this article is that suspicious ownership links between any i-country (location of the controlled firm) and j-country (location of the shareholder) can be
detected by comparing an ideal scenario, in which cross-border ownership links are explained by legitimate determinants only, with the observed reality, in which illicit motivations also count. In other words, any ownership links that exceed what is pre-dicted by legitimate drivers could suggest the existence of IFFs between countries.
The first step of this approach is therefore to understand what are the legitimate driv-ers explaining the owndriv-ership links between countries. We focus on owndriv-ership links only between legal persons – such as limited companies, individual firms or other legal enti-ties (the tie between company Alpha and company Beta in the example in Figure 1), because, as demonstrated by a large body of literature, legal persons are much more frequently used as veils for hiding IFF schemes (Savona and Riccardi, 2017, 2018; Steinko, 2012; Unger et al., 2014; Van der Does de Willebois et al., 2011). A good start-ing point for the identification of legitimate drivers is gravity models on trade and finance. The baseline of gravity models (see the Data and methodology section below for details) implies that cross-border links mirror the rules of Newton’s gravitational theory: the closer the countries and the bigger their size, the higher the extent of their ties. Therefore, in our case, the smaller the geographical distance between two countries and the bigger their economies (in terms of both the real economy and the financial market), the bigger the volume of their cross-border ownership links to be expected. ‘Close coun-tries’ could be interpreted also in terms of cultural and social proximity: speaking the same language and having current and former political and institutional relationships may increase trust, reduce the barriers to legal trade and facilitate access to valuable information between two countries (Ghemawat, 2001; Sgrignoli et al., 2015) – and even-tually increase the volume of corporate ownership links.
We supplement and adjust the traditional gravity model with a set of further variables that, according to the literature, could help explain corporate ownership. First, profitabil-ity. Companies of nationality j could invest (and acquire share capital) in firms in country
Figure 1. Cross-border ownership links between the countries of companies (i) and of
i in expectation of a return on their investment. Profitability can also be interpreted in terms of tax incentives. Investors may prefer to set up holding companies or parent com-panies in a country with a favourable tax rate so that they can then shift profits to the shareholders and minimize the overall fiscal pressure on the business group (Devereux et al., 2002; Zucman, 2013). This would then be reflected in a lower tax rate in j-country (where the parent companies would be registered) than in i-country. Another important factor in cross-border corporate ownership is how easy it is to set up a business (World Bank, 2019). The quicker and more efficient the process for setting up a legitimate busi-ness in a certain j-country, the more likely it becomes that foreign investors will go there to establish a parent company.
Financial secrecy as a driver of cross-border ownership links
Although geographical, social, economic and tax determinants are fundamental in explaining cross-border ownership links, they may not be enough. We believe that another crucial driver is the need for secrecy. Any individual willing to control a com-pany in any i-country, but at the same time is required to conceal his/her identity or the origin of his/her funds, may opt to control the firm through another legal company set up in a country j where, owing to high level of financial and corporate opacity, it would be difficult to trace back his/her beneficial ownership. For this purpose, legal persons based in those j-countries with low transparency may be exploited to ultimately control compa-nies based in i-country where transparency is higher.
There are several reasons why investors may decide to hide behind opaque corporate veils. Some may be licit – for example, personal privacy – but generally they are driven by illicit purposes – for example, concealing tax evasion, money laundering and other types of IFF (Janský and Kokeš, 2016; Van der Does de Willebois et al., 2011). Financial crimes are characterized by a high degree of rationality of their actors (Benson and Madensesn, 2010; Gilmour, 2016). Following a rational choice approach, criminals who want to hide their identity would choose countries with a lower risk of detection. All money laundering techniques are aimed at layering, that is, putting distance between the dirty proceeds and their origin and beneficial owners (Levi, 2014). Among existing lay-ering possibilities, the employment of legal firms as shell entities is a common modus operandi, especially when these firms are set up in countries with low corporate transpar-ency requirements that do not offer full disclosure of corporate owners and do not guar-antee cooperation and information exchange with foreign authorities (Ferwerda et al., 2013; Tax Justice Network, 2018; Van der Does de Willebois et al., 2011).
The World Bank and UNODC study on 150 cases of laundering grand corruption proceeds demonstrates the frequent involvement of certain jurisdictions as locations of shell companies, among them the United States, the British Virgin Islands (BVI), Liechtenstein and the Bahamas, all countries characterized by low corporate transpar-ency standards (Van der Does de Willebois et al., 2011). Recently, the MORE2 project
showed the role of some EU jurisdictions, in particular Malta, Cyprus and some East European countries, as common places in which European organized crime groups (in particular Italian mafias) set up corporate vehicles for facilitating money laundering. Focusing on Spain, in most of the 367 money laundering cases judged between 1995 and
2011 and analysed by Steinko (2012), shell companies were used to conceal IFFs and were set up in a variety of jurisdictions, including Andorra, Aruba, Cayman Islands, Isle of Man and the United States (Florida, in particular). Lists of ‘secrecy jurisdictions’ emerge also from the many journalistic leaks and investigations in the last few years, the most famous being probably the Panama Papers (in 2015) and the Paradise Papers (2017). The jurisdictions most frequently mentioned ’as registered seats of shell compa-nies in the files leaked from law firm Mossack Fonseca in the Panama Papers are Panama, BVI, the Bahamas and Seychelles. In the Paradise Papers we find Hong Kong, the United Kingdom and the United States at the top of the list.
All these (judiciary and journalistic) evidence-based reports suggest countries which are used as locations for incorporating corporate vehicles used as layers for IFFs. However, these lists are not fully representative as they may be biased depending on the type of predicate offence under analysis (for example, grand corruption vs. organized crime), actor (for example, tax evaders vs. mafias) and on the location of the source (for example, the Panama Papers tend to overestimate the role of Caribbean countries because Mossack and Fonseca tended to provide services in this area; Steinko’s study is Hispanic-centric).
We use a different approach, not stemming from individual cases, but making infer-ences from aggregate data. In particular, we believe that, after controlling for legitimate determinants (the macroeconomic, social, geographical and cultural factors), ‘abnormal’ cross-border ownership links (that is, above what is predicted by legitimate determi-nants) may signal IFFs between any i-country (location of the firm) and j-country (loca-tion of the shareholder). And therefore we expect a positive correla(loca-tion between these ‘abnormal’ links and the level of financial secrecy of the j-countries where shareholders (parent companies) are incorporated (hypothesis H1).
Corruption as a cost in IFF schemes
If higher levels of secrecy in j-country may increase the number of foreign shareholders based in that country, what would be the role of corruption and the rule of law? Ceteris paribus, are foreign shareholders more numerous from countries with high or low levels of corruption? What is the interplay between corruption and secrecy?
Even if the question is crucial in terms of policy design, the role of corruption in determining money laundering and IFFs has not been investigated to any great extent, especially in empirical terms. Existing studies – mostly theoretical – do not report the same direction of causality and the literature on the relationship between corruption and IFFs is ambiguous about the sign (see Chaikin and Sharman, 2009, for a review). Walker (1999) assumes that criminals do not like (excessively) corrupt countries, because cor-ruption increases the costs of money laundering owing to necessary side payments and bribes. On the other hand, Unger (2013) argues that a low level of corruption may make it difficult to find facilitators for hiding and laundering IFFs. Dreher and Schneider (2010) find empirical evidence that the relationship between the shadow economy and corruption is not straightforward either: corruption reduces the shadow economy in high-income countries but increases it in low-high-income ones. Savona and Riccardi (2018) show that corruption is correlated with the intensity of the use of cash, which in turn is a facili-tator of money laundering and assimilation of illicit proceeds. Finally, the Basel AML
Index considers corruption to be a risk factor of money laundering, implying that more corruption is related to more money laundering.
Based on Walker (1999), we expect that high levels of corruption in a country reduce the risk of attracting IFFs. Money laundering is a crime characterized by a high degree of rationality of the actors (Benson and Madensesn, 2010); and money launderers, as rational agents, would move their illicit funds to those jurisdictions in which they could maximize their benefits (that is, enjoying ill-gotten gains) and minimize their costs (that is, the probability that proceeds are traced and predicate crimes are identified). Highly corrupt countries with a weak rule of law would make it difficult for launderers to maxi-mize the benefits and minimaxi-mize the costs of money laundering: the extra costs imposed in terms of bribes and inefficiency would hamper the incorporation of corporate vehicles, and the weak rule of law would undermine the possibility of freely – and securely – accessing the proceeds once laundered. Therefore, in our setting, we test the hypothesis (H2) that ‘abnormal’ cross-border ownership links are negatively correlated with the level of corruption of j-countries (location of the shareholder): ceteris paribus, investors setting up shell companies for illicit purposes would opt for countries with a high level of secrecy but a low level of corruption and a stronger rule of law. Table 1 lists the hypotheses for the legal and illicit determinants.
Table 1. Research hypotheses: Legal and illegal determinants of cross-border ownership links.
Dependent variable: Number of shareholders of
nationality j of companies registered in i-country Expected sign Legal determinants
Size of the real economy, i and j-country +
Geographical distance −
Geographical contiguity +
Size of the financial market, i and j +
Ease of setting up a business, i +
Corporate tax rate, i −/+
GDP growth, i +
Shared language +
Former colonial relationship +
Former same country +
Migrants of nationality j in i +
EU membership, i and j +
WTO membership, i and j +
Illicit determinants
H1 Financial secrecy, j +
H2 Control of corruption, j +
Rule of law, i +
Data and methodology
To test our hypotheses, we adopt a sequential-regressions strategy with three steps (Figure 2). The first step aims at estimating the part of cross-border ownership links that cannot be explained by legitimate reasons. At this scope, we perform a set of regression analyses, based on a gravity model, in which macroeconomic and social factors are the independent variables and the volume of cross-border ownership links is the dependent variable. Second, following the example of Cassetta and her colleagues (2014), we gen-erate and rank the studentized Anscombe (1953) residuals emerging from the first set of models, thus identifying the most anomalous pair of countries corresponding to the most unpredicted (or ‘abnormal’) cross-border ownership links, which we interpret as red flags of possible IFFs.3 Third, we regress the residuals against measures of financial and
corporate secrecy (to test our hypothesis H1) and of corruption and the rule of law (to test H2). As a robustness check, we jointly test the explanatory power of both legitimate and illicit determinants as suggested by Chen et al. (2018).
Using a gravity model to explain cross-border business ownership links
The model we use to explain cross-border ownership links is based on a gravity model of bilateral financial flows derived from the ones theoretically and empirically investigated by authors such as Eichengreen and Luengnaruemitchai (2008), Karolyi (2016) and Portes et al. (2001). Nowadays, gravity models have become the ‘workhorse of applied interna-tional economics’ because they allow the characteristics of both origin and destination countries to be modelled (Eichengreen and Irwin, 1998). The empirical results obtained with the model have generally been judged as very good (Deardorff, 1998; Ferwerda et al., 2013). The gravity model is inspired by Newton’s universal law of gravity, which asserts that the attraction between two objects (F) depends on the mass of those objects (mi and mj), the inverse of their squared distance (r2) and the gravitational constant (G):
F Gm m r ij i j ij = 2 . (1)
By taking the logarithms of equation (1), it is possible to obtain a linear relationship that is suited to econometric analysis:
lnFij = +g β1lnmi+β2lnmj−β3lnrij2+εij. (2)
For financial flows, the larger the economies and the closer the countries, the more likely it is to find ownership links among entities registered in two countries. In econometric terms:
lnYij = +g β1lnXi+β2lnXj−β3lnDij+β2lnPij+εij, (3)
where Yi,j is the value of the aggregate cross-border ownership links between countries i and j; X represents the sizes of the economies of countries i and j; Dij denotes the dis-tance between countries; Pij represents a matrix of possible characteristics of i and j that lead shareholders to prefer one country over another. Finally, εij are the pair-specific residuals.
We use Poisson Pseudo-Maximum Likelihood (PPML) regressions with robust stand-ard errors clustered at i-country level to run the econometric analyses relating to step 1. PPML regressions have emerged as the dominant estimator for empirical gravity models. PPML allows for correctly interpreting parameters also in presence of high heteroske-dasticity and it is particularly suited to dealing with a large number of zeros in the dependent variable, which often characterizes these models (Egger and Staub, 2016; Santos Silva and Tenreyro, 2006). For steps 2 and 3, we exploit studentized residuals – that is, divided by their standard deviation – as indicators of anomaly in the ownership link. We want to ensure that we clean the error terms emerging from the regressions of step 1 as much as possible. Therefore, exploiting the multilevel nature of our data (that is, level-1 pairs, level-2 countries), we estimate the preferred model – as identified by the Akaike (AIC) and Bayesian information criteria (BIC) – including destination fixed effects, thus reducing biases due to omitted variables.
Then, we use multiple strategies to deal with the structure of the errors and the pos-sible forms of the relationship under investigation. First, we analyse the obtained resid-uals through the use of a feasible generalized least squares estimator (FGLS), which are robust to heteroskedasticity and cross-sectional correlation (Fomby et al., 1984). Then, we exploit an ordered probit and a probit to relax any assumption of linearity in the rela-tion between the anomalies and our variables of interest. At this scope, following Gullo and Montalbano (2018), we construct a variable that clusters the studentized residuals in three categories: <2, between 2 and 3 and >3, because 2 and 3 are common thresh-old values to identify outliers in the distribution of studentized residuals. We then use this variable as the dependent variable in the ordered probit. A dichotomous variable separating outliers – that is, above 2 – from the rest of the distribution is used in the probit models.
Operationalization of the ownership links
To produce our dependent variable – that is, (the natural logarithm of) the number of shareholders of j-country of companies in i-country – we exploit business ownership information taken from the Bureau van Dijk’ (BvD) ORBIS database.4 We analyse the
shareholders of all companies in the database for 41 European countries. The companies in these 41 European countries (i-countries) have 28.7 million foreign shareholders (of which 9.3 million are legal persons and 781,938 foreign legal persons) from 210 coun-tries worldwide (j-councoun-tries), whose country of origin is known (Figure 3). We aggregate the number of ownership links between all country pairs, which results in 8610 unique pairs in which the j-country (country of the shareholder) is different from the i-country (country where the company is registered).
The ORBIS database is the only central repository of data on business owners at the international level. Data on business owners are usually held by national business regis-ters, which cover only the firms registered in that country. In contrast, ORBIS makes it potentially possible to reproduce the entire global network of shareholders. At the same time, ORBIS provides information on both public and private companies, as well as on state-owned enterprises. For all types of companies, it provides information on all share-holders, irrespective of their share of the equity, as long as ownership information is avail-able for that particular company. For these reasons, ORBIS is used in empirical analysis in the business ownership domain (for example, Cobham and Janský, 2019; Garcia-Bernardo et al., 2017). However, information on the shareholder’s country is not always available and the degree of availability varies between countries for a number of reasons, such as differences in company law, privacy rules and the accessibility of company regis-tries accessed by ORBIS. To account for this heterogeneity, we control for the share of available information on the nationality of business owners in each i-country.
Figure 3. Countries of companies (i) and of shareholders (j). Note: All i-countries are simultaneously also j-countries.
Operationalization of the legitimate determinants of cross-border
ownership
Operationalization of the independent variables representing the legitimate determinants of cross-border business ownership exploits open-access databases commonly used in macro-level economic and sociological studies (Table 2). In particular, the economic size
Table 2. Variables selected for operationalization and summary statistics.
Obs. (N) Mean SD Source
No. of shareholders (legal person) (j in i), ln 8610 1.19 1.93 BvD ORBIS Legitimate determinants
GNI (i), ln 8610 −2.05 1.83 World Bank
GNI (j), ln 7421 −3.37 2.37 World Bank
Geographical distance, ln 8364 8.43 0.89 CEPII
Contiguity 8245 0.02 0.15 CEPII
EU membership (i) 8610 0.66 0.47 EU
EU membership (j) 8610 0.13 0.34 EU
WTO member (i) 8610 0.88 0.33 WTO
WTO member (j) 8610 0.75 0.43 WTO
Former colonial relationship 8254 0.03 0.16 CEPII
Former same country 8254 0.01 0.10 CEPII
Migrants (j in i), ln 8280 −3.38 3.62 United Nations
Common language 8103 0.05 0.21 CEPII
Procedures to start (i–j), ln 7708 2.82 0.26 World Bank
Tax rate (i–j), ln 8610 3.73 0.27 KPMG & Deloitte
GDP growth (i–j), ln 7503 2.55 0.28 World Bank
Bank deposits as share of GDP (i), ln 8610 4.20 0.49 World Bank
Bank deposits as share of GDP (j), ln 8610 3.87 0.64 World Bank
Market capitalization as share of GDP (i), ln 8610 3.40 0.93 World Bank Market capitalization as share of GDP (j), ln 7913 3.17 1.26 World Bank Related to H1: Financial secrecy
Tax-haven dummy, FSI (j) 8569 0.31 0.46 TJN
Sum of 13 tax-haven dummies (j), ln 8610 0.65 0.94 Multiplea
Financial Secrecy Score (FSS) 2018 (j), ln 8610 4.18 0.12 TJN Related to H2: Rule of law and control of corruption
Rule of law (i), ln 8610 −0.26 3.15 World Bank
Rule of law (j), ln 8241 0.66 1.20 World Bank
Control of corruption (i), ln 8610 0.91 0.40 World Bank
Control of corruption (j), ln 8241 0.96 0.36 World Bank
Additional controls
Available information on shareholders’
nationality (i), ln 8610 −1.34 1.18 BvD ORBIS
Notes: The reported number of observations refers to country pairs i–j given by the combination of the 41 i-countries and 210 j-countries. Not all variables are available for all country pairs (8610), leading to different numbers of observations. BvD = Bureau van Dijk; CEPII = Centre d’Études Prospectives et d’Informations Internationales; TJN = Tax Justice Network; WTO = World Trade Orghanization.
of the countries considered is estimated in terms of gross national income (GNI). The geographical distance of each pair of countries is operationalized by (a) their physical distance weighted for the location of the population within the countries and (b) the fact of sharing a border. We rely on the stock market capitalization or on bank deposits as measures of the size of the financial markets. The size or the value of the trades between the two countries is not included among the regressors, being highly collinear with sev-eral of the other economic determinants.
We retrieved data on the nominal corporate income tax rate from KPMG (2017) and integrated them with data furnished by Deloitte (2018) to operationalize the fiscal pres-sure in the countries considered. The number of days required to open a business (data gathered from the World Bank) is used as a proxy for the bureaucratic efficiency of a country, as previously done, among the others, by Dreher and Schneider (2010). Being an analysis at the country level (and not at firm level), we use GDP growth as a proxy of profitability. The higher the growth of country i’s economy, the more likely becomes, ceteris paribus, the attraction of foreign investments and therefore of foreign business owners (Aitken et al., 1996). Conceptually, these factors proxy the convenience of investing in i-country rather than in j-country. Therefore, they do not enter our linear equation separately for i and j, but instead in the form of the difference between the value in i and the value in j.
Finally, we operationalize social, cultural and institutional factors. In particular, we consider whether the i-country and the j-country are EU Member States and members of the WTO, if they were formerly part of the same country or if they have had a colonial relationship. In the expectation that cultural and social proximity influences cross-border business ownerships, we include among the regressors (a) migration flows between j-countries and i-countries as reported and (b) the presence of a common language spo-ken by more than 9 percent of the population in any pair of countries.5
Operationalization of financial secrecy, the rule of law and control of
corruption
We alternate the use of four different variables to measure financial secrecy. First, we exploit a dummy variable produced by Tax Justice Network (2011) which indicates whether a country can be considered a tax haven. Second, we build a variable that com-bines different lists of tax havens from 13 studies.6 In particular, a country could obtain
a score ranging from 0 to 13; the last case applying if it is indicated to be a tax haven by all 13 studies. Finally, we use the 2018 Financial Secrecy Score (FSS) estimated by Tax Justice Network (2018).7 In contrast to ‘blacklists’ of tax havens, the FSS is not a binary
division between black-listed and white-listed countries; it locates countries along a secrecy spectrum ranging from countries with very high transparency (for example, Finland) to ones with very low transparency (for example, Vanuatu) (Cobham et al., 2015).8 Secrecy jurisdictions are often also tax havens (Gara and De Franceschis, 2015);
nonetheless, by controlling for the tax rate of countries i and j, as mentioned above, we isolate those links that are driven not by tax optimization purposes but by criminal ones.
Quantifying the quality of governance and corruption is challenging and limits to cross-national and temporal comparability characterize all available measures. Specifically,
operationalizing the concept of the rule of law is challenging because it comprises two aspects: the existence of certain rules and how they are enforced (Kaufmann et al., 2011). The World Bank (2017) provides an indicator of the rule of law for 215 countries. In par-ticular, the World Bank’s rule of law indicator ‘captures perceptions of the extent to which agents have confidence in and abide by the rules of society, and in particular the quality of contract enforcement, property rights, the police, and the courts, as well as the likelihood of crime and violence’ (2017: 1).
Indicators of corruption specifically focusing on business registrations and controls are not currently available. We therefore have to rely on more general measures of cor-ruption. Among the possible indicators of corruption, we use the Control of Corruption indicator of the World Bank (2017). An alternative estimate of the level of corruption in a given country is the Corruption Perceptions Index produced by Transparency International. The correlation between the two indicators is above 0.97 for the year and for the countries available in both databases (Antonaccio and Tittle, 2007; Butler et al., 2007). So the use of one or the other should not affect the final estimates. We use the World Bank indicator because of the wider agreement among scholars on the soundness of its methodology.
Empirical results
Here we describe the results of our econometric analyses. In the first set of models (Table 3), we start from a basic gravity model based on countries’ economic size and geographical distance (Model LE.1); then we add the complete set of control varia-bles related to legal determinants of cross-border ownership (Models LE.2 to LE.7). Finally, in Model LE.8, we include i-country fixed effects to control for unobserved heterogeneity.
As hypothesized, the number of foreign shareholders from j-country is positively cor-related with the GNI of both i-countries and j-countries, whereas it is negatively corre-lated with the geographical distance between the countries: the bigger the economies and the closer the countries, the higher the number of ownership links. In Model LE.2, we introduce controls for EU and WTO membership of both the i-countries and j-countries. The number of foreign shareholders is, ceteris paribus, higher whenever the j-country is part of the EU. This is not surprising considering that 27 out of the 41 countries included in the sample are in the EU. However, the influence of WTO membership is weak, prob-ably because most countries in the world are part of the organization. Model LE.3 includes our proxy for the social, cultural and legal proximity between j-countries and i-countries. Countries in which part of the population speak the same language, as well as countries that have been in a colonial relationship, have a stronger connection in terms of companies’ ownership. Conversely, the size of the population migrating from share-holder-country to company-country and the fact of having been part of the same country are not correlated to the number of shareholders in this specification of the model.
Models LE.4 and LE.5 add the differential between any pair of countries in terms of the procedures required to open a business, of tax rates and of GDP growth (as a meas-ure of ‘return on investment’). Models LE.6 and LE.7 include the size of the financial sector measured either by bank deposits or by market capitalization as a share of GDP,
Table 3. Legitimate drivers of cross-border ownership links.
Dependent variable: Number of foreign shareholders (j in i), ln
LE.1 LE.2 LE.3 LE.4 LE.5 LE.6 LE.7 LE.8
GNI (i), ln .21*** .19*** .17*** .16*** .17*** .13*** .15*** .15*** (.028) (.032) (.037) (.037) (.037) (.034) (.040) (.017) GNI (j), ln .38*** .33*** .33*** .32*** .32*** .24*** .22*** .22*** (.016) (.015) (.018) (.018) (.018) (.018) (.018) (.017) Geographical distance, ln −.23*** −.13*** −.10*** −.09*** −.09*** −.08*** −.11*** −.07*** (.034) (.040) (.038) (.035) (.035) (.033) (.032) (.026) Contiguity −.00 .01 −.01 −.01 −.01 −.00 −.01 −.01 (.064) (.071) (.083) (.085) (.085) (.099) (.083) (.072) EU membership (i) .04 .04 .03 .03 .03 .03 .14*** (.161) (.158) (.169) (.172) (.172) (.174) (.018) EU membership (j) .12*** .14*** .13*** .12*** .10*** .11*** .09*** (.045) (.035) (.032) (.032) (.028) (.028) (.033)
WTO member (i) .02 .02 .05 .04 .03 .03 −.06***
(.171) (.183) (.237) (.239) (.238) (.214) (.015) WTO member (j) .06*** .06*** .03** .03** .01 .02* .01 (.068) (.063) (.062) (.062) (.063) (.056) (.055) Former colony .04*** .04*** .04*** .04*** .03*** .02*** (.115) (.110) (.110) (.097) (.099) (.080) Former same country .01 .01* .01* .01 .01* .01 (.119) (.121) (.121) (.154) (.125) (.156) Migrants (j in i), ln .01 .02 .02 .07** .05* .11*** (.014) (.013) (.013) (.015) (.015) (.013) Common language .04*** .04*** .04*** .02* .03** .02** (.105) (.100) (.099) (.084) (.084) (.073) Procedures to start (i–j), ln .12*** .12*** .08*** .07*** .10*** (.143) (.146) (.137) (.129) (.092)
Tax rate (ij), ln −.03* −.03* −.03** −.02* −.02*
(.087) (.091) (.082) (.082) (.046)
GDP growth (i–j), ln .02 .01 .04* .03***
(.125) (.150) (.140) (.049)
Bank deposits (i), ln .01 .02***
(.111) (.013) Bank deposits (j), ln .22*** .22*** (.031) (.033) Market capitalization (i), ln −.02 (.044) Market capitalization (j), ln .17*** (Continued)
respectively. The ease of setting up a business is positively correlated with the number of foreign shareholders. Conversely, foreign shareholders are negatively correlated with the differential in the corporate tax rate, a result that apparently contradicts the exten-sive literature on profit-shifting (Cobham and Janský, 2019; Zucman, 2013). The pro-posed proxies for the importance of the financial sector are positively correlated when considering the j-country where the owner is located, but they are not significant when focusing on the location of the company – that is, i-country. When controlling for the relevance of the financial sector, the correlation between the size of migrant communi-ties and the number of foreign shareholders becomes significant, although the data con-sidered refer to legal persons only. Finally, in Model LE.8 in which we use i-country fixed effects, the size of bank deposits and the EU membership of i-countries emerge as significant predictors of foreign shareholders.
Models belonging to the first set present the ideal scenario in which only legal deter-minants of foreign investments are considered. Therefore, ownership links that appear to be abnormally above the predicted values may be interpreted as ‘anomalous’ links and thus possible markers of ownership structures used for IFFs. Residuals reveal these abnormalities. For this purpose, we use the residuals of LE.8, which is the model show-ing the best goodness of fit (AIC and BIC). Residuals from the eight models are closely correlated (Table 4).
By ranking the highest residuals, a number of countries that appear as tax havens in the literature emerge as the origins of ‘anomalous’ ownership links. When we consider
Dependent variable: Number of foreign shareholders (j in i), ln
LE.1 LE.2 LE.3 LE.4 LE.5 LE.6 LE.7 LE.8
(.024) Available
information (i), ln .09*** .09*** .08*** .07* .07* .07* .06* .07***
(.043) (.042) (.042) (.052) (.053) (.052) (.052) (.006)
Constant Yes Yes Yes Yes Yes Yes Yes Yes
Fixed effects (i) Yes
No. of observations 7216 7216 6886 6766 6766 6766 6246 6766 No. of i-countries 41 41 40 40 40 40 40 40 No. of j-countries 177 177 175 172 172 172 159 172 AIC 18621 17956 17076 16664 16660 15342 15376 14607 BIC 18663 18025 17172 16773 16776 15471 15504 14696 R2 .57 .59 .60 .61 61 0.66 .64 .70
Notes: The table reports the standardized beta coefficients and the clusterized robust standard errors (in parentheses) of PPML regressions of real economy, financial market, demographic and macropolitical-related variables on the number of international shareholders from all over the world in a sample of 40 to 41 European countries. All continuous variables enter in the regression in the form of natural logarithm. The Akaike’s (AIC) and the Bayesian information criteria (BIC) values provide two measures of the relative quality of the models. *, ** and *** indicate coefficients significantly different from zero at the 95.0%, 99.0% and 99.9% confidence levels, respectively.
the j-countries with at least 500 shareholders of firms in the dataset, several countries appear multiple times among the top three anomalous connections for each i-country (Table 5): Belize 17 times, the Marshall Islands 17 times, Seychelles 16 times, Panama 10 times and the Bahamas 6 times. Apart from these offshore jurisdictions, Norway, Liberia and the United States also frequently appear as j-countries in abnormal links.
We can repeat the analysis by focusing on the j-countries that account for at least 0.1 percent of the foreign shareholders in the i-country. In this case, a more central role of European nationals can be detected. In particular, Norway appears 25 times as a most anomalous connection, and Cyprus too emerges. A similar picture results from Table 6 reporting the 20 j-countries with the highest average residuals. Table 7 presents instead the 20 i-countries (location of the company) with the highest residuals.
To investigate whether these anomalous cross-border links are correlated to secrecy, rule of law and corruption, we run a second set of models. In these models, the residuals estimated in LE.8 are regressed on measures of financial secrecy, the rule of law and cor-ruption. In eight out of nine econometric specifications, our indicators of financial secrecy are positively correlated to the size of the residuals (Table 8). In particular, ordered probit and probit regressions always confirm a positive and significant correla-tion between the FSS and our indicator of anomaly (IFF.3.OP and IFF.3.P). The excep-tion is the 2018 FSS, which is negatively correlated with the size of the residuals when using an FGLS strategy.
Regressions IFF.4 to IFF.7 test the relationship between the rule of law, corruption and anomalous ownership links (Table 9). The results of these additional models indi-cate that stronger rule of law and control of corruption in j-country (that is, shareholder
Table 4. Residuals’ correlations.
Model of reference (1) (2) (3) (4) (5) (6) (7) (8) (1) LE.1 1.00 (2) LE.2 0.97 1.00 (0.00) (3) LE.3 0.95 0.98 1.00 (0.00) (0.00) (4) LE.4 0.94 0.97 0.98 1.00 (0.00) (0.00) (0.00) (5) LE.5 0.93 0.97 0.98 1.00 1.00 (0.00) (0.00) (0.00) (0.00) (6) LE.6 0.86 0.89 0.91 0.92 0.92 1.00 (0.00) (0.00) (0.00) (0.00) (0.00) (7) LE.7 0.91 0.94 0.95 0.97 0.97 0.94 1.00 (0.00) (0.00) (0.00) (0.00) (0.00) (0.00) (8) LE.8 0.82 0.85 0.86 0.88 0.88 0.95 0.89 1.00 (0.00) (0.00) (0.00) (0.00) (0.00) (0.00) (0.00)
Note: The table reports the correlation between the studentized Anscombe residuals obtained in Models LE.1 to LE.8 together with the significance of each correlation.
Table 5.
Top three anomalous links (highest studentised Anscombe residuals) by
i(company)–country. i-country A. Shareholders from j are at least 500 B. Shareholders from j
account for at least 0.1% of foreign shareholders in
i i-country A. Shareholders from j are at least 500 B. Shareholders from j
account for at least 0.1% of foreign shareholders in
i Size of residual j-country Size of residual j-country Size of residual j-country Size of residual j-country Albania .61 Austria .61 Austria Luxembourg .83 Belize .82 Panama .61 Turkey .61 Turkey .82 Panama .80 Seychelles .59 Italy .59 Italy .80 Bahamas .54 US Austria .66 Belize .57 Norway Macedonia .65 Bulgaria .65 Bulgaria .66 Marshall Islands .55 Cyprus .63 Slovenia .63 Slovenia .65 Panama .52 US .62 Croatia .62 Croatia Belarus .62 Italy .62 Italy Malta .88 Marshall Islands .62 Norway .59 Turkey .6 Georgia .67 Liberia .60 Turkey .58 US .59 Turkey .62 Norway .58 Panama Belgium .74 Panama .57 Norway Moldova .64 Italy .64 Italy .73 Marshall Islands .52 US .61 Austria .61 Austria .64 Bahamas .50 Hungary .57 Ukraine .57 Ukraine Bosnia .65 Slovenia .65 Slovenia Montenegro .68 Bosnia .68 Bosnia .62 Croatia .62 Croatia .65 Belize .65 Belize .59 Cyprus .59 Cyprus .61 Liberia .61 Liberia Croatia .65 Norway .65 Norway Netherlands .75 Marshall Islands .55 Norway .64 Australia .64 Australia .66 Belize .53 Cyprus .62 Czech Rep. .62 Czech Republic .65 Seychelles .50 US Cyprus .97 Belize .97 Belize Norway .85 Marshall Islands .59 Denmark .96 Marshall Islands .94 Seychelles .66 Iceland .57 US .94 Seychelles .76 Panama .59 Denmark .57 Sweden (Con tinu ed)
i-country A. Shareholders from j are at least 500 B. Shareholders from j
account for at least 0.1% of foreign shareholders in
i i-country A. Shareholders from j are at least 500 B. Shareholders from j
account for at least 0.1% of foreign shareholders in
i Size of residual j-country Size of residual j-country Size of residual j-country Size of residual j-country Czech Rep. .96 Seychelles .57 Cyprus Poland .60 Norway .60 Norway .85 Marshall Islands .52 Norway .58 Cyprus .58 Cyprus .84 Belize .51 Ukraine .57 Panama .53 Denmark Denmark .78 Seychelles .64 Norway Portugal .82 Seychelles .61 Malta .73 Belize .55 US .78 Panama .59 Norway .64 Norway .54 Cyprus .76
Saint Kitts and Nevis
.53 Cyprus Estonia .84 Marshall Islands .82 Panama Romania .86 Seychelles .86 Seychelles .82 Panama .81 Belize .81 Belize .56 Turkey .81 Belize .75 Seychelles .81 Marshall Islands .54 Cyprus Finland .72 Norway .72 Norway Russia .97 Seychelles .50 Norway .65 Denmark .65 Denmark .91 Belize .50 Ukraine .62 US .62 US .83 Marshall Islands .44 Slovak Republic France .60 Norway .60 Norway Serbia .71 Belize .71 Belize .57 India .52 Denmark .66 Bosnia .66 Bosnia .56 Iceland .47 Russia .64 Montenegro .64 Panama Germany .75 Seychelles .52 Norway Slovak Republic .76 Panama .61 Cyprus .71 Belize .47 Ukraine .68 Seychelles .57 Malta .71 Marshall Islands .45 Denmark .66 Bahamas .54 Norway Greece .90 Liberia .71 Panama Slovenia .63 Bosnia .63 Bosnia .89 Marshall Islands .63 Norway .62 Seychelles .62 Seychelles .71 Panama .59 US .58 Croatia .58 Croatia Table 5. (Continued) (Con tinu ed)
i-country A. Shareholders from j are at least 500 B. Shareholders from j
account for at least 0.1% of foreign shareholders in
i i-country A. Shareholders from j are at least 500 B. Shareholders from j
account for at least 0.1% of foreign shareholders in
i Size of residual j-country Size of residual j-country Size of residual j-country Size of residual j-country Hungary 1 Seychelles .52 Cyprus Spain .72 Marshall Islands .59 Norway .93 Belize .50 Ukraine .62 Bahamas .53 Denmark .79 Panama .48 Norway .6 Belize .46 Portugal Iceland .71 Norway .71 Norway Sweden .72 Norway .72 Norway .63 Denmark .63 Denmark .63 US .63 US .61 US .61 US .62 Denmark .62 Denmark Ireland .71 Liberia .60 Norway Switzerland .79 Marshall Islands .58 Norway .67 Bahamas .59 Seychelles .75 Seychelles .54 Iceland .62 Belize .58 Cyprus .69 Bahamas .53 Turkey Italy .64 Panama .55 Norway Turkey .60 US .60 US .59 Marshall Islands .53 Hungary .58 Norway .58 Norway .58 Seychelles .47 Czech Republic .56
United Arab Emirates
.56
United Arab Emirates
Latvia .86 Belize .86 Belize Ukraine .88 Belize .63 Cyprus .84 Seychelles .84 Seychelles .80 Seychelles .56 Hungary .79 Marshall Islands .74 Panama .73
Saint Kitts & Nevis
.54 Denmark Lithuania .68 Norway .68 Norway UK .90 Liberia .56 Norway .66 Estonia .66 Estonia .82 Seychelles .45 Russia .65 Iceland .65 Iceland .80 Marshall .43 Denmark Notes : For each
i-country, the table reports the three most anomalous connections as iden
tified by their studentized Anscombe residual, normalized between 0 and 1. Two classifications
are presented. In classification A,
j-countries are considered only if their total number in the database is greater than 500. In classification B,
j-countries are considered only if they account
for at least 0.1 percent of the foreign shareholders registered in country
i.
Table 5.
Table 7. Anomalous links: Top 20 i-countries by average studentized Anscombe residual.
Rank i-country
(company location) Average residual
1 Russia .49 2 United Kingdom .46 3 Germany .43 4 Cyprus .41 5 Ukraine .41 6 Luxembourg .41 7 France .40 8 Hungary .40 9 Netherlands .39 10 Czech Republic .38 11 Poland .38 12 Latvia .38 13 Croatia .38
Table 6. Anomalous links: Top 20 j-countries by average studentized Anscombe residual.
Rank j-country
(shareholder location) Average residual
1 Marshall Islands .59 2 Seychelles .58 3 Belize .58 4 Panama .58 5 Norway .56 6 Bahamas .55 7 Montenegro .54 8 Serbia .54 9 Denmark .51 10 Cyprus .51 11 Liberia .50 12 United States .50 13 Turkey .49 14 Iceland .49 15 China .47 16 India .47 17 Malta .47 18 Israel .47 19 Sweden .46 20 Switzerland .46
Notes: The table reports the top 20 j-countries whose links are above the model prediction as expressed by their normalized studentized Anscombe residual. LE.8 is the model of reference.
Table 8. Illicit drivers of cross-border ownership links: Financial secrecy.
IFF.1 IFF.2 IFF.3
FGLS OP P FGLS OP P FGLS OP P Tax-haven dummy (j) .19*** 1.99*** 2.66*** (.00) (.08) (.07) Sum 13 tax-haven dummies (j), ln .18*** 2.28*** 3.06*** (.00) (.04) (.04) FSS 2018 (j) −.16*** 1.58*** 2.22*** (.01) (.30) (.29)
Constant Yes Yes Yes Yes Yes Yes Yes Yes Yes
Fixed effects (i) Yes Yes No Yes Yes No Yes Yes No
No. of observations: 6766 No. of i-countries: 40 No. of j-countries: 172
Notes: The table reports the standardized beta coefficients of feasible generalized least squares (FGLS), ordered probit (OP) and probit (P) regressions of variables representing tax havens on different forms of the residuals emerging from the empirical specification modelling licit determinants of transnational share-holding (that is, LE.8). The dependent variables are: normalized residuals in FGLS; three categories of the residuals – that is, below 2; 2 to 3; above 3 – in OP; dichotomous division of the residuals – that is, below 2; 2 and above – in P. *, ** and *** indicate coefficients significantly different from zero at the 95.0%, 99.0% and 99.9% confidence levels, respectively.
Rank i-country
(company location) Average residual
14 Estonia .37 15 Italy .37 16 Portugal .37 17 Slovak Republic .37 18 Spain .36 19 Malta .36 20 Albania .36
Notes: The table reports the top 20 i-countries with the most anomalous connections as identified by their studentized Anscombe residual. LE.8 with fixed effects for j-countries is the model of reference.
Table 7. (Continued)
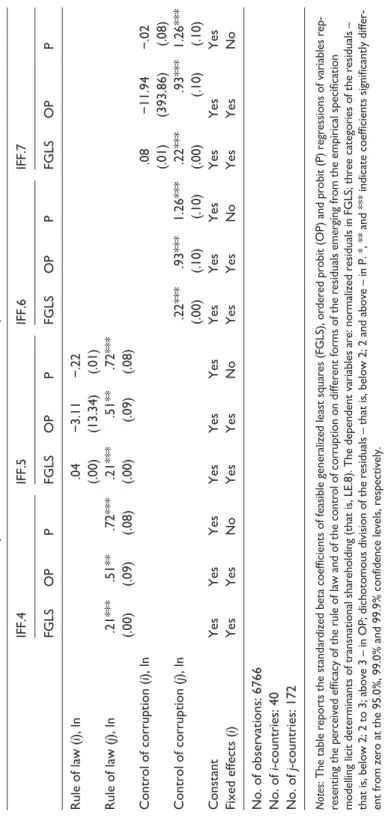
location) are positively correlated with anomalous links. The level of the rule of law and the control of corruption in i-country are not significant (IFF.5 and IFF.7). Table 10 combines both legitimate and IFF-related determinants of transnational ownership structures. The sign and significance of the main relation of interest are confirmed by these models.
Table 9.
Illicit drivers of cross-border ownership links: Rule of law and control of corruption.
IFF.4 IFF.5 IFF.6 IFF.7 FGLS OP P FGLS OP P FGLS OP P FGLS OP P Rule of law ( i), ln .04 −3.11 −.22 (.00) (13.34) (.01) Rule of law ( j), ln .21 *** .51 ** .72 *** .21 *** .51 ** .72 *** (.00) (.09) (.08) (.00) (.09) (.08) Control of corruption ( i), ln .08 −11.94 −.02 (.01) (393.86) (.08) Control of corruption ( j), ln .22 *** .93 *** 1.26 *** .22 *** .93 *** 1.26 *** (.00) (.10) (.10) (.00) (.10) (.10) Constant Yes Yes Yes Yes Yes Yes Yes Yes Yes Yes Yes Yes Fixed effects ( i) Yes Yes No Yes Yes No Yes Yes No Yes Yes No
No. of observations: 6766 No. of
i-countries: 40
No. of
j-countries: 172
Notes
: The table reports the standardized beta coefficients of feasible generalized least squares (FGLS), ordered probit (OP) and pr
obit (P) regressions of variables rep
-resenting the perceived efficacy of the rule of law and of the control of corruption on different forms of the residuals emergi
ng from the empirical specification
modelling licit determinants of transnational shareholding (that is, LE.8). The dependent variables are: normalized residuals i
n FGLS; three categories of the residuals –
that is, below 2; 2 to 3; above 3 – in OP; dichotomous division of the residuals – that is, below 2; 2 and above – in P. *, **
and *** indicate coefficients significantly differ
Table 10. Complete models (licit economy and IFFs).
Dependent variable: Number of foreign shareholders (j in i), ln
ALL.1 ALL.2 ALL.3 ALL.4 ALL.5 ALL.5
GNI (i), ln .15*** .25*** .15*** .26*** .15*** .26*** (.017) (.013) (.016) (.013) (.017) (.013) GNI (j), ln .15*** .17*** .18*** .19*** .17*** .18*** (.017) (.017) (.015) (.015) (.016) (.016) Geographical distance, ln −.07*** −.07*** −.06*** −.06*** −.06*** −.06*** (.026) (.026) (.027) (.028) (.025) (.026) Contiguity −.01 −.01 −.01 −.01 −.01 −.01 (.076) (.077) (.076) (.076) (.076) (.076) EU membership (i) .13*** .15*** .13*** .15*** .13*** .15*** (.018) (.021) (.018) (.022) (.018) (.021) EU membership (j) .05*** .05*** .05*** .06*** .07*** .08*** (.037) (.038) (.036) (.037) (.038) (.038)
WTO member (i) −.06*** −.08*** −.06*** −.08*** −.06*** −.08***
(.014) (.023) (.015) (.024) (.014) (.023)
WTO member (j) −.03*** −.00 −.03*** −.01 −.03*** −.01
(.050) (.050) (.051) (.051) (.053) (.052)
Former colony .02*** .02*** .02** .02** .02*** .02***
(.078) (.080) (.083) (.085) (.074) (.076)
Former same country .01 .01 .01 .01 .01 .01
(.136) (.145) (.142) (.151) (.132) (.141)
Migrants (j in i), ln .15*** .15*** .15*** .15*** .14*** .14***
(.014) (.014) (.014) (.014) (.014) (.014)
Common language .01 .01 .01 .01 .02* .02*
(.073) (.076) (.071) (.074) (.070) (.073)
Procedures to start (i–j), ln .04*** .04*** .04*** .05*** .04*** .04***
(.080) (.077) (.077) (.074) (.078) (.076)
Tax rate (i–j), ln −.00 .00 −.01 −.00 −.01 −.00
(.042) (.044) (.044) (.045) (.045) (.046)
GDP growth (i–j), ln .03*** .03*** .04*** .04*** .03*** .03***
(.053) (.052) (.055) (.053) (.053) (.051)
Bank deposit (i), ln .02*** .08*** .02*** .08*** .02*** .09***
(.013) (.014) (.013) (.015) (.013) (.014)
Bank deposit (j), ln .12*** .13*** .09*** .10*** .14*** .15***
(.024) (.025) (.024) (.025) (.027) (.028)
Tax-haven dummy (j) .06*** .07***
(.042) (.042) Sum 13 tax-haven dummies
(j), ln .10*** .10***
(.022) (.022) FSS 2015 (j)
Dependent variable: Number of foreign shareholders (j in i), ln
ALL.1 ALL.2 ALL.3 ALL.4 ALL.5 ALL.5
FSS 2018 (j) .02** .02**
(.092) (.093)
Rule of law (i), ln −.10*** −.10*** −.10***
(.003) (.003) (.003)
Rule of law (j), ln .19*** .18*** .21***
(.060) (.060) (.059)
Control of corruption (i), ln −.15*** −.15*** −.15***
(.018) (.019) (.018)
Control of corruption (j), ln .15*** .14*** .17***
(.054) (.054) (.053)
Available information (i), ln .09*** .07*** .09*** .07*** .09*** .07***
(.005) (.005) (.005) (.005) (.005) (.006)
Constant: Yes Fixed effects (i): Yes No. of observations: 6766 No. of i-countries: 40 No. of j-countries: 172 AIC 14429 14263 14602 14608 14001 14001 BIC 14524 14359 14697 14703 14103 14103 R2 .69 .69 .70 .70 .70 .70
Notes: The table reports the standardized beta coefficients and the clusterized robust standard errors (in parentheses) of PPML regressions of the number of international shareholders in a sample of 40 European countries. In these models we use some controls for tax havens to address the potential use of companies in IFF schemes. Models 1, 3 and 5 also include indicators of the strength of the rule of law and models 2, 4 and 6 include indicators of corruption control. These variables help in understanding the nature of the countries where illicit schemes take place. All continuous variables enter in the regression in the form of natural logarithms. The AIC and the BIC values provide two measures of the relative quality of the models. *, ** and *** indicate coefficients significantly different from zero at the 95.0%, 99.0% and 99.9% confidence levels, respectively.
Table 10. (Continued)
Discussion
The results of our analysis confirm our first hypothesis (H1) that anomalous cross-border ownership links are explained, among other factors, by the financial secrecy of the coun-try where the shareholders are. In almost all specifications, financial secrecy is strongly correlated with our indicators of anomalous ownership links – that is, the levels of resid-uals and their outliers. This result confirms a large amount of literature pointing to the opacity of the financial, banking and corporate sectors as a key vulnerability for IFFs (Aziani, 2018; Janský and Kokeš, 2016; Van der Does de Willebois et al., 2011).
This empirical result argues in favour of the fact that ‘rational choice’ is a strong theo-retical perspective for understanding the mechanism behind IFFs, as it is for money laundering and tax fraud (Cornish and Clarke, 2002; Gilmour, 2016; Mehlkop and
Graeff, 2010). Opportunities displace money flows for IFFs towards countries where risks are lower because the financial system is more opaque.
The empirical findings highlight a strong positive relationship between the control of corruption and anomalous ownership links: the stronger the corruption in a country, the lower the number of ‘anomalous’ owners located in that country. Despite limits intrinsic to any measurement of corruption, this result confirms our second hypothesis (H2): cor-ruption works as an impediment to rather than a facilitator for IFFs. Rational investors wanting to set up shell companies to conceal illicit activities opt for jurisdictions with a higher level of secrecy but a lower level of corruption (Walker, 1999).
Criminals do not have to rely on serious corruption, as long as the instruments used to conceal IFFs are efficient. ‘How can a briber be sure that what he paid for will meet his expectations? Lemons are a risk to be seriously considered in this murky environment, where partners are by definition unscrupulous and no legal recourse can be sought to sanction eventual frauds, while honesty and good faith are highly appreciated virtues in bribery’ (Della Porta and Vannucci, 2012: 18).
Finally, the correlation between the rule of law and anomalous ownership links is positive and strongly significant. Criminals prefer to direct their IFFs to more stable and peaceful countries. This further corroborates the idea that reliable institutions are a driver behind transnational illicit flows. In particular, the results presented in Table 7 show that the companies registered in Central and East European countries – often former Soviet countries (that is, Russia, Ukraine, Hungary, Czech Republic, Poland, Latvia) – tend to have a higher share of anomalous ownership links. How to interpret this result? On the one hand, it could be argued that the lack of trust in financial and political institutions in these countries may foster financial outflows that, in turn, could generate a higher num-ber of holding companies of foreign nationality (Howard, 2002; Mishler and Rose, 1997; Shlapentokh, 2006). On the other hand, the recent political turmoil in some of these areas (for example, Russia, Ukraine, Hungary) and the increase in power of non-state groups (Mulford, 2016; Zabyelina, 2019) and organized crime (Galeotti, 2017; Holmes, 2009) may have induced local entrepreneurs to secure their capital in foreign entities. In any case, there is evidence that corporates and financial institutions in some of these East European countries have been used as conduits to launder illicit proceeds originating from former Soviet countries. See, for instance, the role of the Latvian and Estonian business sector in the Troika Laundromat investigation (OCCRP, 2014; Savona and Riccardi, 2018), or the role of Cyprus as a destination for Russian anomalous invest-ments (Nesvetailova, 2020).
Policy implications
Our analysis may aid international cooperation aimed at identifying weak nodes in the global flows of illicit funds. In particular, detecting anomalous connections between countries with an empirical data-driven approach can inform policymakers and help them to design new red flags and blacklists of countries that attract IFFs.
For instance, the proposed approach is capable of highlighting the shareholder-coun-tries with the highest number of anomalous connections. The Caribbean area plays a crucial role as a location of legal-person shareholders related to anomalous ownership
links of companies registered in Europe. These results confirm previous studies in this field, such as Garcia-Bernardo et al. (2017) and the large body of evidence furnished by well-known journalistic investigations such as the Panama and Paradise Papers. Regrettably, Caribbean countries do not appear in official international blacklists related to anti-money laundering or tax evasion. Among the 20 shareholder-countries with the highest average residuals (Table 6), only the Bahamas is listed in the FATF AML grey list;9 only the Bahamas and Panama in the EU AML blacklist of third countries;10 only
Belize, Marshall Islands and Dominica in the EU blacklist of non-cooperative tax juris-dictions.11 In fact, European countries too pop up as shareholder-countries with abnormal
links, but they are not included in any blacklist. Cyprus, Iceland, Luxembourg, Malta, Montenegro and Switzerland, but also Norway, Serbia, Denmark and Sweden, rank among the top 20 shareholder-countries for which legitimate determinants fail to fully explain transnational ownership structures. In reality, these names do not surprise because they appear in previous literature related to both money laundering and organ-ized crime investigations, especially Cyprus, Malta and Switzerland (Gara and De Franceschis, 2015).
The available data – limited to first-level shareholders – do not reveal the entire own-ership structure; therefore, we are not able to test if a shareholder in a shareholder-coun-try is acting as intermediate or an ultimate owner. Still, we can check whether countries showing high residuals as a shareholder-country (Table 6) also show high residuals as company-countries (Table 7). Countries appearing in both lists are likely to play a role as locations of intermediate owners or conduits, to use the term employed by Garcia-Bernardo et al. (2017). A beneficial owner of, say, Russian origin, in order to control a company located in Poland may use a company located in, say, Cyprus as an intermedi-ate owner. In this situation, Cyprus would appear as a shareholder-country in the owner-ship chain, even though the ultimate owner is Russian. Bearing in mind that the samples of company-countries and shareholder-countries are not the same, the only three jurisdic-tions that appear in both the lists are Cyprus, Luxembourg and Switzerland, indicating that these three countries play some role as conduits or intermediate owners in anoma-lous ownership links (especially the first two).12 The role of Switzerland, in particular,
warrants some further discussion. Although the country frequently appears in investiga-tions related to various forms of IFF (Ferwerda and Reuter, 2019; Zucman, 2013), previ-ous literature shows that Switzerland, rather than being the location of shell companies, plays a key role at the global level as a location for foreign bank accounts in which to store illicit funds (see, for example, Van der Does de Willebois et al., 2011).
Nonetheless, none of these European countries is internationally black-listed. Given the weakness of these official lists, due to geopolitical biases (Sharman, 2009, 2012), the empirical perspective proposed by this article could be used as an additional approach in the identification of ‘high risk’ countries and in better guiding political pressures towards those countries actually favouring the proliferation of IFFs.
This article is only a first step towards a better understanding of cross-border owner-ship links concealing IFFs. Future analysis should go beyond the first level of sharehold-ers and map the whole network of anomalous ownsharehold-ership links. Moreover, the relationship between IFFs and corruption (not as a predicate offence, but as a facilitator of or obstacle to IFFs) requires in-depth investigation, possibly with the employment of more solid
measures of corruption, also at a local level. Furthermore, it would be important to even-tually disentangle the different forms and underlying crimes and activities of IFFs (see also Reuter, 2017) to get a better understanding of the components of IFFs and the extent to which their drivers are similar.
Acknowledgements
We wish to thank the anonymous reviewers for their insightful comments and the participants at the Bahamas inaugural conference on empirical approaches to anti-money laundering & financial crime for their suggestions on previous versions of this manuscript.
Contributions
The present study is the joint product of the work of all the authors, who are listed in alphabetical order. Alberto Aziani, Joras Ferwerda and Michele Riccardi contributed to the conceptualization of both the theoretical and the empirical components of the study. Alberto Aziani performed the analyses. Michele Riccardi provided the original data and wrote the policy implications. Alberto Aziani and Michele Riccardi jointly wrote the empirical results. Alberto Aziani, Joras Ferwerda and Michele Riccardi contributed to all other sections. All the authors reviewed the manuscript and approved its final version.
Funding
The author(s) received no financial support for the research, authorship, and/or publication of this article.
ORCID iD
Alberto Aziani https://orcid.org/0000-0002-4745-7337
Notes
1. Tax avoidance encompasses a wide range of activities with a grey zone. Some aggressive tax planning activities – such as certain transfer pricing schemes – can be against the spirit of the law and can be classified as illicit. At the other extreme, some forms of tax avoidance are in line with the spirit of the law and should therefore not be seen as illicit, such as refrain-ing from consumrefrain-ing products that are highly taxed to discourage their consumption (with cigarettes and alcohol as typical examples). Although the distinction is not always clear for activities in the grey zone, some tax avoidance activities can fall within the definition of illicit financial flows even though they are not per se breaking the law.
2. MORE – Modelling and mapping the risk of Serious and Organised Crime infiltration in legitimate businesses across European territories and sectors (HOME/2014/ISFP/AG/ EFCE/4000007212) is a research project co-funded by the EU Commission, DG Home Affairs, aimed at assessing the risk of organized crime infiltration in legitimate European businesses.
3. Ownership links – as we measure them – are not monetary values. Therefore, they can be used to estimate not the size or value of IFFs between two countries, but rather the probability that IFFs exist.
4. Information on the ownership structures refers mainly, but not exclusively, to 2015. In con-sideration of this, 2015 is selected as the year of reference to operationalize independent vari-ables as well.