OPEN PIT MINE 3D MAPPING BY TLS AND DIGITAL PHOTOGRAMMETRY: 3D
MODEL UPDATE THANKS TO A SLAM BASED APPROACH
G. Vassena, A. Clerici
Department DICATAM, University of Brescia, 25123 Brescia, Italy - [email protected]
Commission II, WG VI/10
KEY WORDS: TLS, digital photogrammetry, open pit mine, SLAM, mapping, automatic localization
ABSTRACT:
The state of the art of 3D surveying technologies, if correctly applied, allows to obtain 3D coloured models of large open pit mines using different technologies as terrestrial laser scanner (TLS), with images, combined with UAV based digital photogrammetry. GNSS and/or total station are also currently used to geo reference the model. The University of Brescia has been realised a project to map in 3D an open pit mine located in Botticino, a famous location of marble extraction close to Brescia in North Italy. Terrestrial Laser Scanner 3D point clouds combined with RGB images and digital photogrammetry from UAV have been used to map a large part of the cave. By rigorous and well know procedures a 3D point cloud and mesh model have been obtained using an easy and rigorous approach. After the description of the combined mapping process, the paper describes the innovative process proposed for the daily/weekly update of the model itself. To realize this task a SLAM technology approach is described, using an innovative approach based on an innovative instrument capable to run an automatic localization process and real time on the field change detection analysis.
1. INTRODUCTION
1.1 General introduction
Nowadays Geomatics offers to the surveyors a large number of surveying technologies, procedures and instruments. In the study later described we face an important topic: the 3D model update. Usually the surveying technologies well describe and face how to apply instruments and elaboration procedures to survey a site. Of course the technology can vary in function of the extension and geometry of the site, the accuracy and resolution required. If we want to apply a surveying technique to a mining site, as the well know excavation site of the "Botticino white marble", we could use a aerial photogrammetry for the survey of the whole site, with total station or laser scanning acquisition depending on the configuration and geometry of the part of the mine under analysis. The survey of all the cave it is usually scheduled every 2/3 months, depending on the progress of the excavation process. During this period, local surveying activities are carried on, only in the part where excavation activities have occurred. Unfortunately, the excavation, groundworks and movements of digged material processes are often very complex and it is not easy to maintain the control of the areas with volumes changes. For this reason we have implemented and described a real time change detection procedure to make possible the highlight of areas of changes to drive the frequent activities of 3D surveying and digital documentation.
1.2 "Botticino" site
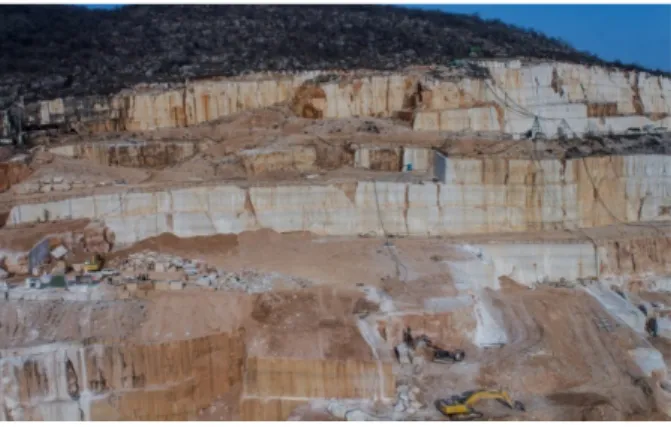
The so called "Botticino" is one of the most worldwide famous quality of white Italian marble. The cave is inside the municipality of Botticino, located in North Italy, close to the lake of Garda and it is characterized of high vertical excavation cliff (see figure 1).
Figure 1: Image of the Botticino site
For this reason the technologies used for the full site surveying are usually aerial photogrammetry by UAVs and TLS for the vertical cliffs mapping.
Figure 2: Aerial view of the Botticino site (Courtesy of Google®) The International Archives of the Photogrammetry, Remote Sensing and Spatial Information Sciences, Volume XLII-2, 2018
ISPRS TC II Mid-term Symposium “Towards Photogrammetry 2020”, 4–7 June 2018, Riva del Garda, Italy
This contribution has been peer-reviewed.
2. SITE MAPPING
The site has been mapped using two combined procedures. Digital Photogrammetry by UAV and Terrestrial Laser Scanner.
2.1 Mapping with digital photogrammetric UAV based
The full survey of the area has been carried on using RGB takens acquired from UAV (Figure 3), using well known technologies (Lucieer et al, 2014) (Hsieh et al, 2016). Reference points have been placed on the ground and georeferenced using both GNSS and total station.
Figure 3. Control points location
Using the UAV, a number of 319 images have been taken and used to extract the point cloud model. Two software have been used: PhotoScan from Agisoft and Zephyr from 3DFlow. Two elaboration procedures have been applied. The first using all the 319 images, the second one using only a reduced number of 58 selected images. The data elaboration time (for dense point cloud generation) for the two software is detailed in Table 1.
Number of Images Elaboration time (hh.mm.ss.) Photoscan Zephyr 58 00:02:14 00:03:02 319 02:10:44 00:20:23
Table 1. Data elaboration time
In the following table 2, the number of points obtained using Photoscan and Zephyr are presented, both for dense and sparse point cloud.
Software Number of points Sparse Dense Agisoft 111.695 99.231.976 Zephyr 122.114 1.660.898
Table 2. Number of points
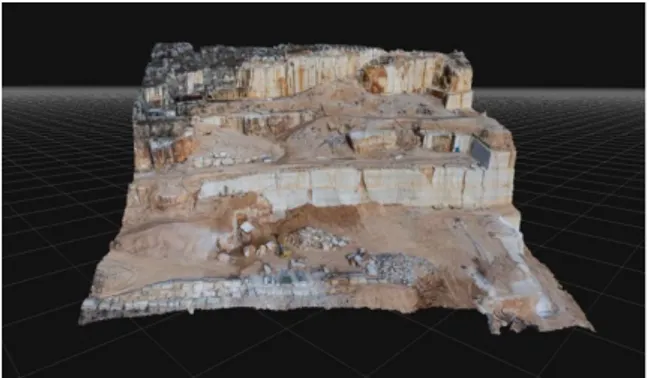
For the data elaboration, only the final mesh model (Figure 4) obtained with Zephyr have been used.
Figure 4. Final 3D mesh model obtained using Zephyr software
2.2 Mapping with TLS
The UAV mapping did not covered perfectly all the vertical cliffs. We preferred to map the vertical parts of the site using a TLS approach. In this way we could get a better coverage of the marble fronts and we could have a 3D direct data to check the geometry obtained with aerial photogrammetry. Two scans have been acquired using FARO Focus laser scanner. The same control points used in the digital photogrammetric process have been used, so to help a fast and direct comparison between the two point cloud models. The data has been later merged in JRC 3D Reconstructor® software and the results analyzed and compared using CloudCompare software.
Figure 5. The result of the TLS survey
The e.q.m. between the photogrammetric point cloud model and the TLS point cloud it is displayed in Table 3.
TLS AND ZEPHY
e.q.m. between point clouds 58 images 319 images
3,2 cm 5,0 cm Table 3. E.Q.M. between TLS point cloud and
photogrammetric point cloud
The International Archives of the Photogrammetry, Remote Sensing and Spatial Information Sciences, Volume XLII-2, 2018 ISPRS TC II Mid-term Symposium “Towards Photogrammetry 2020”, 4–7 June 2018, Riva del Garda, Italy
This contribution has been peer-reviewed.
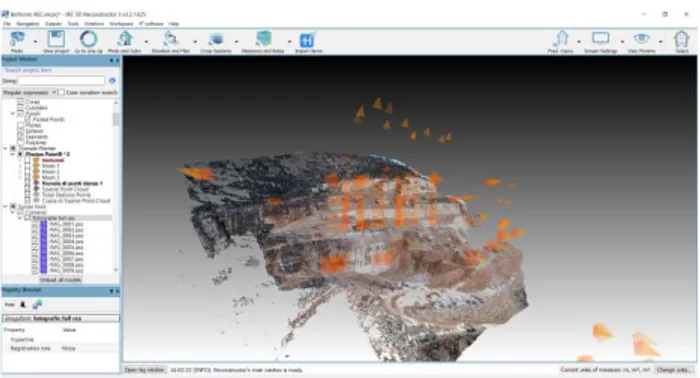
Figure 6 The final model
Figure 6 shows the final model obtained in JRC 3D Reconstructor® using both TLS and UAV point cloud data.
3. SITE MAPPING BY SLAM
3.1 The problem
In an active mine, the position where the excavation activities are active are often localized in few well defined area. To monitor the excavation process and to maintain under control the production activity regular 3D mapping survey should be frequently carried on. Moreover it is not easy for the director of a big excavation site to control and to take memory of the area under excavation. On the other hand, mapping procedures that use digital photogrammetry and/or laser scanning require the intervention of professional surveyors and the mapping process is very far to be a real time procedure. For this reason, frequent surveying activities are not usually carried on, even if the geometry and volumes control should be very useful to manage big excavation and mining sites. The SLAM, technology if correctly implemented, can be very useful for the site monitoring and solve partially these problems.
3.2 The technology
As described in the introduction, we wanted to apply and test a procedure capable to support a fast model update. For this reason we decided to use the Gexcel Heron mobile mapping system (Figure 7), for the reason that it seems the only system available in the market, capable to detect in real time the model
Figure 7 Heron mobile mapping system
changes. In this way we wanted to test if it is possible to support the surveyor in the identification of the area where changes occurred, in real time and on the field.
3.3 The Heron system
Heron is a slam based mobile mapping system developed by an Italian Company (Gexcel) in collaboration with the laboratories of the European Commission at the Joint Research Centre of Ispra (Italy) (Sánchez C. et al, 2016). Heron is a wearable Mobile Mapping System that supports Indoor and Outdoor mapping. The weight of the system is about 6 Kgs and it is mainly composed by a 3D LiDAR Velodyne Lidar 32 lines sensors (HDL32 -E) and by a commercial IMU. The system uses a SLAM approach to carry on the survey (Corso, N. et al, 2013) (Zlot, R et al, 2014) (Lauterbach, H.A. et al, 2015). The measures taken by the IMU and the LiDAR sensor are managed by a tablet control unit so to generate a 3D survey of the site. The system works using the SLAM approach, but has been chosen by the authors for the real time automatic self localization and the real time change detection features installed in the instrument.
3.4 Automatic localization and change detection
The first goal of the "Botticino" test was to verify if the SLAM instrument was really capable to localize itself using the full point cloud model obtained with TLS and photogrammetry, used as reference frame. The point cloud model, obtained from the merging of the TLS survey and from the digital photogrammetric mapping, has been loaded in the Heron system after a pre processing procedure that translate the point cloud in the "reference 3D model" format of Heron. This procedure is realized using a standalone software provided with the instrument. When on the field, the surveyor have to identify on the screen of the instrument control unit the approximate position of the instrument. In few seconds (about 10 seconds), Heron was able to recognize its position and to localize the surveyor (carrying the instrument) in respect of the reference model.
Figure 8 Mapping using the SLAM approach After the automatic localization the system started surveying the mine, visualizing in real time the surveyed parts of the mine. In the same time, the instrument monitor, displays in green the sectors of the mine that does not show any changes compared to the reference model. The changed parts appears, in real time, in red colour.
The International Archives of the Photogrammetry, Remote Sensing and Spatial Information Sciences, Volume XLII-2, 2018 ISPRS TC II Mid-term Symposium “Towards Photogrammetry 2020”, 4–7 June 2018, Riva del Garda, Italy
This contribution has been peer-reviewed.
3.5 Accuracy, resolution and practical methods
The Heron local accuracy, declared by the manufacture, is ± 2 cm, (www.gexcel.it, 2018) and the global accuracy is function of the SLAM solution, that is function of various parameters as the surveying path geometry, the shape of the surveyed site and more. Making about 10 self automatic localizations, from the same position, and checking the localization using large fixed plane targets of known coordinates, we observed a maximum difference in plane coordinates of 2 cm. For this reason we estimate that the instrument is capable to detect differences between reality and reference model, having a value bigger then 3-4 cm.
3.6 Change detection on the field test
In the field test we could observe in real time (in red colour) the area where the geometry has been changed (Figure 9).
Figure 9 Updated 3D mesh model (courtesy of Gexcel)
In this way the highlighted area could be scanned using a TLS and the model updated.
Figure 10 Updated 3D mesh model
4. CONCLUSIONS
Using the real time change detection approach, it has been possible to scan only the mine sectors with changes. In our test we decided to use the SLAM data only to identify the area with changes, and to use a High Resolution TLS to map the site and to update the final model. Of course in the future the data directly acquired by the SLAM instrument could be used, but more experience have to be acquired to understand the global accuracy of the SLAM algorithm, especially in open pit mines, where the site geometry can be sometime less dense then in indoor applications. More detailed tests have to be realized, to check the global accuracy of the change detection procedure too. It is anyway sure that the real time change detection approach, will become very soon a procedure applied in all the large 3D model update, where the parts of the model to be updated are randomly distributed in the site and where a new
survey of the all site would be very time consuming and expensive.
ACKNOWLEDGEMENTS
We thank Gexcel srl to have provided the instruments (Heron) and the software to realize the on the field tests. We thank the Valverde company that allowed the authors to freely access the mining site.
REFERENCES
Lucieer A., Jong S. M. de, Turner D., 2014. Mapping landslide displacements using Structure from Motion (SfM) and image correlation of multi-temporal UAV photography, Prog. Phys. Geogr., vol. 38, no. 1, pp. 97–116.
Hsieh Y. C., Chan Y. C., Hu J. C., 2016. Digital elevation model differencing and error estimation from multiple sources: A case study from the Meiyuan Shan landslide in Taiwan, Remote Sens., vol. 8, no. 3.
Siebert S., Teizer J, 2014. Mobile 3D mapping for surveying earthwork projects using an Unmanned Aerial Vehicle (UAV) system. Automation in Construction Journal, pp. 1-14.
Sánchez C., Taddei P., Ceriani S., Wolfart E., Sequeira V., 2016. Localization and tracking in known large environments using portable real-time 3D sensor, Computer Vision and Image Understanding 149, pg. 197 - 208.
Corso, N.; Zakhor, A. Indoor localization algorithms for an ambulatory Human operated 3D mobile mapping
system. Remote Sens. 2013, 5, 6611–6646.
Zlot, R.; Bosse, M.; Greenop, K.; Jarzab, Z.; Juckes, E.; Roberts, J. Efficiently capturing large, complex cultural
heritage sites with a handheld mobile 3D laser mapping system. J. Cult. Herit. 2014, 15, 670–678.
Lauterbach, H.A.; Borrmann, D.; Heß, R.; Eck, D.; Schilling, K.; Nüchter, A. Evaluation of a backpack-mounted 3D mobile scanning system. Remote Sens. 2015, 7, 13753–13781.
Heron data sheet. Available online: http://www. http://public.gexcel.it/Heron/2018_Cat_Brochure_HERON.pdf (accessed on 10 March 2018)
The International Archives of the Photogrammetry, Remote Sensing and Spatial Information Sciences, Volume XLII-2, 2018 ISPRS TC II Mid-term Symposium “Towards Photogrammetry 2020”, 4–7 June 2018, Riva del Garda, Italy
This contribution has been peer-reviewed.