doi:10.1152/ajpregu.00797.2007
295:624-632, 2008. First published May 21, 2008;
Am J Physiol Regulatory Integrative Comp Physiol
Moia, Denis R. Morel, Carlo Capelli and Guido Ferretti
Frédéric Lador, Enrico Tam, Marcel Azabji Kenfack, Michela Cautero, Christian
You might find this additional information useful...
59 articles, 41 of which you can access free at:
This article cites
http://ajpregu.physiology.org/cgi/content/full/295/2/R624#BIBL
including high-resolution figures, can be found at:
Updated information and services
http://ajpregu.physiology.org/cgi/content/full/295/2/R624
can be found at:
and Comparative Physiology
American Journal of Physiology - Regulatory, Integrative
about
Additional material and information
http://www.the-aps.org/publications/ajpregu
This information is current as of November 14, 2008 .
http://www.the-aps.org/. ISSN: 0363-6119, ESSN: 1522-1490. Visit our website at
Physiological Society, 9650 Rockville Pike, Bethesda MD 20814-3991. Copyright © 2005 by the American Physiological Society. ranging from molecules to humans, including clinical investigations. It is published 12 times a year (monthly) by the American illuminate normal or abnormal regulation and integration of physiological mechanisms at all levels of biological organization,
publishes original investigations that
The American Journal of Physiology - Regulatory, Integrative and Comparative Physiology
on November 14, 2008
ajpregu.physiology.org
Phase I dynamics of cardiac output, systemic O
2delivery, and lung O
2uptake
at exercise onset in men in acute normobaric hypoxia
Fre´de´ric Lador,1Enrico Tam,1,2Marcel Azabji Kenfack,1Michela Cautero,3Christian Moia,1
Denis R. Morel,4Carlo Capelli,3and Guido Ferretti1,5
1De´partement des Neurosciences Fondamentales, Centre Me´dical Universitaire, Gene`ve, Switzerland;2Dipartimento di
Fisiologia Umana e Generale, Universita` di Bologna, Bologna;3Dipartimento di Scienze Neurologiche e della Visione,
Facolta` di Scienze Motorie, Universita` di Verona, Verona, Italy;4De´partement d’Anesthe´siologie, Pharmacologie et Soins
Intensifs, Hoˆpital Cantonal Universitaire, Gene`ve, Switzerland; and5Sezione di Fisiologia Umana, Dipartimento di Scienze
Biomediche e Biotecnologie, Universita` di Brescia, Brescia, Italy
Submitted 1 November 2007; accepted in final form 19 May 2008 Lador F, Tam E, Azabji Kenfack M, Cautero M, Moia C, Morel DR, Capelli C, Ferretti G. Phase I dynamics of cardiac
out-put, systemic O2delivery, and lung O2uptake at exercise onset in men
in acute normobaric hypoxia. Am J Physiol Regul Integr Comp
Physiol 295: R624 –R632, 2008. First published May 21, 2008;
doi:10.1152/ajpregu.00797.2007.—We tested the hypothesis that va-gal withdrawal plays a role in the rapid (phase I) cardiopulmonary response to exercise. To this aim, in five men (24.6⫾ 3.4 yr, 82.1 ⫾ 13.7 kg, maximal aerobic power 330 ⫾ 67 W), we determined beat-by-beat cardiac output (Q˙ ), oxygen delivery (Q˙aO2), and
breath-by-breath lung oxygen uptake (V˙O2) at light exercise (50 and 100 W)
in normoxia and acute hypoxia (fraction of inspired O2 ⫽ 0.11),
because the latter reduces resting vagal activity. We computed Q˙ from stroke volume (Qst, by model flow) and heart rate (fH,
electrocardi-ography), and Q˙ aO2 from Q˙ and arterial O2 concentration. Double
exponentials were fitted to the data. In hypoxia compared with normoxia, steady-state fHand Q˙ were higher, and Qstand V˙O2were
unchanged. Q˙ aO2was unchanged at rest and lower at exercise. During
transients, amplitude of phase I (A1) for V˙O2was unchanged. For fH,
Q˙ and Q˙aO2, A1was lower. Phase I time constant (1) for Q˙ aO2and V˙O2
was unchanged. The same was the case for Q˙ at 100 W and for fHat
50 W. Qstkinetics were unaffected. In conclusion, the results do not
fully support the hypothesis that vagal withdrawal determines phase I, because it was not completely suppressed. Although we can attribute the decrease in A1of fHto a diminished degree of vagal withdrawal
in hypoxia, this is not so for Qst. Thus the dual origin of the phase I
of Q˙ and Q˙aO2, neural (vagal) and mechanical (venous return increase
by muscle pump action), would rather be confirmed. cardiovascular response
ALTHOUGH OUR KNOWLEDGEof the central (neural) control of the
cardiovascular system at the exercise steady state is quite well established (19, 42, 57), how the circulatory readjustments upon exercise onset occur and match the increase in pulmonary oxygen uptake (V˙O2) is less understood, as are the mechanisms
underlying this matching. The kinetics of V˙O2at exercise onset were seen for a long time as reflecting essentially the metabolic adaptations in the working muscles (15, 31, 33). Some authors, however, soon identified two components of the V˙O2kinetics:
1) a rapid, almost immediate phase (phase I) (5, 54, 55), which
they attributed to an immediate increase in cardiac output (Q˙ ) at exercise start; and 2) a subsequent slower phase (phase II), to which they restricted the influence of muscle metabolic
adjustments. The strongest support to this view came from the demonstration that the kinetics of Q˙ (12, 13, 16, 60) and arterial O2flow (Q˙ aO2) (27) are very rapid.
The concept of a close correspondence between V˙O2 and muscle O2consumption was further undermined by the recent demonstration that, upon the onset of light exercise, the V˙O2 kinetics are faster than the kinetics of muscle O2consumption estimated from the monoexponential decrease in phosphocre-atine concentration (7, 14, 43). This would imply dissociation of the kinetics of V˙O2 and muscle O2 consumption, which should respond to different control mechanisms.
Our postulate is that the V˙O2 kinetics are dictated by the regulation of the systemic cardiovascular response to exercise, whereas the metabolic regulatory processes dictate only the kinetics of muscle O2consumption. In this context, Fagraeus and Linnarsson (18) proposed that the rapid heart rate (fH) changes in exercise transients “are mediated through a with-drawal of vagal tone” (termed “vagal withwith-drawal” from this point), which can be defined as a quasi-immediate inhibition of vagal action on the sinus node at exercise start. In fact, they showed that the rapid phase of the fHkinetics was cancelled out under vagal blockade, whereas -adrenergic blockade with propranolol did not affect it. In this study, we tested the hypothesis that vagal withdrawal also plays a major role in determining phase I kinetics of Q˙ , Q˙aO2, and V˙O2. If this is so,
then in acute normobaric hypoxia, wherein reduced vagal activity (8, 26) and increased sympathetic activity at rest have been postulated (21, 26, 58, 59), phase I would be either absent or at least less intense compared with normoxia.
With this hypothesis in mind, the aim of this study was to perform simultaneous determinations of the phase I kinetics of
fH, Q˙ , Q˙aO2, and V˙O2upon exercise onset in normoxia and acute normobaric hypoxia. Such an experiment was never carried out in the past, to the best of our knowledge.
METHODS
Subjects. Five healthy, nonsmoking young male subjects took part
in the experiments. They were 24.6⫾ 3.4 yr old, 1.79 ⫾ 0.09 m tall, and weighed 82.1 ⫾ 13.7 kg. Their maximal O2 consumption and
maximal aerobic mechanical power in normoxia were 4.42 ⫾ 0.62 l/min and 330 ⫾ 67 W, respectively. The corresponding values in hypoxia were 3.41⫾ 0.83 l/min and 255 ⫾ 78 W, respectively. All Address for reprint requests and other correspondence: G. Ferretti, De´partement
de Neurosciences Fondamentales, Centre Me´dical Universitaire, 1 rue Michel Servet, CH-1211 Gene`ve 4, Switzerland (e-mail: guido.ferretti@medecine. unige.ch).
The costs of publication of this article were defrayed in part by the payment of page charges. The article must therefore be hereby marked “advertisement” in accordance with 18 U.S.C. Section 1734 solely to indicate this fact. First published May 21, 2008; doi:10.1152/ajpregu.00797.2007.
on November 14, 2008
ajpregu.physiology.org
subjects were preliminarily informed of all procedures and risks associated with the experimental testing. Informed consent was ob-tained from each volunteer, who was aware of his right to withdraw from the study at any time without jeopardy. The study was conducted in accordance with the Declaration of Helsinki. The protocol was approved by the Comite´s d’Ethique des Hoˆpitaux Universitaires Genevois (Switzerland). The experiments were carried out at Geneva, Switzerland.
Measurements. V˙O2was determined on a breath-by-breath basis.
The time course of O2 and CO2 partial pressures throughout the
respiratory cycles were continuously monitored with a mass spec-trometer (Balzers Prisma, Balzers, Liechtenstein) calibrated against gas mixtures of known composition. The inspiratory and expiratory ventilations were measured by an ultrasonic flowmeter (Spiroson; Ecomedics, Duernten, Switzerland) calibrated with a 3-liter syringe. The alignment of traces was corrected for the time delay between the flowmeter and the mass spectrometer. Breath-by-breath V˙O2and CO2
output (V˙CO2) were then computed off-line by means of a modified
version of Grønlund’s algorithm (9). Software purposely written under the Labview developing environment (Labview 5.0; National Instruments, Austin, TX) was used. The characteristics and physio-logical implications of Grønlund’s algorithm are widely discussed elsewhere (9, 11, 27).
fHand arterial oxygen saturation (SaO2) were continuously
mea-sured using electrocardiography (Elmed ETM 2000; Heiligenhaus, Germany) and fingertip infrared oximetry (Ohmeda 2350; Finapres, Englewood, CO), respectively. In hypoxia, SaO2data were corrected
for time delay between lungs and fingertip (30). Continuous record-ings of arterial pulse pressure were obtained at a fingertip of the right arm by means of a noninvasive cuff pressure recorder (Portapres; FMS, Amsterdam, The Netherlands). Beat-by-beat mean arterial pres-sure (P) was computed as the integral mean of each prespres-sure profile using the Beatscope software package (FMS).
The stroke volume of the heart (Qst) was determined on a
beat-by-beat basis by means of the model flow method (53), applied off-line to the pulse pressure profiles, again using the Beatscope software package. Beat-by-beat Q˙ was computed as the product of single-beat Qsttimes the corresponding single-beat fH. Correction for the
inaccu-racy of the method was applied as previously described (2, 27, 50). To this purpose, steady-state Q˙ values also were obtained by means of the open-circuit acetylene method (4) using a procedure that was previ-ously described (27). Individual correction factors at rest and at each workload were calculated as previously described (27) and also applied during dynamic states with rapid changes in Q˙ (51).
Exercise was carried out on an electrically braked cycle ergometer (Ergometrics 800-S; Ergoline, Bitz, Germany). The pedaling fre-quency was recorded, and its sudden increase at the exercise onset and decrease at the exercise offset were used as markers to identify precisely the start and the end of exercise. The electromechanical characteristics of the ergometer were such as to permit workload application in⬍50 ms. All the signals were digitalized in parallel by a 16-channel analog-to-digital converter (MP100; Biopac Systems, Goleta, CA) and stored on a computer. The acquisition rate was 100 Hz.
Blood hemoglobin concentration ([Hb]) was measured using a photometric technique (HemoCue, A¨ ngelholm, Sweden) on 10-l blood samples from a peripheral venous line inserted in the left forearm. Blood lactate concentration ([La]b) was measured using an
electroenzymatic method (Eppendorf EBIO 6666, Erlangen, Ger-many) on 20-l blood samples from the same venous line. Arterial blood gas composition was measured with microelectrodes (Instru-mentation Laboratory Synthesis 10, Lexington, MA) on 300-l blood samples taken from an arterial catheter inserted in the left radial artery.
Protocol. Experiments were first performed in normoxia and then
in acute normobaric hypoxia (fraction of inspired O2, 0.11; inspired
O2partial pressure, 80 mmHg). In hypoxia, inspired gas was
admin-istered from high-pressure gas cylinders via an 80-liter Douglas bag buffer. The fraction of inspired O2was monitored on the inspiratory
line, close to the mouth. The gas flow from the cylinders was continuously adjusted to the subject’s ventilation. Experiments in hypoxia were preceded by a 10-min period for gas store equilibration. The experimental protocol started with the performance of blood sampling and the measurement of acetylene Q˙ at rest, and then 2 min of quiet resting recordings were allowed, after which the exercise at 50 W started, for a duration of 10 min. Arterial blood gas composition and [La]bwere measured at minute 5 and at the end of exercise. At
minute 7, the measurement of Q˙ with the acetylene technique was
initiated. The 50-W exercise was followed by a 10-min recovery, during which [La]bwas measured at minutes 2, 4, and 6, and arterial
blood gas composition was determined at minutes 5 and 10. The 100-W exercise was then carried out, for a 10-min duration, and with the same timing of events as at 50 W. A 10-min recovery followed, with the same characteristics as the previous one. The overall duration of this protocol was about 60 min, during which [Hb] was systemat-ically measured at 1-min intervals.
Each subject repeated this protocol four times, in both normoxia and hypoxia. At each repetition, the performance of blood sampling for [Hb] determination was shifted by 15 s, as previously described (27), to obtain, after superposition of the four tests, an overall description of the changes in [Hb] on a 15-s time basis.
Data treatment. The superimposed time course of [Hb] was
smoothed by a four-sample mobile mean, to account for interrepeti-tion variability, and interpolated by means of a 6th degree polynomial, as previously described (27). The continuous SaO2traces from the four
repetitions were temporally aligned and superimposed by means of an ensemble average procedure. The resulting overall SaO2trace was then
interpolated by means of a 6th degree polynomial. The resulting functions, describing the time course of [Hb] and SaO2, were used to
compute the time course of arterial O2concentration (CaO2, ml/l) on
an equivalent beat-by-beat time scale, established after the pulse pressure profile traces, as in a previous study (27).
The beat-by-beat fH, Qst, P, and Q˙ values from the four repetitions
of each subject were aligned temporally by setting the time of exercise start as time 0 for the analysis of on kinetics. The data were then averaged on a beat-by-beat basis to obtain a single averaged, super-imposed time series for each parameter and subject. Beat-by-beat Q˙ a
O2was then calculated as
Q˙ aO2共t兲 ⫽ Q˙共t兲 ⫻ CaO2共t兲 (1)
Beat-by-beat total peripheral resistance (Rp) was calculated by
dividing each P value by the corresponding Q˙ value, on the assump-tion that the pressure in the right atrium can be neglected as a determinant of peripheral resistance.
Based on the conclusions arrived at in a previous study (27), the kinetics of V˙O2, Q˙ , and Q˙aO2were described by means of a two-phase
model, whereby an exponential increase in flow (phase II) is preceded by a faster flow increase in the first seconds of exercise (phase I), which Barstow and Mole´ (5) also treated as an exponential. To compute the characteristic parameters of the exponential equations describing phase I, the four repetitions were interpolated to 1-s intervals (28) and then aligned temporally, as described above, and averaged to obtain a single superimposed time series (27). Since the tested hypothesis concerns specifically a phenomenon that takes place during phase I, in the results we report only the phase I parameters, neglecting the phase II parameters, to which the tested hypothesis does not pertain.
Statistics. Data are means and standard deviations of the values
obtained for each parameter from the average superimposed files of each subject, to account for interindividual variability. The effects of exercise intensity and hypoxia on the investigated parameters were analyzed separately using a one-tailed t-test for paired observations. Bonferroni correction was then applied. The parameters of the models were estimated by utilizing a weighted nonlinear least squares
proce-R625 OXYGEN FLOW KINETICS IN HYPOXIA
AJP-Regul Integr Comp Physiol•VOL 295 • AUGUST 2008 •www.ajpregu.org
on November 14, 2008
ajpregu.physiology.org
dure (10), implemented under Labview (version 5.0; National Instru-ments, Austin TX). Initial guesses of the parameters of the model were entered after visual inspection of the data. The effects of exercise intensity and hypoxia on these values were investigated using a one-tailed t-test for paired observations. The results were considered significant if P⬍ 0.025.
RESULTS
The [Hb], SaO2, and CaO2values at rest and at the exercise
steady state are reported in Table 1, together with arterial blood pH, PO2, and PCO2. The SaO2and CaO2values in hypoxia were
lower than the corresponding values in normoxia. Arterial blood pH was higher in hypoxia than in normoxia and was unaffected by the exercise intensity in both conditions. PO2and PCO2 were both lower in hypoxia than in normoxia. In the latter, they did not vary at exercise. In hypoxia, PO2decreased during exercise (P⬍ 0.025) and PCO2tended to decrease (not significant, NS). In normoxia, [La]bwas 1.3⫾ 0.3 mM at rest and did not change at exercise. In hypoxia, [La]bwas 2.0⫾ 0.5 mM at rest and 2.3⫾ 0.5 mM at 50 W (NS). At 100 W, [La]b increased to 3.7⫾ 1.3 mM at minute 5 and 4.5 ⫾ 1.7 mM at
minute 10.
The mean values for Q˙ , fH, Qst, P, Rp, Q˙ aO2, and V˙O2,
obtained at rest and at the exercise steady state at both powers, are reported in Table 2. At all metabolic powers, fHwas higher in hypoxia than in normoxia. Qstwas the same in hypoxia as in normoxia so that Q˙ resulted systematically higher in hypoxia than in normoxia. At rest, P was lower in hypoxia than in normoxia, but this difference disappeared at exercise. As a consequence, systematically lower Rpvalues were found in hypoxia than in normoxia (NS at rest, P ⬍ 0.025 at 50 and 100 W). Q˙ aO2was not significantly different from normoxia at rest. At 50 and 100 W, however, Q˙ aO2 turned out lower in hypoxia than in normoxia. V˙O2was the same in hypoxia as in normoxia.
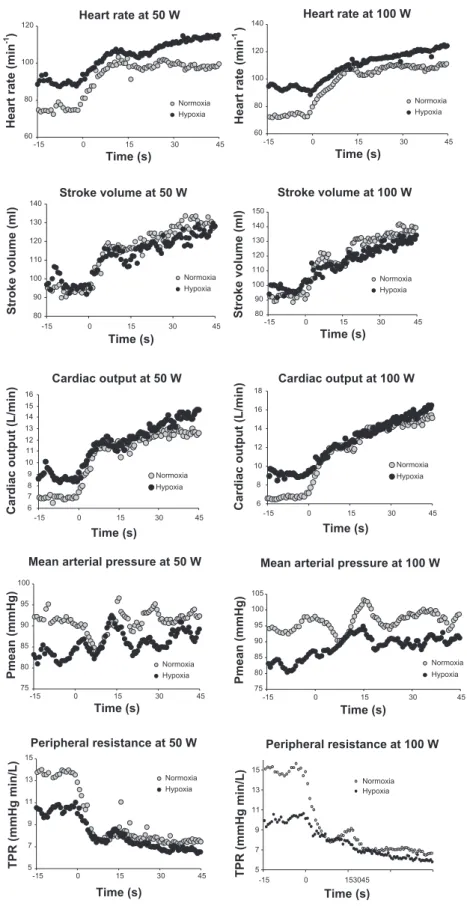
The time courses of fH, Qst, Q˙ , P, and Rpupon the onset of 50- and 100-W exercise are shown in Fig. 1. Beat-by-beat data collected in the 15 s that preceded and in the 45 s that followed the start of exercise are shown in Fig. 1, to draw attention to phase I events. In normoxia, a steady state for fHappeared as
soon as phase I was completed at 50 W, whereas a clear slower phase II increase was evident at 100 W. In hypoxia, the relative contribution of phase I to the fH response was less than in normoxia. The time course of Qstwas the same in hypoxia as in normoxia. Thus the initial change of Q˙ in hypoxia, compared with normoxia, followed essentially the same patterns as for fH. The increase in P was modest and slow, in both normoxia and hypoxia. Conversely, Rp underwent a sudden dramatic de-crease, the amplitude of which was smaller in hypoxia than in normoxia.
The evolution of beat-by-beat fH as a function of beat-by-beat P is shown in Fig. 2. For both normoxia and hypoxia, the resting values are located on the lower left side of the plot, and the exercise steady-state values are located on the upper right side. However, the resting values in hypoxia were displaced upward and leftward with respect to those in normoxia, as were the exercise values. In normoxia, at both workloads, the pattern of displacement of the baroreflex operational point from rest to exercise was dictated by the rapid increase in fH, as demonstrated by the small number of points required to attain the cluster of the fHand P values at exercise. Similar patterns were observed in hypoxia, although 1) the size of the displacement of baroreflex operational point was larger than in normoxia, and 2) the number of beats required to complete this displacement in hypoxia (within 30 and 60 beats at 50 and 100 W, respectively) was greater (slower increase) than in normoxia (within 20 and 45 beats at 50 and 100 W, respectively).
In normoxia, since SaO2 was unchanged, the evolution of
CaO2 followed the changes in [Hb]. In hypoxia, CaO2
under-went larger changes than in normoxia, which were dictated not only by the changes in [Hb] but also by the decrease in SaO2in
the exercise transient. In hypoxia, a steady CaO2 level lower
than at rest was attained within 2 min.
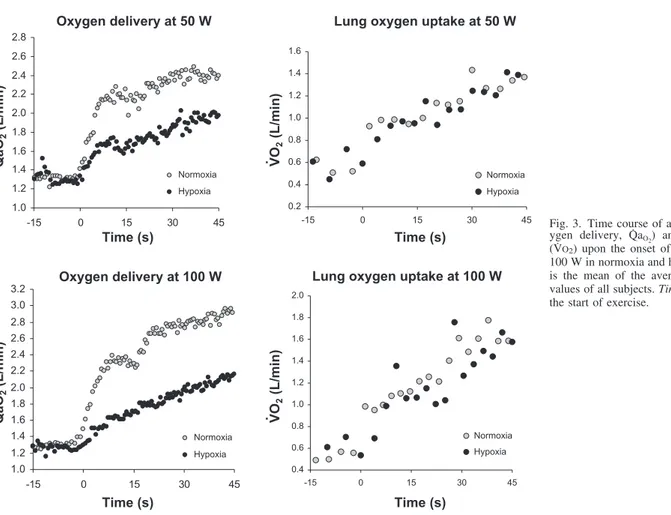
The time courses of Q˙ aO2and V˙O2upon the onset of 50- and 100-W exercise are reported in Fig. 3. The rate of readjustment Table 1. Oxygen, hemoglobin, and pH in arterial blood
Workload Rest 50 W 100 W Normoxia [Hb], g/l 147.4⫾10.0 149.8⫾9.7 153.4⫾10.6 SaO2 0.965⫾0.007 0.965⫾0.004 0.956⫾0.012 CaO2, ml/l 190.5⫾12.7 193.7⫾12.1 196.4⫾11.6 pH 7.41⫾0.01 7.42⫾0.01 7.41⫾0.01 PaO2, mmHg 85.8⫾3.9 88.6⫾3.2 86.4⫾2.1 PaCO2, mmHg 38.4⫾1.6 36.8⫾1.6 37.7⫾2.4 Hypoxia [Hb], g/l 151.9⫾9.3 153.1⫾10.8 155.5⫾10.9 SaO2 0.676⫾0.046* 0.608⫾0.055* 0.578⫾0.075* CaO2, ml/l 137.7⫾14.5* 121.5⫾34.9* 121.0⫾22.4* pH 7.47⫾0.02* 7.48⫾0.02* 7.48⫾0.02* PaO2, mmHg 39.5⫾5.1* 35.2⫾3.3* 33.2⫾2.9* PaCO2, mmHg 31.7⫾2.2* 30.9⫾2.3* 27.9⫾1.9*
Values are means⫹ SD of steady-state values. [Hb], blood hemoglobin concentration; SaO2, arterial O2saturation; CaO2, arterial O2concentration; PaO2, arterial partial pressure of O2; PaCO2, arterial partial pressure of CO2. *P⬍ 0.25, significantly different from corresponding value in normoxia.
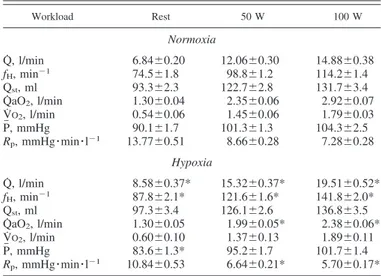
Table 2. Steady-state values of cardiopulmonary parameters
at rest and at exercise at 50 and 100 W
Workload Rest 50 W 100 W Normoxia Q˙ , l/min 6.84⫾0.20 12.06⫾0.30 14.88⫾0.38 fH, min⫺1 74.5⫾1.8 98.8⫾1.2 114.2⫾1.4 Qst, ml 93.3⫾2.3 122.7⫾2.8 131.7⫾3.4 Q˙ aO2, l/min 1.30⫾0.04 2.35⫾0.06 2.92⫾0.07 V˙O2, l/min 0.54⫾0.06 1.45⫾0.06 1.79⫾0.03 P, mmHg 90.1⫾1.7 101.3⫾1.3 104.3⫾2.5 Rp, mmHg䡠min䡠l⫺1 13.77⫾0.51 8.66⫾0.28 7.28⫾0.28 Hypoxia Q˙ , l/min 8.58⫾0.37* 15.32⫾0.37* 19.51⫾0.52* fH, min⫺1 87.8⫾2.1* 121.6⫾1.6* 141.8⫾2.0* Qst, ml 97.3⫾3.4 126.1⫾2.6 136.8⫾3.5 Q˙ aO2, l/min 1.30⫾0.05 1.99⫾0.05* 2.38⫾0.06* V˙O2, l/min 0.60⫾0.10 1.37⫾0.13 1.89⫾0.11 P, mmHg 83.6⫾1.3* 95.2⫾1.7 101.7⫾1.4 Rp, mmHg䡠min䡠l⫺1 10.84⫾0.53 6.64⫾0.21* 5.70⫾0.17* Values are means⫹ SD of single-beat values over 1 min at rest and exercise steady state. Q˙ , cardiac output; fH, heart rate; Qst, stroke volume; Q˙ aO2, systemic O2delivery; V˙O2, O2uptake; P, mean arterial pressure; Rp, peripheral resistance. *P ⬍ 0.025, significantly different from corresponding value in normoxia.
on November 14, 2008
ajpregu.physiology.org
of V˙O2followed the same trend in hypoxia as in normoxia. In normoxia, it was slower than that of Q˙ aO2. This difference disappeared in hypoxia, because the rate of readjustment of Q˙ aO2 was slower in hypoxia than in normoxia.
The characteristic parameters describing the Q˙ , Q˙aO2, V˙O2,
and fH kinetics during phase I are presented in Table 3. For V˙O2, amplitude of phase I (A1) was the same in hypoxia as in
normoxia. For Q˙ and Q˙aO2, A1 was significantly lower in
Fig. 1. Time course of investigated cardiovascular parame-ters upon the onset of exercise at 50 and 100 W in normoxia and hypoxia. Values are shown for heart rate, stroke volume, cardiac output, mean arterial pressure, and total peripheral resistance (TPR). Each value is the mean of the averaged superimposed values of all subjects. Time 0 corresponds to the start of exercise.
R627 OXYGEN FLOW KINETICS IN HYPOXIA
AJP-Regul Integr Comp Physiol•VOL 295 • AUGUST 2008 •www.ajpregu.org
on November 14, 2008
ajpregu.physiology.org
hypoxia than in normoxia. In both normoxia and hypoxia, A1 was the same at 100 W as at 50 W. For Q˙ aO2and V˙O2,1was unaffected by hypoxia. For Q˙ ,1was shorter in hypoxia than in normoxia at 50 W but not at 100 W. For fH, A1was lower in hypoxia than in normoxia at 50 W but not at 100 W. In normoxia, A1was the same at 50 W as at 100 W, as it was in hypoxia.1was higher in hypoxia than in normoxia at 100 W but not at 50 W. In hypoxia,1was significantly greater at 100 W than at 50 W.
DISCUSSION
This study was carried out to test the hypothesis that vagal withdrawal determines the phase I kinetics of Q˙ , Q˙aO2, and V˙O2 at exercise onset. This hypothesis implies that phase I would be either absent or eventually less intense compared with nor-moxia. The main finding of this study is that the amplitude of the phase I (A1) of the kinetics of Q˙ and Q˙aO2at exercise onset was smaller in acute normobaric hypoxia, wherein reduced vagal activity (8, 26) and increased sympathetic activity at rest have been postulated (21, 26, 58, 59), than in normoxia, whereas its time constant 1 was unchanged. No differences appeared concerning the phase I of V˙O2kinetics. In hypoxia,
the reductions in A1are coherent with the concept of a lesser effect of postulated vagal withdrawal at exercise onset.
Steady-state data. The increased sympathetic activity to the
heart in acute hypoxia (21, 22, 44, 45), perhaps through peripheral chemoreceptor stimulation (22), may be sufficient to explain the higher fHin hypoxia than in normoxia, both at rest and at any given work level. Since Qstis unaffected by acute hypoxia, the increase in fHentails a corresponding increase in Q˙ , as already demonstrated in several studies (1, 23, 49). The present data (see Table 2) are in full agreement with this picture.
A larger sympathetic activity, if directed to peripheral ves-sels as well, might also imply peripheral vasoconstriction and, hence, a greater Rpin hypoxia than in normoxia. However, this was not so in the present study, since Rp(Table 2) was lower in hypoxia than in normoxia, whether at rest or at the two investigated workloads, because a higher Q˙ was associated with an unchanged P. Rpwas rarely looked at in hypoxia in the past, yet it was possible to compute it from some studies (1, 23, 49). The obtained data are coherent with those of the present study. Moreover, increased peripheral sympathetic activation in hypoxia, though providing a potent peripheral vasoconstric-tion stimulus, is not accompanied by increased leg vascular resistance at rest, which was rather found to be reduced compared with normoxia (22).
This apparent contradiction may be explained by admitting either of these three hypotheses : 1) hypoxemia reduces the sensitivity and increases the activation threshold of vascular sympathetic receptors (sympatholysis); 2) hypoxemia superim-poses a vasodilating stimulus in peripheral circulation; or 3) the intensity and quality of sympathetic output may differ among various target organs in hypoxia. The first hypothesis was recently contradicted by the demonstration that the vascular response to tyramine is not reduced in hypoxia (56). The two other hypotheses were supported by the observation of  2-mediated vasodilatation in resting skeletal muscle in hypoxia due to increased adrenaline release (52). Peripheral O2sensing mechanisms may be implied in this effect. For instance, ac-cording to Stamler et al. (48), the conformation of the reduced hemoglobin determines the rise of nitric oxide (NO) in blood with consequent vasodilatation. In contradiction to this, how-ever, Weisbrod et al. (52) failed to show a reduction of peripheral hypoxic vasodilatation after NO synthase blockade. Other SaO2-related mechanisms were postulated, which would
imply ATP-mediated vasodilatation (32). A clear picture of the events that lead to decreased Rpis still far from being estab-lished.
Phase I kinetics. The hypothesis that vagal withdrawal
determines phase I relies essentially on observations made on
fHupon exercise onset in normoxia, the kinetics of which were similar in this and previous studies (6, 18, 37, 46). In fact, the fast component of fHkinetics 1) was cancelled out under vagal blockade (18) and 2) was not found in heart transplant recip-ients, whose hearts are denervated (3, 20, 40). To extend this hypothesis to explain phase I kinetics of Q˙ , Q˙aO2, and V˙O2, we
should be able to demonstrate that when vagal tone is attenu-ated, as is the case in acute normobaric hypoxia (26), the phase I should either be reduced or disappear for all these parameters. Indeed, hypoxia reduced A1 significantly, for Q˙ and Q˙aO2 (Table 3) at both 50 and 100 W and for fHat 50 W, but did not extinguish it. On the other hand, hypoxia acted very little on1, Fig. 2. Beat-by-beat heart rate as a function of the corresponding beat-by-beat
mean arterial pressure (Pmean) upon the onset of exercise at 50 and 100 W in normoxia and hypoxia. The resting values are located on at bottom left; the exercise steady-state values are at top right. The resting values in hypoxia are displaced upward and leftward with respect to the corresponding values in normoxia. The pattern of displacement of the heart rate vs. Pmean operational range from rest to exercise is completed, at 50 W, within 20 and 30 beats, and at 100 W, within 45 and 60 beats, in normoxia and hypoxia, respectively.
on November 14, 2008
ajpregu.physiology.org
whose very low values were essentially invariant; we noticed only a reduction at 50 W for Q˙ and an increase at 100 W for
fH. This would mean that 1) the1values in hypoxia also are compatible with a very rapid neural phenomenon, vagal with-drawal, as originally proposed by Fagraeus and Linnarsson (18) for normoxia; 2) vagal withdrawal has a smaller amplitude in hypoxia than in normoxia because of lesser vagal activation in the former; and 3) the patterns in the time domain of vagal withdrawal at exercise onset are fixed and invariant.
However, the occurrence of phase I in hypoxia with a smaller amplitude, instead of a full suppression of it, may imply that 1) hypoxia did not fully suppress vagal activity at rest so that some degree of vagal withdrawal still took place at exercise onset, or 2) other mechanisms than vagal withdrawal participate in phase I. The former may indeed be the case for
fH. The latter is suggested by the apparent lack of changes in the Qstkinetics in hypoxia with respect to normoxia (Fig. 1). In the absence of a clear predetermined model for the Qstkinetics, whereby we refrained from fitting parameters through Qstdata, we evaluated the contribution of Qstto Q˙ A1, as follows. Since Q˙ is the product of fHtimes Qst, the absolute Q˙ value at the peak
of phase I is equal to
Q˙ ⫹ ⌬Q˙ ⫽ 共 fH⫹ ⌬fH兲 ⫻ 共Qst⫹ ⌬Qst兲 (2) where Q˙ , fH, and Qstare the resting values and⌬Q˙, ⌬fH, and ⌬Qstare the corresponding increments during phase I, namely, the respective A1 values. Solution of this equation for ⌬Qst thus provides an estimate of the Qstamplitude during phase I that is necessary to sustain the observed increase in Q˙ . At 50 W,⌬Qstwas 23.9⫾ 10.5 and 14.7 ⫾ 7.1 ml in normoxia and hypoxia, respectively. The corresponding⌬Qstvalues at 100 W were 33.1⫾ 9.3 and 24.2 ⫾ 21.2 ml. At both powers, although affected by a large scatter,⌬Qstdid not differ in hypoxia from normoxia (P⬎ 0.1 in both cases), suggesting that, contrary to
fH, the alleged amplitude of Qstin phase I may not vary in hypoxia with respect to normoxia. This being the case, then
1) if indeed the reduction of the A1of fHin hypoxia is due to
lesser vagal withdrawal, then the same should be the case for Fig. 3. Time course of arterial O2flow (ox-ygen delivery, Q˙ aO2) and lung O2 uptake
(V˙O2) upon the onset of exercise at 50 and 100 W in normoxia and hypoxia. Each value is the mean of the averaged superimposed values of all subjects. Time 0 corresponds to the start of exercise.
Table 3. Kinetics of systemic O2delivery, O2uptake,
and cardiac output within the two-phase model
50 W 100 W A1, l/min 1, s A1, l/min 1, s Q˙ Normoxia 4.57⫾0.61 3.14⫾1.91 5.24⫾1.26 3.39⫾1.66 Hypoxia 2.52⫾0.90* 1.57⫾0.64* 3.71⫾1.75* 5.75⫾4.09§ Q˙ aO2 Normoxia 0.70⫾0.07 2.81⫾1.43 0.72⫾0.19 2.38⫾1.81 Hypoxia 0.38⫾0.16* 2.20⫾0.86 0.36⫾0.08* 3.22⫾1.61 V˙O2 Normoxia 0.39⫾0.14 0.55⫾0.58 0.52⫾0.11 1.56⫾1.68 Hypoxia 0.35⫾0.07 2.36⫾0.59 0.45⫾0.17 3.14⫾0.68 fH Normoxia 22.44⫾3.00 2.82⫾1.31 22.92⫾9.45 2.64⫾2.11 Hypoxia 14.50⫾5.59* 2.08⫾1.88 20.72⫾13.29 4.46⫾2.26*§ Data are means⫾ SD. A1, amplitude of phase I change;1, time constant of phase I. *P⬍ 0.025, significantly different from corresponding value in normoxia. §P⬍ 0.025, significantly different from corresponding value at 50 W.
R629 OXYGEN FLOW KINETICS IN HYPOXIA
AJP-Regul Integr Comp Physiol•VOL 295 • AUGUST 2008 •www.ajpregu.org
on November 14, 2008
ajpregu.physiology.org
the reduction of the A1of Q˙ ; and 2) the Qstchanges during an exercise transient are independent of mechanisms related to vagal withdrawal. Concerning the latter, in supine posture, a condition in which central blood volume is increased (24, 29, 47), phase I of Q˙ is not evident (25, 29), although resting vagal activation is greater supine than upright (25, 38). A higher central blood volume would reduce the amount of blood suddenly displaced from the periphery to the heart by muscle pump action, and thus the size of the immediate increase in venous return, thus preventing an efficient Frank-Starling mechanism. In the present study exercise was carried out in upright posture only, so it is likely that the increase in venous return due to muscle pump action would be the same in hypoxia as in normoxia, whence equivalent Qstkinetics.
In both normoxia and hypoxia, the 1of V˙O2kinetics was extremely rapid and functionally instantaneous, indicating a practically immediate upward translation of V˙O2 that appears since the first breath. The 1 of V˙O2 did not differ between powers and can be considered equal to those of Q˙ and Q˙aO2 (Table 3), given that the minimal functional time window in which V˙O2 can be determined is one breathing cycle. This suggests that the phase I changes in V˙O2are imposed by the corresponding phase I changes in Q˙ . Because of a delay between muscle O2consumption and V˙O2, we can assume that
during the first seconds of exercise, arterial-venous O2 differ-ence (CaO2-CvO2) remains equal to that at rest (5). On this
basis, the Fick principle allows a prediction of the expected V˙O2increase in phase I as a consequence of the observed Q˙ increase. In normoxia, A1of Q˙ was on average 4.57 l/min (see Table 3). For an average resting CaO2-CvO2 of 79 ml/l, we
would expect an immediate V˙O2increase upon exercise start of 0.36 l/min, compared with a measured A1of V˙O2of 0.39 l/min (Table 3). By analogy, in hypoxia, A1of Q˙ was on average 2.52 l/min (Table 3), and the resting CaO2-CvO2was 70 ml/l.
Thus the expected V˙O2increase would be 0.18 l/min, compared with a measured A1of V˙O2of 0.35 l/min (Table 3). Despite this sizeable discrepancy, the two values are not significantly dif-ferent, probably because of the relatively large coefficient of variation of the data in hypoxia. Nevertheless, the results of this analysis suggest that A1 of V˙O2 may be a direct conse-quence of the rapid Q˙ increase during phase I, in agreement with the so-called cardiodynamic hypothesis of lung V˙O2 transients (55).
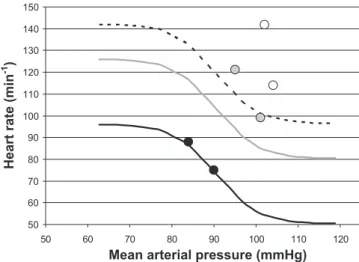
Baroreflex resetting. At rest in normoxia, P was 90 mmHg
and fHwas 74.5 min-1. Let us assume that these values set the operating point of the average baroreflex curve of present subjects and that the operating point of resting subjects in normoxia corresponds to the centering point of the baroreflex curve (42). Assume also that the maximal gain and the oper-ating range of the baroreflex curve are as previously reported (36). On this basis, we can construct a resting baroreflex response curve for the present subjects, which is reported in Fig. 4. If we then add the average resting value observed in hypoxia to that curve, we can see that the subjects operated in hypoxia on the same baroreflex curve as in normoxia, with a displacement of the operating point along the curve toward the threshold. This is a result of the decrease in P induced by peripheral vasodilation, to which the subjects responded with an increase in fH, supporting the notion that peripheral vascular
changes play a significant role in the baroreflex response of resting humans (17, 35). If indeed hypoxemia induces
vasodi-lation in peripheral circuvasodi-lation via2-sympathetic stimulation, then we can propose a role for peripheral chemoreflexes in the displacement of the baroreflex operating point in hypoxia.
Exercise displaces the baroreflex curve upward and right-ward, without changes in gain [baroreflex resetting (42)]. This phenomenon is part of the rapid cardiovascular response upon exercise start. Baroreflex resetting includes a fast phase (Fig. 2), completed within a few heartbeats, within the duration of phase I, which goes on in parallel with the rapid changes in Rp that take place at exercise start. However, the dynamics of baroreflex resetting implied a larger number of heartbeats in hypoxia than in normoxia. If vagal withdrawal sets phase I of
fH, then it will also contribute to the rapid upward shift of the baroreflex curve, but its role in baroreflex resetting will be less important in hypoxia than in normoxia.
Figure 4 also reports baroreflex curves for 50- and 100-W exercises, which are shifted upward as much as described in previous studies (34, 35, 39, 41). When the 50- and 100-W steady-state P and fHvalues were added to Fig. 4, they were further displaced upward and rightward with respect to the predicted exercise baroreflex curve, suggesting that in the present study, baroreflex resetting was somewhat more in-tense than previously reported. Moreover, at both 50 and 100 W, the segment relating the experimental point in normoxia to the experimental point in hypoxia had a greater slope than the expected baroreflex gain, suggesting that the latter experimental point may lie on a different baroreflex curve than the former in both cases. A 50-W exercise provides a higher power relative to the maximum in hypoxia Fig. 4. Baroreflex response curve at rest and exercise steady state. Heart rate (fH) as a function of mean arterial pressure (P). Theoretical baroreflex curves are shown for rest (solid curve), exercise at 50 W (shaded curve), and exercise at 100 W (dashed curve). The curve at rest was constructed using the present mean resting values of P to define the baroreflex operating point and assuming 1) that the operating point of resting subjects in normoxia corresponds to the center point (42) and 2) that the maximal gain and the operating range of the baroreflex curve are as previously reported (36). The two curves at exercise were built by shifting the former upward by an amount equal to the average reported in previous studies (34, 35, 39, 41), assuming that the gain and operating ranges do not change at exercise steady state. The average steady-state values observed at rest (solid circles), exercise at 50 W (shaded circles), and exercise at 100 W (open circles) in normoxia and hypoxia are also indicated. At rest, the point in hypoxia is displaced upward and leftward, on the corresponding theoretical baroreflex curve. At exercise, the points do not lie on the corresponding theoretical baroreflex curve but are further displaced upward and rightward.
on November 14, 2008
ajpregu.physiology.org
than in normoxia because of the decrease in maximal O2 uptake in hypoxia, whereby implying a greater role of the chemical component of the exercise pressor reflex (42). Yet we cannot distinguish the relative roles of central command or of the exercise pressor reflex in determining baroreflex resetting from the present data (42).
Conclusions. We conclude that in hypoxia, with respect to
normoxia, 1) phase I is not completely suppressed for fH, although the A1for fHis decreased, likely because the degree of vagal withdrawal is less; 2) since phase I is partly main-tained, arterial baroreflex resetting continues to be very rapid, taking place essentially within phase I; 3)⌬Qstis unchanged, because the increase in venous return due to muscle pump action is unchanged; 4) the coupling of a decreased A1for fH with an unchanged⌬Qstwould produce the observed decrease in A1of Q˙ ; and 5) the same factors that determine the phase I of Q˙ are also responsible for the phase I of V˙O2. Thus the
present results provide only partial support to the hypothesis that vagal withdrawal determines the phase I kinetics of car-diovascular O2flow and lung O2uptake, because the suppres-sion of phase I was incomplete. Although we can attribute the decrease in A1 of fH to a diminished degree of vagal with-drawal in hypoxia, this is not so for Qst. Under these circum-stances, the dual origin of the phase I of Q˙ and Q˙aO2, neural (vagal) and mechanical (increase in venous return by muscle pump action), would rather be confirmed.
GRANTS
This study was supported by Swiss National Science Foundation Grants 3200-061780 and 3200B0-114033 (to G. Ferretti) and Italian Space Agency Contract DCMC-1B133 (to C. Capelli).
REFERENCES
1. Anchisi S, Moia C, Ferretti G. Oxygen delivery and oxygen return in humans exercising in acute normobaric hypoxia. Pflu¨gers Arch 442: 443– 450, 2001.
2. Azabji Kenfack M, Lador F, Licker MJ, Moia C, Tam E, Capelli C, Morel D, Ferretti G. Cardiac output by model flow method from intra-arterial and finger tip pulse pressure profiles. Clin Sci (Lond) 106: 365–369, 2004.
3. Banner NR, Guz A, Heaton R, Innes JA, Murphy K, Yacoub M. Ventilatory and circulatory responses at the onset of exercise in man following heart or heart-lung transplantation. J Physiol 399: 437– 449, 1989.
4. Barker RC, Hopkins SR, Kellogg N, Olfert IM, Brutsaert TD, Gavin TP, Entin PL, Rice AJ, Wagner PD. Measurement of cardiac output by open-circuit acetylene technique. J Appl Physiol 87: 1506 –1512, 1999. 5. Barstow TJ, Mole´ PA. Simulation of pulmonary O2 uptake during
exercise transients in humans. J Appl Physiol 63: 2253–2261, 1987. 6. Baum K, Essfeld D, Leyk D, Stegemann J. Blood pressure and heart rate
during rest-exercise and exercise-rest transitions. Eur J Appl Physiol 64: 134 –138, 1992.
7. Binzoni T, Ferretti G, Schenker K, Cerretelli P. Phosphocreatine hydrolysis by 31P-NMR at the onset of constant-load exercise. J Appl
Physiol 73: 1644 –1649, 1992.
8. Buchheit M, Richard R, Doutreleau S, Lonsdorfer-Wolf E, Branden-berger G, Simon C. Effect of acute hypoxia on heart rate variability at rest and during exercise. Int J Sports Med 25: 264 –269, 2004. 9. Capelli C, Cautero M, di Prampero PE. New perspectives in
breath-by-breath determination of alveolar gas exchange in humans. Pflu¨gers
Arch 441: 566 –577, 2001.
10. Carson ER, Cobelli C, Finkelstein L. The Mathematical Modelling of
Metabolic and Endocrine Systems. New York: Wiley, 1983, p. 179 –216.
11. Cautero M, Beltrami AP, di Prampero PE, Capelli C. Breath-by-breath alveolar oxygen transfer at the onset of step exercise in humans. Eur
J Appl Physiol 88: 203–213, 2002.
12. Cummin AR, Iyawe VI, Mehta N, Saunders KB. Ventilation and cardiac output during the onset of exercise, and during voluntary hyper-ventilation, in humans. J Physiol 370: 567–583, 1986.
13. De Cort SC, Innes JA, Barstow TJ, Guz A. Cardiac output, oxygen consumption and arterio-venous oxygen difference following a sudden rise in exercise level in humans. J Physiol 441: 501–512, 1991.
14. Di Prampero PE, Francescato MP, Cettolo V. Energetics of muscle exercise at work onset: the steady-state approach. Pflu¨gers Arch 445: 741–746, 2003.
15. Di Prampero PE, Margaria R. Relationship between O2consumption, high energy phosphates, and the kinetics of the O2 debt in exercise.
Pflu¨gers Arch 304: 11–19, 1968.
16. Eriksen M, Waaler BA, Walloe L, Wesche J. Dynamics and dimensions of cardiac output changes in humans at the onset and the end of moderate rhythmic exercise. J Physiol 426: 423– 437, 1990.
17. Fadel PJ, Ogoh S, Watenpaugh DE, Wasmund W, Olivencia-Yurvati A, Smith ML, Raven PB. Carotid baroreflex regulation of sympathetic nerve activity during dynamic exercise in humans. Am J Physiol Heart
Circ Physiol 280: H1383–H1390, 2001.
18. Fagraeus L, Linnarsson D. Autonomic origin of heart rate fluctuations at the onset of muscular exercise. J Appl Physiol 40: 679 – 682, 1976. 19. Gallagher KM, Fadel PJ, Smith SA, Strømstad M, Ide K, Secher NH,
Raven PB. The interaction of central command and the exercise pressor reflex in mediating baroreflex resetting during exercise in men. Exp
Physiol 91: 79 – 87, 2006.
20. Grassi B, Marconi C, Meyer M, Rieu M, Cerretelli P. Gas exchange and cardiovascular kinetics with different exercise protocols in heart transplant recipients. J Appl Physiol 82: 1952–1962, 1997.
21. Halliwill JR, Minson CT. Effect of hypoxia on arterial baroreflex control of heart rate and muscle sympathetic nerve activity in humans. J Appl
Physiol 93: 857– 864, 2002.
22. Hanada A, Sander M, Gonzalez-Alonso J. Human skeletal muscle sympathetic nerve activity, heart rate and limb haemodynamics with reduced blood oxygenation and exercise. J Physiol 551: 635– 647, 2003. 23. Hartley LH, Vogel JA, Landowne L. Central, femoral and brachial circulation during exercise in hypoxia. J Appl Physiol 34: 87–90, 1973. 24. Hughson RL, Cochrane JE, Butler GC. Faster O2uptake kinetics at
onset of supine exercise with than without lower body negative pressure.
J Appl Physiol 75: 1962–1967, 1993.
25. Hughson RL, Yamamoto Y, McCullough RE, Sutton JR, Reeves TJ. Sympathetic and parasympathetic indicators of heart rate control at alti-tude studied by spectral analysis. J Appl Physiol 77: 2537–2542, 1994. 26. Koller EA, Drechsel S, Hess T, Macherel P, Boutellier U. Effects of
atropine and propranolol on the respiratory, circulatory, and ECG re-sponses to high altitude in man. Eur J Appl Physiol 57: 163–172, 1988. 27. Lador F, Azabji Kenfack M, Moia C, Cautero M, Morel DR, Capelli
C, Ferretti G. Simultaneous determination of the kinetics of cardiac output, systemic O2delivery and lung O2uptake at exercise onset in men.
Am J Physiol Regul Integr Comp Physiol 290: R1071–R1079, 2006.
28. Lamarra N, Whipp BJ, Ward SA, Wasserman K. Effect of interbreath fluctuations on characterising exercise gas exchange kinetics. J Appl
Physiol 62: 2003–2012, 1987.
29. Leyk D, Essfeld D, Hoffmann U, Wunderlich HG, Baum K, Stege-mann J. Postural effect on cardiac output, oxygen uptake and lactate during cycle exercise of varying intensity. Eur J Appl Physiol 68: 30 –35, 1994.
30. Lindholm P, Karlsson L, Gill H, Wigertz O, Linnarsson D. Time components of circulatory transport from the lungs to a peripheral artery in humans. Eur J Appl Physiol 97: 96 –102, 2006.
31. Mahler M. First-order kinetics of muscle oxygen consumption, and an equivalent proportionality between QO2 and phosphorylcreatine level. Implications for the control of respiration. J Gen Physiol 86: 135–165, 1985.
32. McCullough WT, Collins DM, Ellsworth ML. Arteriolar responses to extracellular ATP in striated muscle. Am J Physiol Heart Circ Physiol 272: H1886 –H1891, 1997.
33. Meyer RA. A linear model of muscle respiration explains monoexponen-tial phosphorcreatine changes. Am J Physiol Cell Physiol 254: C548 – C553, 1988.
34. Norton KH, Boushel R, Strange S, Saltin B, Raven PB. Resetting of the carotid arterial baroreflex during dynamic exercise in humans. J Appl
Physiol 87: 332–338, 1999.
35. Ogoh S, Fadel PJ, Nissen P, Jans O, Selmer C, Secher NH, Raven PB. Baroreflex-mediated changes in cardiac output and vascular conductance R631 OXYGEN FLOW KINETICS IN HYPOXIA
AJP-Regul Integr Comp Physiol•VOL 295 • AUGUST 2008 •www.ajpregu.org
on November 14, 2008
ajpregu.physiology.org
in response to alterations in carotid sinus pressure during exercise in humans. J Physiol 550: 317–324, 2003.
36. Ogoh S, Fisher JP, Dawson EA, White MJ, Secher NH, Raven PB. Autonomic nervous system influence on arterial baroreflex control of heart rate during exercise in humans. J Physiol 566: 599 – 611, 2005. 37. Orizio C, Perini R, Comande´ A, Castellano M, Beschi M, Veicsteinas
A. Plasma catecholamines and heart rate at the beginning of muscular exercise in man. Eur J Appl Physiol 57: 644 – 651, 1988.
38. Pagani M, Lombardi F, Guzzetti S, Rimoldi O, Furlan R, Pizzinelli P, Sandrone G, Malfatto G, Dell’Orto S, Piccaluga E, Turiel M, Baselli G, Cerutti S, Malliani A. Power spectral analysis of heart rate and arterial pressure variabilities as a marker of sympatho-vagal interaction in man and conscious dog. Circ Res 59: 178 –193, 1986.
39. Papelier Y, Escourrou P, Gauthier JP, Rowell LB. Carotid baroreflex control of blood pressure and heart rate in men during dynamic exercise.
J Appl Physiol 77: 502–506, 1994.
40. Perini R, Orizio C, Gamba A, Veicsteinas A. Kinetics of heart rate and catecholamines during exercise in humans. The effect of heart denerva-tion. Eur J Appl Physiol 66: 500 –506, 1993.
41. Potts JT, Shi XR, Raven PB. Carotid baroreflex responsiveness during dynamic exercise in humans. Am J Physiol Heart Circ Physiol 265: H1928 –H1938, 1993.
42. Raven PB, Fadel PJ, Ogoh S. Arterial baroreflex resetting during exer-cise: a current perspective. Exp Physiol 91: 37– 49, 2006.
43. Rossiter HB, Ward SA, Doyle VL, Howe FA, Griffiths JR, Whipp BJ. Inferences from pulmonary O2 uptake with respect to intramuscular [phosphocreatine] kinetics during moderate exercise in humans. J Physiol 518: 921–932, 1999.
44. Rowell LB, Johnson DG, Chase PB, Comess KA, Seals DR. Hypoxemia raises muscle sympathetic activity but not norepinephrine in resting humans. J Appl Physiol 66: 1736 –1743, 1989.
45. Saito M, Mano S, Iwase K, Koga K, Abe H, Yamazaki Y. Responses in muscle sympathetic activity to acute hypoxia in humans. J Appl Physiol 65: 1548 –1552, 1988.
46. Sietsema KE, Daly JA, Wasserman K. Early dynamics of O2uptake and heart rate as affected by exercise work rate. J Appl Physiol 67: 2535–2541, 1989.
47. Spaak J, Montmerle S, Sundblad P, Linnarsson D. Long-term bed rest-induced reductions in stroke volume during rest and exercise: cardiac dysfunction vs. volume depletion. J Appl Physiol 98: 648 – 654, 2005. 48. Stamler JS, Jia L, Eu JP, Mcmahon TJ, Demchenko IT, Bonaventura
J, Gernert K, Piantadosi CA. Blood flow regulation by S-nitrosohemo-globin in the physiological oxygen gradient. Science 276: 2034 –2037, 1997.
49. Stenberg J, Ekblom B, Messin R. Hemodynamic response to work at simulated altitude, 4000 m. J Appl Physiol 21: 1589 –1594, 1966. 50. Tam E, Azabji Kenfack M, Cautero M, Lador F, Antonutto G, di
Prampero PE, Ferretti G, Capelli C. Correction of cardiac output obtained by Modelflow from finger pulse pressure profiles with a respi-ratory method in humans. Clin Sci (Lond) 106: 371–376, 2004. 51. Van Lieshout JJ, Toska K, Van Lieshout EJ, Eriksen M, Walloe L,
Wesseling KH. Beat-to-beat non-invasive stroke volume from arterial pressure and Doppler ultrasound. Eur J Appl Physiol 90: 131–137, 2003. 52. Weisbrod CJ, Minson CT, Joyner MJ, Halliwill JR. Effects of regional phentolamine on hypoxic vasodilatation in healthy humans. J Physiol 537: 613– 621, 2001.
53. Wesseling KH, Jansen JR, Settels JJ, Schreuder JJ. Computation of aortic flow from pressure in humans using a nonlinear, three-element model. J Appl Physiol 74: 2566 –2573, 1993.
54. Whipp BJ, Ward SA. Physiological determinants of pulmonary gas exchange kinetics during exercise. Med Sci Sports Exerc 22: 62–71, 1990. 55. Whipp BJ, Wasserman K. Effect of anaerobiosis on the kinetics of O2
uptake during exercise. Fed Proc 45: 2942–2947, 1986.
56. Wilkins BW, Schrage WG, Liu Z, Hancock KC, Joyner MJ. Systemic hypoxia and vasoconstrictor responsiveness in exercising human muscle.
J Appl Physiol 101: 1343–1350, 2006.
57. Williamson JW, Fadel PJ, Mitchell JH. New insights into central cardiovascular control during exercise. Exp Physiol 91: 51–58, 2006. 58. Xie A, Skatrud JB, Puleo DS, Morgan BJ. Exposure to hypoxia
produces long-lasting sympathetic activation in humans. J Appl Physiol 91: 1555–1562, 2001.
59. Yamamoto Y, Hoshikawa Y, Miyashita M. Effects of acute exposure to simulated altitude on heart rate variability during exercise. J Appl Physiol 81: 1223–1229, 1996.
60. Yoshida T, Whipp BJ. Dynamic asymmetries of cardiac output transients in response to muscular exercise in man. J Physiol 480: 355–359, 1994.
on November 14, 2008
ajpregu.physiology.org