UNIVERSITÀ DEGLI STUDI DELLA CALABRIA
"Archimede" Ph. D. School
in Science, Communication e Technologies
XXVII Cycle
Sector: Science of Complex Systems
Research Group: Electrical Systems for Energy – ING/IND 33
LOCAL TRADING TO COORDINATE PROSUMERS
IN A VIRTUAL ENERGY DISTRICT
Ph.D. Student
Eng. Grazia Belli
Index
Introduction ... 5
1. First Section – Start Points... 7
1.1. World Energy Configuration ... 7
1.2. Demand supply ... 8
1.3. Renewable sources ... 12
1.4. Italian energy configuration ... 15
1.5. Integration of Renewables ... 17
1.6. The Smart Grid ... 19
1.6.1. The Smart – MicroGrid ... 23
1.7. The Prosumer ... 24
1.8. Virtual Power Plant / Energy District ... 26
1.9. The Aggregator ... 28
1.10. Local Market ... 29
1.11. The Italian Electricity Market ... 30
1.11.1. Brief analysis of electricity costs in Italy ... 33
1.12. Smart Community ... 36
2. Second Section – RES NOVAE Project ... 39
2.1. Project PON RES NOVAE ... 39
2.2. The Smart User Network – SUN [125] ... 42
2.3. The Prosumer Problem [126] ... 44
3. Third Section – The Proposed Local Energy Management ... 51
3.1. Community Energy Provider Management System ... 51
3.2. Local Trading ... 56
3.2.1. Local Market Platform (LMP) Model [70] ... 57
3.2.2. Constrained Local Market Model (CLM) [91] ... 66
3.2.3. Constrained Local Market Model with Storage [88] ... 77
3.2.4. Storage Local Market (StLM) Model [90] ... 85
3.3. The Storage system in a VED management: the case of Stormwater Detention Tank (SDT) [82,136] ... 93
3.3.1. Management of SDT ... 94
3.3.2. SDT in a DR program [82] ... 102
3.4. Smart Community Management [145] ... 111
4. Conclusion ... 123
5
Introduction
The environment, energy and climate change issues represent a huge and urgent challenge, and, therefore, it is essential to identify, in addition to the basic strategy, even the most appropriate instruments to achieve it.
Research in the energy sector is perhaps, the most strategic tool for the worldwide energy policies. Indeed, if properly directed, research and technological progress will induce the changes needed to make economic development compatible with environmental protection. The main research areas to be developed are primarily those which can help to reduce dependence on fossil fuels, to reduce CO2 emissions and to increase the efficient use of energy. In addition to the development of energy research, it is necessary to integrate and coordinate the strategy of every single Nation and the tools used in the European dimension.
An effective approach may be to assist in the process of European liberalization, currently under construction, specific investment priorities (and/or regulatory and market issues) and adequate tools for their implementation [1].
In this regard, the aim of this Ph.D. thesis fits the current world and national energy situation, explains how the energy sector is evolving towards new scenarios. Indeed, this Ph.D. thesis offers a new vision to better manage an aggregation of user, composed of consumers and small-size producers (able to generate energy for less than 10 MW). The aggregation creates an "energy district", managed in a coordinated way by an aggregator, called City Energy Provider, who organizes the "local market" to optimize the rational use of energy and to integrate very well the renewable resources. The core of this thesis will provide different models to describe the functionalities of the local market: firstly, a simple model will present the idea of “local market”, then, different degree of constraints (limits on transport capacity of lines, cuts on production, use of storage systems with their technical constraints) will be considered. All the models will be tested on practical cases, providing results in terms of amounts of energy managed on local market, recovered from the cut,
6
sold/bought in/out the energy district, stored, with the corresponding economic value for each chosen action.
The core is divided into three sections. In the first section, the current world and Italian energy situation and transformations that the energy sector needs to face will be descripted. Then, in the second section, a description of the Project RES NOVAE thanks to the Ph.D. 3-years period research has been brought, is provided. The last section shows the innovative management strategy for an aggregation of users, especially referring to the possibility to create an energy local market: models and results of the application of these models to real cases will be presented.
7
1. First Section – Start Points
1.1. World Energy Configuration
It is about from fifty years that attention to environmental issues significantly affect planning policies and development of many countries all over the world. On one hand, more and more different nations participate in worldwide thematic groups and engage in ambitious targets for the pollution reduction and rational and efficient use of resources, to face the climate changes [2-3]. On the other hand, the welfare of a nation is still too often linked exclusively to the industrial development, the objectives of which are often in the opposite direction to the environment care. In this context, more and more scientists actively promote a 100% renewable energy vision. According to the Intergovernmental Panel on Climate Change (IPCC)’s latest assessment report [4], human population have already used almost 2/3 of carbon budget. At the current and projected rate of consumption, this entire budget will be used by 2040. According to the IPCC, the remaining carbon budget is identified: humankind cannot emit more than 1,000 gigatons of CO2 from now.
The world’s most rigorous scientific bodies agree on climate change, due to a build-up of greenhouse gases, especially carbon dioxide, in the atmosphere caused by human activity. The greenhouse effect is a natural process, in which the atmosphere traps some of the sun’s energy, warming the earth and moderating our climate. Increase in ‘greenhouse gases’ from human activity has enhanced this effect, artificially raising global temperatures and disrupting our climate.
According to the IPCC [4], the United Nations forum for established scientific opinion, the world’s temperature is expected to increase over the next hundred years by up to 4.8° Celsius if no action is taken to reduce greenhouse gas emissions - much faster than anything experienced so far in human history [5].
Globally, most fossil fuel is used to generate energy, either electricity, heat, or motor fuel. It is worth to underline that, if unchanged, the growth of fossil energy will lead to unmanageable impacts on the global population. If the world population remains
8
dependent on fossil fuel in the pursuit of energy security, the result will be a potentially catastrophic spiral towards increasing greenhouse gas emissions and more extreme climate impacts [5]. So it is essential that humankind moves rapidly towards a new form of energy supply – one that delivers 100% renewable energy by 2050 [5]. The International Energy Agency (IEA) published an evaluation of the current development of the energy sector in May 2015 (IEA – TCEP 2015) [6], which concluded that the implementation of renewables and energy efficiency is successful but too slow to meet the 2°C target. Here are some of the IEA’s conclusions:
• costs: Increasingly, renewables are competitive with new fossil fuel plants, and the cost gap between renewable electricity and fossil power from new plants is closing worldwide.
• policy: Power markets must be redesigned to accommodate variable, distributed renewables.
• technology: Cogeneration and renewable heat, storage, • mobility: Electric vehicles
• buildings: energy-efficient renovations.
1.2. Demand supply
Fossil fuels are still the primary source providing about 80 % of overall energy needs. They are divided as follows: 34 % oil, 26 % coal and 22 % natural gas [7-12]. The most significant factors that determine the energy demand are on the one hand, the population growth and on the other, the economic growth, as well as the increasing industrialization and urbanization in emerging countries and in those developing. Between 2010 and 2040, the world population will increase from 7.5billions to 9billions of individuals, (Fig.1). This increase will take place exclusively in emerging and developing countries. At the same time, the economy in non-OECD1 countries will increase by 4.4 % while in OECD countries only 2%. In
9 non-OECD countries, there is enormous need to catch up in economic development and the standard of life resulting in inevitable increase in energy demand. A particularly significant example: while in the US, Eurozone and Japan a data among the 428 and 470 cars per 1,000 inhabitants is reported, in China this data is recorded to 57 and India only 18. In the non-OECD countries, the energy use per capita is considerably lower than the OECD countries. If an American consumes 7 tons of energy a year, an Indian consumes only 0.6.
According to the latest forecasts from 2010 to 2040, the world's energy needs will increase by 35% [7-12]. The increase of energy will register only in emerging countries China and India as well as in developing countries because of the population growth, the economic pulse, the increase of industrialization, urbanization and therefore well-being (Fig.1). In non-OECD countries, however, it is expected, by 2040, a slight recession provided to increase energy efficiency (thanks for example to the production of cars with a reduced fuel consumption).
Figure 1: Population Growth and Energy demand (Source: United Nations and [11])
Referring the use of fossil fuels, this is their situation (Fig.2): the use of oil, natural gas and coal will go from 82% in 2010 to 79% in 2025 and 77% in 2040 even though
10
such fuels continue to cover more than a third of global demand. If in 2010 the share of natural gas stood at 22%, in 2025 it will amount to 24% and in 2040 to 27%; the share of coal in 2010 was 26%, in 2040 it will drop to 19 %; the percentage of oil in 2010 was 34, in 2025 and in 2040, 31. The oil will continue, however, to be the main energy source in the world. The increase of methane gas on one side and the decrease of the carbons on the other, are to be considered a positive fact, since combustion gas emits lower quantities of carbon dioxide and other harmful substances and therefore, it is a cleaner alternative to carbon and oils [7-12].
Figure 2: Word energy sector by sources (Source: [12])
Alternative energies (excluding hydropower and biomass energies) will increase substantially, but nevertheless, in 2040 will represent only a modest 4% of the world energy picture.
Looking at the individual economic sectors, the picture that emerges is very different. From 2010 to 2040, the energy demand will increase by 28% in the private and commercial sector, by 35% in industry, and in the transport sector, there will be an increase of 42%. In the latter sector, the oil will continue to play a key role.
In Fig.3, the forecasts of the primary energy trends for the residential/commercial sector, transport and industry between 2000 and 2040 are represented. In the residential/commercial sector, the trend is divided by energy source: it is clear that
11 the bulk of the demand is met by electricity and heat. The trends of primary energy for transportation and industry are characterized by sector of employment.
Figure 3: Energy demand for residential/commercial sector, trasportation and industrial sector (Source: [11])
In Fig.4, the forecast of primary energy demand in the residential sector is shown for different countries: it is clear that the countries where the birth rate is very high and economic development is fast, energy demand will be very high, especially in terms of electricity.
12
In the electricity sector (Fig.5), in the coming decades, significant changes in the world will happen. To better understand, a premise is necessary: even today, 1.3 billion people have no electricity. In this sector, higher growth rates are expected: between 2010 and 2040, the 90% at worldwide level, the 163% in non-OECD countries and only 23% in OECD countries. In the energy production, there will be a very high increase of alternative energies. Between 2010 and 2040, the most significant increase will regard wind energy (540%), other alternative energy (188%) and hydropower (80%). Referring to fossil fuels (Fig.5), by 2025 coal will continue to increase slightly and then will decline, while between 2010 and 2040, the gas will increase substantially (78%). The oil, which is used rarely in the electricity production, in the future will become meaningless. In this sector, there is a clear tendency to use clean fuels. Between 2010 and 2040, nuclear energy will increase by 109% [7-12].
Figure 5: Electricity demand, Global electricity supply per sectors and Global capacity to integrate renewables (Source: [11])
1.3. Renewable sources
Near to fossil fuels, renewables sources should be considered: fortunately, in the last decades they have been used extensively. This happened under the pressure of the continuous scientific researches about the catastrophic consequences of indiscriminate pollution and therefore the awareness of part of the world population to act in the direction of sustainable development [13-22]. In this direction, there
13 have been many international agreements to protect the environment [2-4, 13], which provide a reduction of greenhouse gas emissions in order to contain the 2-degree rise in global temperature by 2040, see Fig.6 [6].
Figure 6: Sector contributions to emission reductions (Source: [6])
The production of energy from renewable sources is therefore the most valuable weapon to achieve the goal. An analysis performed by [5, 22-23], the energy market in Europe since the 70s has been subjected to a radical change regarding the used sources. It is noted that in the last decade, renewables have boomed and contribute significantly (Fig.7).
Figure 7: EU annual power plant market: 1970-2014 (Source: Platts, REN21, EWEA, GWEC, EPIA, National Statistics, IEA, Breyer, Greenpeace [5, 22-23])
14
The Renewable Policy Network for the 21st Century (REN21) has undertaken a global renewable market analysis each year in June since 2004. The publication – “Renewables – Global Status Report” [22] – is among the most comprehensive global and national surveys of the renewable industry sector. According to their latest edition, the global renewable energy market in 2014 was dominated by three power generation technologies: Solar photovoltaics (PV), wind, and hydro. Combined, these technologies added 127 GW of new power generation capacity worldwide.
Other renewable sources contribute as shown in Fig.8: on a total of approximately 19% of contribution by renewable, about the 10% is obtained by modern renewables as hydropower, biofuels, wind or solar or biomass geothermal power and biomass or geothermal solar heat. The other 9% is obtained by traditional biomasses.
Figure 8: Estimated renewable energy share of global final energy consumption 2013 (Source: [22])
In Fig.9, it is underlined the sharing by renewable sources to product electricity at the end of 2014.
15 Figure 9: Estimated reweable energy share of global electricity production, end 2014
(Source: [22])
Looking at the distribution by region (Fig.10), in the next decade, renewable sources will be almost stable in countries already heavily industrialized, while a considerable increase will happen in developing countries with strong demographic and economic expansion.
Figure 10: Reweable power generation by region (Source: [6])
1.4.
Italian energy configuration
Italy does not fall in the category of countries in which it is expected an increase in the population or a strong economic development. Indeed, following the economic crisis in 2008 that has affected all developed countries, energy demand in Italy has declined: in 2013, the GDP fell by 1.9%, and this reduction is matched by a decline
16
in the 3.0% in primary energy consumption and 3.9% in end-use. Turning to the use of sources, there has been a general decline of fossil fuels, with a greater reduction in percentage of coal (-12.2%), followed by gas (-6.5%) and oil (-5.2%). In contrast, it was confirmed the increase of renewable energy (+15.8%), which covered 15.2% of gross domestic consumption. Again, referring to the production of electricity, the combined effect of the economic crisis and the increased role of renewable energy has heavily penalized the use of fossil fuels (-12%) [24-25].
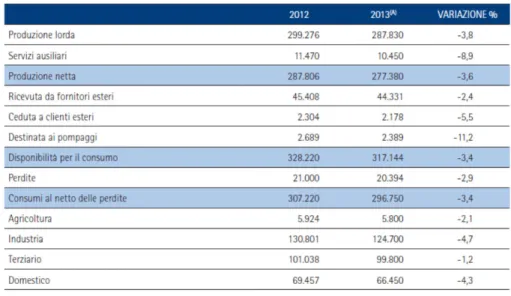
Table 1 shows the production and use of electricity in the last two years, pointing out that, even in 2013, net production has covered the 87.5% of the national demand with 44.3 TWh of imports, which allowed cover the remaining part of the request.
TABLE I. TERNAELECTRICITY BALANCE IN 2012-2013[GWH](SOURCE:TERNA,[24-25])
In a context of significant reduction of total production, the growth of electricity production from renewable sources remains strong (+17% between 2012 and 2013), due to the increase of wind power (+12%), photovoltaic (+19%) and biomass and waste (+12%), but above all for the remarkable contribution, between 2012 and 2013, hydroelectric production (+21%), see Table 2.
17
TABLE II. GROSS PRODUCTION PER SOURCES 2009-2013[GWH](SOURCE:TERNA,AEEGSI)
1.5.
Integration of Renewables
The production from renewable sources has become important in order to achieve the goals to protect the environment and human life (Fig.11). This has led over the last decades, the free uncontrolled connection to the distribution network of production plants, generally of small size, going to increase what in literature is referred to Distributed Generation (DG) [26].
Indeed, nowadays, the massive presence of DG underlines a number of problems that up to now the electrical system had not had to face.
First, the request for connection of DG is growing and the electricity system that should host it, is old and has limited capacity; also the strengthening of the power system would require substantial investments.
Second, the electrical system has so far been thought for a strictly passive exercise, in which the energy is transmitted from large production plants and arrives to the end user through the network of transmission and distribution network, according to a unidirectional flow. The presence of DG connected to the distribution network allows instead inputting energy from the end user’s generator into the electrical system, according to a bi-directional flow.
18
Figure 11: World reduction of CO2 emissions (Source: [33])
In addition, it must take into account another peculiarity that characterizes some types of renewable sources, that is the non-programmability and intermittent behavior. As penetration of intermittent renewables like wind and solar increases, extra steps must be taken to ensure a reliable flow of electricity to consumers. These steps create additional, often overlooked, costs. For example, additional generating capacity, such as natural gas-fired plants, must be made available to back up wind and solar during the times when the sun is not shining and the wind is not blowing [11].
A massive penetration of DG connected to the MV distribution networks therefore requires the adoption of innovative techniques of network protection against events that may modify its proper operation, as failures or malfunctions of the plants connected to it.
The presence of the DG in size comparable with the local loads may in fact bring to abnormal operation of the protection devices, which may lead to lack of action or untimely tripping [27-29]. Such malfunctions can seriously affect the quality and security of electricity supply to the utilities.
19 For this reason, the current electricity system is subject to a number of very incisive changes that are leading to be the system autonomous "smarter" in order to resolve any technical problems, to provide auxiliary services to users and network operators, to ensure greater flexibility and security, integrating optimally the systems using renewables. In this way, the whole electrical system is evolving towards new concepts: the network that physically connects the DG becomes Smart Grid (SG) [30-35], the user who owns a DG plant will be a Prosumer [36-39], the economic platform to prefer to the National Electricity Market will be the Local Market [40-43] and new figures will appear as the Aggregator [44-47], aimed to manage a cooperation of users (named Smart Community [21, 48-52]).
1.6.
The Smart Grid
The Smart Grid is the grid of the future. Give an exact definition of it is difficult, because Smart Grid does not means only development of new technologies, but also
optimized planning and operation of the grids. Indeed, based on sustainable
development, supply security and cheapness, Smart Grid includes several concepts referred to new generation forms, new technologies to increase reliability, use of active demand also in collaboration of electricity markets, new energy applications. Different government organizations have tried to define Smart Grid. Here, the most detailed definition are reported.
The U.S. Department of Energy (DOE) has suggested the definition of smart grid as follows. “An automated, widely distributed energy delivery network, the Smart Grid will be characterized by a two-way flow of electricity and information and will be capable of monitoring everything from power plants to customer preferences to individual appliances. It incorporates into the grid the benefits of distributed computing and communications to deliver real-time information and enable the near instantaneous balance of supply and demand at the device level” [53].
Canadian Electricity Association has defined smart grid as follows. “The smart grid is a suite of information based applications made possible by increased automation of
20
the electricity grid, as well as the underlying automation itself; this suite of technologies integrates the behaviour and actions of all connected supplies and loads through dispersed communication capabilities to deliver sustainable, economic and secure power supplies” [54].
The Ontario Smart Grid Forum has defined the smart grid as follows. “A smart grid is a modern electric system. It uses communications, sensors, automation and computers to improve the flexibility, security, reliability, efficiency, and safety of the electricity system. It offers consumers increased choice by facilitating opportunities to control their electricity use and respond to electricity price changes by adjusting their consumption. A smart grid includes diverse and dispersed energy resources and accommodates electric vehicle charging. It facilitates connection and integrated operation. In short, it brings all elements of the electricity system production, delivery and consumption closer together to improve overall system operation for the benefit of consumers and the environment” [55].
In Europe, Smart Grid is considered as follows: “A smart grid is an electricity network that can intelligently integrate the actions of all users connected to it— generators, consumers and those that do both—in order to efficiently deliver sustainable, economic and secure electricity supplies. A smart grid employs innovative products and services together with intelligent monitoring, control, communication, and self-healing technologies. Smart grids development must include not only technology, market and commercial considerations, environmental impact, regulatory framework, standardization usage, ICT and migration strategy, but also societal requirements and governmental edicts” [56].
It is worth to underline that in the European definition of Smart Grid, for the first time, “societal requirements and governmental edicts” are mentioned: it means that Smart Grid is not only referred to the world of energy. It means that Smart Grid is a tool to great welfare that begins from energy and arrives to the end-user and the society in its entirely (Fig.12).
21 Figure 12: Elements that a Smart Grid tries to integrate (Source: [56])
In general, a smart grid is the combination of a traditional distribution network and a two-way communication network for sensing, monitoring, and dispersion of information on energy consumptions (Figg.13-14).
It must include [30, 34, 53-67]:
(1) improved reliability; (2) ease of repair, particularly remote repair; (3) self healing, automatic repair or removal of potentially faulty equipment from service before it fails, and reconfiguration of the system to reroute supplies of energy to sustain power to all customers [53, 57-58];
(4) increased physical, operational and cyber security and resilience against attack or natural disasters [53, 57-58];
(5) Interactive, appropriate information regarding the status of the system is provided not only to the operators, but also to the customers to allow all key participants in the energy system to play an active role in optimal management of contingencies [58]; (6) increased energy efficiency along with the environmental benefits gained by such efficiency [53, 57];
(7) integration of a greater percentage of renewable energy sources, which can be inherently unpredictable in nature; (8) flexibility: the rapid and safe interconnection of distributed generation and energy storage at any point on the system at any time [53, 57-60];
22
(9) integration of plug-in electric vehicles;
(10) predictive, that is use of machine learning, weather impact projections, and stochastic analysis to provide predictions of the next most likely events so that appropriate actions are taken to reconfigure the system before next worst events can happen [53, 57-58];
(11) optimization: knowing the status of every major component in real or near real time and having control equipment to provide optional routing paths provides the capability for autonomous optimization of the flow of electricity throughout the system; (12) a reduction in peak demand, [58];
(13) use of information and communications technology to gather and act on information in an automated fashion [57, 52-63];
23 Figure 14: Strategic Document for Europe’s Electricity Networks of the Future (European
Technology Platform on Smart Grids)
1.6.1. The Smart – MicroGrid
One main feature of the smart grid is the possibility of customer participation in the overall grid energy management. In this way, the customer must have the tools to realize an effective participation. Starting from this need, in a smaller dimension, that is the customer-dimension, it is usually to talk about Smart – MicroGrids, or in general MicroGrid (MG). The MG answers to all the aforementioned requirements, coordinating generation devices, storage systems and electrical/heat loads that are connected to the same low or medium voltage grid, which in turn is connected at the Point of Common Coupling (PCC) to the main distribution grid [69-70].
One specific characteristic of a MG is the possibility to operate either connected to the main grid or islanded from it. This unique feature allows the MG to be disconnected from the main grid when the power quality of the main grid is not satisfactory or when it fails. As a result, the users of the MG will have a higher quality of supply for the loads within it. Furthermore, if the elements in the MG are operated taking into account economic and emission policies, it offers a way of obtaining cheaper and cleaner energy for the users connected to it.
24
In order to provide energy of the required quality in a secure, economical and clean way the different renewable resources within the MG must be operated in a coordinated and coherent fashion. To that end, a control system for the MG is fundamental. The control system must consider forecasted demand, electricity and fuel prices and the technical constraints on devices to plan and schedule the operating set points and the relationships with the main grid in terms of both market participation and ancillary service provision [71].
In details, the MG includes an LV network, loads (some of them interruptible), both controllable and non-controllable, micro-sources (MS), storage devices, and a hierarchical-type management and control scheme supported by a communication infrastructure used to monitor and control MS and loads. The head of the hierarchical control system is the Micro Grid Central Controller (MGCC). At a second hierarchical control level, load controllers (LC) and micro-source controller (MC) exchangeinformation with the MGCC that manages MG operation by providing set-points to both LC and MC. The amount of data to be exchanged between network controllers is small, since it includes mainly messages containing set-points to LC and MC, information requests sent by the MGCC to LC and MC about active and reactive powers, and voltage levels and messages to control MG switches [72-73].
1.7.
The Prosumer
The user who has a Smart MicroGrid is generally known as Prosumer. Indeed, thanks to the possibility to own a small size, generally renewable non-programmable, generation system, as photovoltaic generator, the user changes his behaviour of simple consumer. He now can produce energy, becoming a PROducer and, at the same time, he can consume energy as a conSUMER, that is a Prosumer. So, the Prosumer has an active role in the grid operation: indeed, when his own energy production is greater than his consumption, the surplus energy is injected into the grid [34-39, 74].
25 Many difficulties of nowadays grid management depend on exactly this prosumer’s active role: as said before, the impossibility to control non-programmable resources causes several technical disturbances on the entire electrical system and also the increase of the operational costs.
For these reasons, also the prosumer must become “smart”: participation of the prosumer into Demand Response (DR) programs and into Demand Side Management (DSM) can gives him a degree of “smartness”.
DR is often associated with the short-term changes for the critical hours during a day/year when the demand is high or when the reserve margin is low, whereas Demand Side Management refers to the long-term changes in the electricity consumption achieved through investments in energy efficiency. Demand Side Management is an effort realized by the demand side only to improve energy efficiency. In addition to improving the reliability of the power system, and making short-term impacts on the electricity markets leading to financial benefits for both the utility and the end-users, DR can reduce the system peak load in the long term and therefore postpone the need for building new power plants, leading to considerable environmental impacts [75]. Moreover, DR refers to active participation by end-users in electricity markets, seeing and responding to prices as they change over time [76]. In this way, DR involves end-users to change their normal consumption in electric usage (their behaviour) in response to changes in the price of electricity over time, or to incentive payments designed to induce lower electricity use at times of high wholesale market prices or when system reliability is jeopardized [76-77]. Doing this, DR educates end-users about energy use with time of use (TOU) rates, dynamic rates, and energy use feedback can also produce reductions in end-users’ total energy use and cost [78].
So, DR programs in the short period and DSM in the long period, can allow benefits to the whole electricity systems. In general, from an economic-market point of view, DR reduces general costs of energy supply, increases the reserve margin, and mitigates price volatility by means of smart-term responses to electricity market conditions. From an environmental point of view, DR and DMS provide
26
environmental and/or social purposes by decreasing energy usage, defining commitment of not environmentally friendly generation units, leading to energy efficiency augmentation, and/or reduction in greenhouse gas emissions. Network also benefits in DR application by maintaining the system reliability, decreasing demand in a short period of time and reducing extra generation/transmission capacity enhancement [79-81], while the DMS optimizes the power flows in the network, regulates the voltage profiles, acting on reactive flows and tap changers in substation, minimizes the energy losses, reconfigures the network, exploits storage devices and responsive loads in an integrated way [57, 79-82].
1.8.
Virtual Power Plant / Energy District
Prosumers participating to DR programs and favourable to DSM applications can really give another degree of smartness to the entire electrical system. It is important to underline that to improve even more the management of the electrical system, every prosumer (or in general user) should not be considered in himself, but all the prosumer of a same area should be considered in an aggregated manner.
Why is it necessary to aggregate? Aggregate different kinds of users (consumer, producer and prosumer) can achieve several types of advantages [83]:
• Aggregate various load/generation profiles can reduce the error (that is an imbalance) in the forecasting of the same profiles: a lower error means a lower cost to supply the demand and a higher utility in the sale of energy.
• Aggregate the generation capacity of different users allows to the users to participate in the market sessions: a small single user runs in economic barriers to enter alone in the market.
• Aggregate the users belonging in a limited area can realize other market sessions (as Local Market, explained later), which can allow to users to have more favourable economic condition to buy/sell energy between them.
27 • Aggregate load and generation profiles and considering the presence of storage systems, can allow to the users of the same area to become provider of ancillary services to the grid.
For these reasons, nowadays it is usually talking about aggregation of user in terms of Virtual Power Plant (VPP) [84-86]or Energy District (ED) [70, 83, 87-90].
The VPP and the ED almost indicate the same thing that is an aggregation of users: the different between the two definitions consists in the context in which VPP and ED are used. Indeed, in literature, VPP is often referred to the technical control, while the ED is frequently related to the management, especially toward the market, of the users’ aggregation.
Indeed, from a technical point of view, a VPP, considered as a cluster of dispersed generator units, controllable loads and storages systems, aggregated in order to operate as a unique power plant, is generally classified in term of centralized/decentralized control, hierarchical or not architecture, and so on [91-93]. The communication is bidirectional, so that the VPP cannot only receive information about the current status of each unit, but it can also send the signals to control the objects. The control of VPP can operate according to its targets, which can be, for example, the minimization of the generation costs, minimization of production of greenhouse gasses (GHG) and maximization of the profits. In order to achieve such targets the control of VPP needs to receive information about the status of each unit on the one hand, and on the other hand forecast - especially for renewable units like wind and photovoltaic (PV). Furthermore, the information about the possible bottlenecks in the grid plays a relevant role in the optimization process of the VPP operation, choosing the optimal “modus operandi” [94].
From a management point of view, the Energy District (ED) is a centre of energy consumption and production made of several interconnected prosumers both from the electrical and thermal points of view. The prosumers belonging to the ED are connected with the grid by a unique point of delivery (POD), generally a MV/LV substation, where the exchange with the electrical system takes place in an aggregate form. ED is a coalition of end users that wish to minimize community energy costs.
28
However, the idea to aggregate residential, commercial and small industrial energy consumers was suggested and promoted by academy [95-96] and government [97] and, rather than conceptual, it is an operational practice in Italy [98].
Such aggregations are mainly nonprofit organizations [99] that provide their members with economic advantages by minimizing energy consumption costs by varying energy usage according to the hourly variations in energy tariffs, with the additional social benefit of decreasing the chances of system overload [100].
1.9.
The Aggregator
The management of the aggregation must consider a supervision entity, the “Aggregator”, operating in the name and interest of the whole aggregation. The Aggregator is a no-profit entity, whose task is to collect and coordinate the distributed resources (generation, loads and storage systems), offering energy services to the users’ aggregation, but also to the other participants of the electrical system, through a suitable remuneration [70, 82, 87-90, 101].
In this way, the Aggregator buys the flexibility of the users in terms of load shift/reduction, variation of the injected power into the grid from generators/storage systems, etc. and makes it a negotiable Active Demand (AD) product. Then the Aggregator sells this AD product on the market to the other participants of the electrical systems, that is the Transmission System Operator (TSO) or to the Distribution System Operator (DSO) or the same users [102].
The Aggregator collects, forecasts and manages the distributed energy resources to minimize the energy cost to the flexible users through the AD, and to maximize the input into the grid through the Distributed Generation (DG) and the grid flexibility through the AD.
In details, the Aggregator is able to [103]:
• Collect the flexibility of domestic and small-size commercial users (big-size
users, as industrial, generally stipulate particular flexibility conditions in their supply contracts with the distributor) to construct AD products to sell into
29 markets. To do this, Aggregator should perform as a consultant, offering technical and economic solutions to the users to maximize the utility and the flexibility.
• Know the requirements and the opportunities of the AD. Therefore, the
Aggregator collects the requirements and the signals from the different participants to the electrical system through the market, to construct the offers that satisfy the participants’ needs. The Aggregator knows the geographical position of the consumers and the producers/prosumers and this information is important to match the correct require (e.g. load reduction in a certain section of distribution grid) with the opportune service (e.g. generation increase from renewable sources or discharge storage systems), considering also the technical and economic constraints [45, 104].
• Create utility for all the users of the aggregation and for the subjects out of the aggregation. For example, the users can see paid their flexibility; the DSO can obtain ancillary services to support the grid operation; and so on [105].
• Manage the financial risks linked to the market uncertainties (risks on market prices) and to production/consumption of the prosumers (in terms of quantities to negotiate). In particular, to limit the risk linked to the quantities, the Aggregator should divide the users in groups based on consumption, behaviour, flexibility, identifying clusters of clients. In this way, the Aggregator may foresee the users’ reaction to the volume/price signals and may suppose the price-sensitivity [106].
1.10.
Local Market
In previous paragraphs, it has been introduced the possibility to create local trades of energy to exchange energy in more favourable economic conditions. Actually, with the spread of small-size DG, two phenomena can be observed: on one hand, the presence of a lot of electrical energy from renewables is sell into national electricity markets at bargain price but this bargain price does not arrive to the end-user who
30
sees his bill unchanged. On the other hand, the number of local producers is increased but they cannot participate to the energy market because the entry barriers to become a supplier are very high [40].
Considering these aspects, in many countries, the idea of a local market rises: in the local market, the energy demand meets directly the energy availability, that is users who need energy, present offers to buy energy, while users who have energy in surplus on their needs, present offers to sell energy. In this way, skipping intermediaries, users may have more economic conditions both in sale and in purchase. Moreover, by an optimized management of local market, also technical problems as grid congestions can be limited [42, 107-108].
Before explain how the idea of local market has been thought (see Section 2), a brief description of Italian Electricity Market and of some consideration about energy costs in Italy are provided.
1.11. The Italian Electricity Market
The Italian Energy Market [109], known also as Borsa Elettrica, rises in Italy after the acceptance of Italian low D. Lgs. n. 79/99 (decreto Bersani), as part of the transposition of the EU directive on the creation of an internal energy market (96/92/CE). The Borsa Elettrica is an essential tool for the creation of a competitive electricity market in Italy and was founded with the purpose of encouraging the rise of transparent equilibrium prices, which allow manufacturers and consumers to buy and sell energy where there is a greater affordability.
From the 1st January 2005, also the participation of active demand programs is starting: all the concerned operators have the opportunity to buy directly from the
Borsa the energy they need, with the requirement to program on an hourly basis its
energy withdrawal profile.
From the 1st November 2008, the Gestore dei Mercati Energetici (GME) introduced the Forward Electricity Market (Mercato a Termine dell’Energia - MTE) to allow
31 trading of electricity in time horizons longer than those offered by traditional daily markets. In accordance with the Art.17 of Allegato A - AEEG Resolution no. 111/06, GME also manages the Electricity Account Registration Platform (Piattaforma dei
Conti Energia a termine - PCE), which is the platform through which operators,
which have concluded bilateral contracts outside the bidding system, register the commercial bonds and declare its electricity injection and withdrawal profiles, to perform under those contracts.
The main actors involved in the operations of the electrical system, each with a specific role expressly defined by legislation, in addition to the Italian Parliament and the Italian Government, are:
• the Ministry of Economic Development (MSE) , which defines the guidelines for strategic and operational safety and cost-effectiveness of the national electricity system;
• the Autorità per l'energia elettrica, il gas ed il sistema idrico (the Italian regulator, AEEGSI), which guarantees the promotion of competition and efficiency in the sector, with functions of regulation and control;
• Terna S.p.A, which manages the national transmission network and the electricity flows through the dispatching, that is balancing the supply and demand of energy, 365 days a year, 24/7;
• The Energy Services Operator (Gestore dei Servizi Energetici - GSE) , which withdraws CIP6 energy production and manages their sale on the market, • The Single Buyer (Acquirente Unico - AU), which acts to ensure the
electricity supply in Standard-Offer Market (servizio di maggior tutela) Customers service and in Safeguard Customers service;
• The Energy Markets Operator (Gestore dei Mercati Energetici - GME), which organizes and manages the electricity market, under criteria of neutrality, transparency, objectivity and competition between producers. The energy trading, aimed to plan of production and consumption units, is held by GME, which organizes and manages the Energy Markets, consisting in:
32
• the Day-Ahead Market (Mercato del Giorno Prima – MGP), venue for the trading of electricity supply offers and demand bids for each hour of the next day. All electricity operators may participate in the MGP. In this market, supply offers may only refer to Injection and demand bids only refer to Withdrawal.
• the Intraday Market (Mercato Infragiornaliero - MI), venue for the trading of electricity supply offers and demand bids, in respect of each hour of the next day, which modify the Injection and Withdrawal Schedules resulting from the Day-Ahead Market.
• the Ancillary Service Market (Mercato dei Servizi di Dispacciamento - MSD), venue for the trading of supply offers and demand bids in respect of ancillary services. Terna S.p.A. uses this market to acquire resources for relieving intra-zonal congestions, procuring reserve capacity and balancing injections and withdrawals in real time. Participation in the MSD is restricted to units that are authorised to supply ancillary services and to their Dispatching Users. The MSD produces two separate results:
1) the first result (Ex-Ante MSD) concerns Offers/Bids that Terna S.p.A. has accepted on a scheduled basis for relieving congestions and creating an adequate Reserve margin;
2) the second result (ex-post MSD or Balancing Market (Mercato di
Bilanciamento – MB)) concerns Offers/Bids that Terna S.p.A. has
accepted in real time for balancing injections and withdrawals (by sending balancing commands).
• the Forward Market, venue where Forward Electricity Contracts with delivery and withdrawal obligation are traded.
• the Account Registration Platform for physical delivery of financial contracts concluded on financial derivatives market (IDEM) organised and managed by Borsa Italiana S.p.A.
33 Unlike other European energy markets, the market of the GME is therefore not a purely financial market aimed only to the determination of prices and quantities, but it is a real physical market where physical injection and withdrawal programs are defined.
1.11.1. Brief analysis of electricity costs in Italy
The sale by the Borsa Italiana is expected to lead to a lowering of the purchase price of electricity to the end-user. Actually, this does not always happen. Indeed, Italy suffered a differential in average prices of energy products with major European countries and this condition results in higher energy prices than the average (see Fig. 15). The causes of these differences are many and not always clearly identifiable, ranging from tax levels to infrastructure deficit, the composition of the energy mix in unfavorable market mechanisms. For the purpose to reduce prices for end-users, some of these causes may be removed with relative ease, while others have structural origins that would make more difficult, or at least the longest, a hypothetical removal [110].
Figure 15: Differential of energy products average price in Italy vs U27 European average price (Source: SUSDEF)
34
The trend in the wholesale price, namely the Single National Price (Prezzo Unico
Nazionale - PUN) that is formed in the power exchange in the negotiations of the
MGP, in the year 2014 had the curve as shown in Fig.16 while during 2015, as shown in Fig.17.
Figure 16: Trend of PUN at MGP, in 2014 (Source: GME)
Figure 17: Trend of PUN at MGP, in 2015 (Source: GME)
Looking at Fig.17, apart in July 2015, the PUN is basically decreased during 2015 compared to the trend in 2014, reaching around 50€/MWh in September 2015.
Despite a favorable trend in commodities prices, it is to be noted that the electric final prices continue to suffer significantly from the impact of general network duties. The total annual requirement of general network duties in 2015 reached, indeed, the 15 billion of Euro, doubling the needs of the year 2011, as a result of significant growth in the A3 component to ensure the incentives for renewable sources [111], (see Fig.18).
35 Figure 18: General Network Duties, in 2015 (Source: AEEGSI)
Clearly, the end-user price is no more than the set of many items.
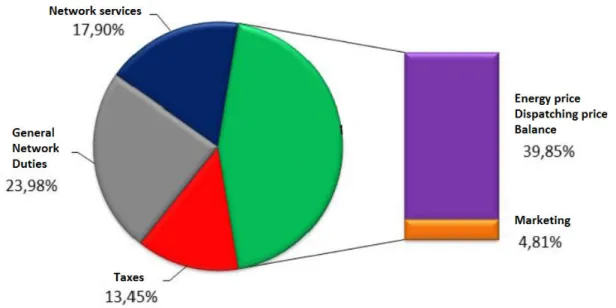
With effect from 1st April 2015, for the family type, the final price for the supply of a kWh, can be broken down into the following items [111] (Fig.119):
• 7.38 c€ (39.85% of the total bill, including taxes) for the costs of energy supply; • 0.89 c€ (4.81%) for the retail marketing;
• 3.32 c€ (17.90%) for network services (transmission, distribution and measurement);
• 4.44 c€ (23.98%) for general network duties;
36
Figure 19: Final price for the supply of a kWh in items
By the implementation of the local electricity market, the goal should be to get an economic benefit on items of Energy price, Dispatching price, Balance and Marketing, that together cover the 44,66% of the final price payed by the end user.
1.12. Smart Community
All the concepts described above can be summarized into a single bigger idea, that includes all the aspects referred to Human life, from technical to social questions: the Smart Community.
The smart community identifies an urban ambient where the requirements of residents, businesses and institutions are satisfied, through the widespread and innovative use of communication, mobility, environment and energy efficiency technologies to improve the quality of citizens’ life [48, 112].
The goal to improve the quality of citizens’ life is not only related to the satisfaction of their daily needs of energy, food, services or to the digitalization of their routine actions.
37 A smart community tries to use its resources to meet current needs while ensuring that adequate resources are available for future generations. To do this, a smart community tries to maintain nature’s ability to function over time by minimizing waste, preventing pollution, promoting efficiency and developing local resources to revitalize the local economy. Ultimately, a smart community is a living system in which human, natural and economic elements are interdependent and link each other [113-114].
Looking to Fig.20, the concept of Smart Community can be summarized in three main areas where economy, environment, governance, lifestyle, transport can be related each other: Human, Infrastructure, Planning and Management [112, 115-11]. In Human environment, some aspects referred to the citizen are evaluated: his health and his education, social programs and public safety. In this direction, the citizen becomes the hub of Smart Community innovation and he plays an active role in it [117-122].
In Planning and Management environment, there are sectors such as administration, public security, urban and environment planning. In this contest, governments and municipalities are already using smart technologies in the cities: from municipal wireless network to integrated IT systems, smart credentials, energy management systems, security, smart buildings active from an energy point of view and capable to generate the energy they require and, in some moments, to sell the surplus of energy to national grid. For this reason, one of the biggest challenges that smart communities are going to face is the integration, and the consequential optimal management, of a wide range of users below to different areas and technologies, as smart grid, telematics, public transport and smart ticketing [117-122].
In Infrastructure environment, problems referred to transport, energy, water and environment in general are considered. In this direction, programs for the CO2 reduction all around the world have led to the new trend of producing energy locally at the distribution level, by using non-conventional/renewable energy sources like natural gas, biogas, wind energy, solar energy, fuel cells, cogeneration systems
38
(CHP), micro-turbines and Stirling engine, all hereinafter referred as Distributed Generation (DG) [117-122].
39
2. Second Section – RES NOVAE Project
Before describe the results referring Local Trading Models, obtained in these three years of Ph.D. School, a brief description of the project thanks to the research in this field has been possible, is presented.
2.1.
Project PON RES NOVAE
The ambitious sustainability goals (increasing energy efficiency, reducing greenhouse gases emissions, delivery of new value-added services and overall improvement in quality of life) set by the Municipal Energy Plans and in particular the Sustainable Energy Action Plan (SAEP) [123], require a national context in which the infrastructure, in particular energy systems and ICT infrastructure, are able to provide "awareness" of the state of system and its most critical components, “ability” to evolve and quickly adapt to the changes of external conditions through integrated and interconnected solutions.
In this context, the Project RES NOVAE, acronym of “Reti, Edifici, Strade, Nuovi Obiettivi Virtuosi per l'Ambiente e l'Energia” [124] aims to research, model and experiment on a demonstration the complex and dynamic management of the energy fluxes at the municipal level. Based on the integration of energy technologies and ICT, optimizing in their operations, RES NOVAE tries to reduce energy costs, to limit the problems due to the multi-generation of energy from renewable sources, decreasing the environmental impact and raising the awareness of energy and environmental issue in the community users. In energy field (Renewable energy and smart grid), the project promotes innovation through the development of technological and management solutions that support and strengthen the recovery, the production and the integrated management of the various renewable energy sources and of their distribution systems, taking into account the need to enhance relations between the urban and rural dimensions in energy, environment and climate policies of smart communities. Regarding the scope of energy efficiency (Energy
40
efficiency and low-carbon technologies), the project activities are aimed to improve the energy and environmental performance of urban areas, through the development of integrated technologies and business models, able to reduce energy consumption and to promote the rational use of natural resources.
The project, ending on 31 December 2015, focus on the Italian Regions of Calabria and Apulia and contemplates a final experimental phase in the cities of Cosenza and Bari, where the most important aspects of research will be presented.
The research has the ambitious goal to deepen the many issues related to the transformation, already under way, of the supply and management model of energy resources. The harmonized management, into a single framework that would give greater and more immediate value to citizens and its leaders, first will provide the information and tools necessary to start the slow, but indispensable, cultural evolution toward a more conscious management of energy and environment resources in urban settings.
In this way, two “Urban Control Centres” will be implemented in Bari and Cosenza, respectively, with the goal to provide energy/environmental information to the public administration, to the citizens and to all interested players. The “Urban Control Centres” will help in the planning of city energy needs, thanks to objective and reliable data, in the management of local critical situation and in the cultural evolution of the citizens about the rational use of limited energy resources, taking care of the environment.
The “Urban Control Centres” will be the final and touchable product of different research lines, followed to implement an optimized management of energy resources:
1. Research and develop of new Smart Grid applications, linked to the management of the BT distribution network, to integrate the renewable sources, to improve the service quality to the clients and the energy efficiency. Among these applications, those able to provide new value-added services to the end users, to increase awareness about energy consumption, and to encourage the use of the most appropriate storage solutions, will be searched.
41 2. Research and development of new technical solutions and applications enabling innovative services within the building (Smart Building). Monitoring, coordinating and modulating in time the energy needs at the level of individual dwelling, building or building networks, optimizing the management of energy sources and integrating renewable energy sources installations through innovative solutions (heat storage, solar cooling), new services aimed to increasing energy efficiency in buildings will experience. 3. Research and development of new management techniques of urban elements
referring to energy and environmental impact (e.g. street lighting, storm water, car port, energetic characterization of public buildings or buildings with public value as monuments). Through the modelling of smart objects, where physical objects are equipped with detection, calculation and communication capabilities and are able to perceive and interact with the environment and with other intelligent objects, the real time monitoring of energy use will be possible. In this way, it will possible to define rational and self-regulating energy uses for public goods in open urban areas (Smart
Street).
In particular, the Centers in Bari and in Cosenza will be two pilot demonstrators aimed to create efficient and sustainable urban contexts in which the energy distribution systems, buildings networks and production from source renewable energy, ICT infrastructure are able to provide solutions that ensure integration and interconnection, awareness of the state of the system and its most critical components, ability to evolve and adapt quickly to the changing external conditions. In Bari, the pilot demonstration will manage the BT network in smart grids optical thanks to experimentation of a monitoring and control system of network parameters and the new application developed during the research project. All results will be implemented in the "Urban Command Center", an information network supported by hardware and software systems, creating a modern system of control and management of energy resources available to the Public Administrations.
42
In Cosenza, the pilot demonstrator, named “Demo Cosenza”, aims to make the citizens participating in the daily and simple use of the strategies able to reduce greenhouse gas emissions through energy technology, object of the project research. The aim is to make available the effects of the research, to transfer the results in tangible and interactive demonstration objects, the use of which is stimulated by digital systems of information and social formation to enable citizens, at the same time, to trigger collaborative processes to improve the usability of the results.
“Demo Cosenza” will include a “Smart Street”, that is the principal street which connects the city centre to the inner city, will equip with a Wi-Fi network. In the Smart Street, the sculptures of Bilotti Museum (MAB), will become Virtual Objects, that is interactive objects able to provide information to users who walk in the Smart street even the “Urban Lab CreaCosenza”, a space addressed to the needs of communication, education and participation.
The purpose of the proposed demonstrator is to highlight how the various technologies and communication and control systems developed during the research activities are integrated with each other and how these technologies and systems can interact with other projects about the smart and sustainable use of the city.
This will be demonstrated through the implementation, at prototype level, of a Smart User Network (SUN) that, in addition to the elements of Smart Street, will also integrate renewable sources of energy production, storage systems, etc. in order to supply, with high degree of reliability, critical and/or not-critical utilities.
The research developed in the three years of Ph.D. School starts from these points.
2.2. The Smart User Network – SUN [125]
First, an idea of smart MicroGrid has been implemented during the Project RES NOVAE. In Fig.21, the particular configuration of MG called Smart User Network –
43 Figure 21: Smart User Network
In the SUN, the MS are connected to a common DC bus through appropriate Power Converters (PC), while the connection to the grid is realized by a Power Electronic Interface (PEI), in order to provide the required flexibility to ensure operation as a single aggregated system and to maintain the specified power quality and energy output. Electrical loads can be in AC or DC thanks to the presence of the common DC bus: depending of AC or DC type, they require an appropriate Converter.
The SUN is separated from the public distribution network using the Main Switch, the opening of which determines the islanding operation of the MG. The PEI controls the bi-directional power flow between distribution network and user network: it works as MGCC, understanding the SUN condition (grid-connected or islanded), knowing the direction of energy flows (absorbing or injecting energy), detecting any critical situation and deciding in that situation what loads must supply or not. The other PC act as LC or MC devices: they are not simple converters, but they are implemented to detect any abnormal condition.
The most important particularity of the SUN is the presence of storage systems. The use of one or more of the aforementioned energy storage systems can effectively compensate for load variations, so making possible to operate transmission, sub-transmission and distribution networks with lighter designs, that is to say, energy storage can be used instead of more complex, expensive and inefficient needed
44
solutions (oversizing of base-load generation units, peaking generation units based on combustion turbines, ...).
Moreover, taking advantage of the new contest of the free market of the electrical energy, in a distribution grid with energy storage systems, electrical energy can be purchased at low rates, can be stored and, then, can be sold, during a peak of the load demand, at a higher rate. Finally, in the illustrated micro Smart Grid configuration, the electric vehicles and the charging stations have a significant potential impact on the energy absorbed from the grid or provided by renewable energy micro-sources or by the storage systems [125].
The SUN represents the point of departure of all the research results: indeed, in the following, the possibility to control and manage opportunely the generation and consumption of a user, passes through the chance to have a network that allows to provide information about generation and consumption, to act on these parameter, to operate quickly on critical events.
2.3. The Prosumer Problem [126]
Near to the possibility to control and manage production and consumption profile of a prosumer, the implementation of a local trading passes through the participation of the prosumer to the DR programs, as said in Section 1. In this direction, a model to illustrate how the participation to DR program, can vary the load profile of a prosumer has been studied.
The prosumer is considered as a residential unit with some appliances. An appliance may be used more than one in the H-hour. Then, let A denote the set of appliances in this unit, which may include a washer/dryer, a refrigerator, a plug-in hybrid vehicle, etc. For each appliance a∈A, an energy consumption scheduling vector xa is defined
as follows:
xa:[x1a;……; xHa]
where H≥ 1 is the scheduling horizon that indicates the number of hours ahead which are taken into account for decision making in energy consumption scheduling.
45 For each upcoming hour of the day h∈H, {1;……;H}, a real-valued scalar xh
a≥ 0
denotes the corresponding one-hour energy consumption that is scheduled for appliance a∈A. On the other hand, let Ea denote the total energy needed for the
operation of appliance a∈A. Clearly, we always have αa<βa.
Given the pre-determined parameters Ea, αa and βa, in order to provide the required
energy for each appliance a∈A in times within the interval [αa; βa], it is required that:
(1) Further to the constraint (1), it is expected that xa = 0 for any h<αa and h>βa as no
operation (thus energy consumption)is needed outside the time frame [αa; βa] for
appliance a. All home appliances have certain maximum power levels denoted by
γamax, for each a∈A. Some appliances may also have minimum stand-by power levels γamin, for each a∈A. Therefore, the following lower and upper bound constraints are
required on the choices of the energy scheduling vector xa for each appliance a∈A:
(2) Finally, there is usually a limit on the total energy consumption at each residential unit per hour. This limit, denoted by Emax, can be set by the utility to impose the
following set of constraints on energy scheduling:
(3) When appliances a∈A of type “off” and “on” (that is appliances with discrete energy consumption levels) exist, for each of these appliances and at each hour h∈H, let yh
a
denote an auxiliary binary variable such that yh
a =1 if appliance a is “on” and yha=0
otherwise.
By definition, the former requires an energy consumption level of xh
a=γamin whereas
the latter requires an energy consumption level of xh
a=γamax. Therefore, for each
appliance a∈A, the relationship between the energy consumption scheduling vector
xa and the auxiliary vector y, [y1a……….yHa] can be expressed as follows:
![Figure 3: Energy demand for residential/commercial sector, trasportation and industrial sector (Source: [11])](https://thumb-eu.123doks.com/thumbv2/123dokorg/2872888.9546/11.892.150.761.261.508/figure-energy-demand-residential-commercial-trasportation-industrial-source.webp)
![Figure 5: Electricity demand, Global electricity supply per sectors and Global capacity to integrate renewables (Source: [11])](https://thumb-eu.123doks.com/thumbv2/123dokorg/2872888.9546/12.892.130.788.564.778/figure-electricity-global-electricity-sectors-capacity-integrate-renewables.webp)
![Figure 8: Estimated renewable energy share of global final energy consumption 2013 (Source: [22])](https://thumb-eu.123doks.com/thumbv2/123dokorg/2872888.9546/14.892.139.721.533.750/figure-estimated-renewable-energy-global-energy-consumption-source.webp)
![Figure 10: Reweable power generation by region (Source: [6])](https://thumb-eu.123doks.com/thumbv2/123dokorg/2872888.9546/15.892.192.694.173.384/figure-reweable-power-generation-region-source.webp)
![TABLE II. G ROSS P RODUCTION PER SOURCES 2009-2013 [GW H ] (S OURCE : T ERNA , AEEGSI)](https://thumb-eu.123doks.com/thumbv2/123dokorg/2872888.9546/17.892.203.714.199.457/table-ii-ross-roduction-sources-ource-erna-aeegsi.webp)
![Figure 13: Example of Smart Grid (Source: [33])](https://thumb-eu.123doks.com/thumbv2/123dokorg/2872888.9546/22.892.135.744.545.729/figure-example-smart-grid-source.webp)