Activated carbon coupled with advanced biological wastewater treatment: a review of the enhancement in micropollutant removal
Marina Gutiérrez-Pulpeiro, Vittoria Grillini, Dragana Mutavdžić Pavlović, Paola Verlicchi
PII: S0048-9697(21)03121-1
DOI: https://doi.org/10.1016/j.scitotenv.2021.148050
Reference: STOTEN 148050
To appear in: Science of the Total Environment
Received date: 22 February 2021 Revised date: 20 May 2021 Accepted date: 21 May 2021
Please cite this article as: M. Gutiérrez-Pulpeiro, V. Grillini, D.M. Pavlović, et al., Activated carbon coupled with advanced biological wastewater treatment: a review of the enhancement in micropollutant removal, Science of the Total Environment (2021), https://doi.org/10.1016/j.scitotenv.2021.148050
This is a PDF file of an article that has undergone enhancements after acceptance, such as the addition of a cover page and metadata, and formatting for readability, but it is not yet the definitive version of record. This version will undergo additional copyediting, typesetting and review before it is published in its final form, but we are providing this version to give early visibility of the article. Please note that, during the production process, errors may be discovered which could affect the content, and all legal disclaimers that apply to the journal pertain.
Activated carbon coupled with advanced biological wastewater treatment: a review of the enhancement in micropollutant removal
Marina Gutiérrez-Pulpeiro1, Vittoria Grillini1, Dragana Mutavdžić Pavlović2, Paola Verlicchi1*
1. Department of Engineering, University of Ferrara, Via Saragat 1, 44122 Ferrara, Italy [email protected], [email protected], [email protected] 2. Department of Analytical Chemistry, Faculty of Chemical Engineering, University of
Zagreb, Trg Marka Marulića 19, 10000, Zagreb, Croatia, [email protected] *Corresponding Author
Abstract
This study consists of a review on the removal efficiencies of a wide spectrum of
micropollutants (MPs) in biological treatment (mainly membrane bioreactor) coupled with activated carbon (AC), (AC added in the bioreactor or followed by an AC unit, acting as a post treatment). It focuses on how the presence of AC may promote the removal of MPs and the effects of dissolved organic matter (DOM) in wastewater. Removal data collected of MPs are analysed versus AC dose if powdered AC is added in the bioreactor, and as a function of the empty bed contact time in the case of a granular activated carbon (GAC) column acting as a post treatment PT. Moreover, the enhancement in macropollutant (organic matter, nitrogen and phosphorus compounds) removal is analysed as well as the AC mitigation effect towards membrane fouling and, finally, how sludge properties may change in the presence of AC. To sum up, it was found that AC improves the removal of most MPs, favouring their sorption on the AC surface, promoted by the presence of different functional groups and then enhancing their degradation processes. DOM is a strong competitor in sorption on the AC surface, but it may promote the transformation of GAC in a biologically activated carbon thus enhancing all the degradation processes. Finally, AC in the bioreactor increases sludge floc strength and improves its settling characteristics and sorption potential.
Keywords Activated carbon, biological activated carbon, hybrid membrane bioreactor,
micropollutants, removal efficiency, removal mechanisms.
Acronyms and Abbreviations AC: Activated carbon
BAC: Biologically activated carbon BET: Brunauer–Emmett–Teller BOD5: Biological oxygen demand
CAS: Conventional activated sludge CEC: Contaminant of emerging concern COD: Chemical oxygen demand
D617: 3-(3,4-Dimethoxyphenyl)-2-methyl-6-methylaminohexane-3-carbonitrile DEET: N,N-diethyl-m-toluamide
DOC: Dissolved organic carbon DOM: Dissolved organic matter
Dow:: octanol water partition coefficient
EBCT: empty bed contact time E1: Estrone
E2β: Estradiol E3: Estriol
EBV: Empty bed volumes EE2: 17α-ethinylestradiol
EPS: Extracellular polymeric substances GAC: Granular activated carbon
HRT: Hydraulic retention time kbiol: Biological degradation rate
Kd: Solid liquid partition coefficient
Kow: Octanol water distribution coefficient
LC-OCD: liquid chromatography organic carbon detection MBR MBR + AC MPs MPs AC dose AC dosage point AC working age DOM MBR operational conditions Enhancement of removal efficiencies of key MPs R em o v al, % R emo v al , % AC → BAC ↑adsorption ↑biodegradation Reasons for removal enhancement
Scale comparing percentage removal of all key MPs
M P 1 M P 2 M P 3 M P 4 M P 5 M P 6 M P 7 M P 8 M P 9 MP 10 M P 1 M P 2 M P 3 M P 4 M P 5 M P 6 M P 7 M P 8 M P 9 MP 10
Journal Pre-proof
LOD: Limit of detection LOQ: Limit of quantification MBR: Membrane bioreactor MF: Microfiltration
MLSS: Mixed liquor suspended solids
MLVSS: Mixed liquor volatile suspended solids MP: micropollutant
PAC: Powdered activated carbon PFOA: Perfluorooctanoate PFOS: Perfluorooctane sulfonate
pHPZC: pH value at the point of zero charge
pKa: Acid dissociation constant at logarithmic scale
PT: Post-treatment
RSST: Rapid Small Scale Column Test SMP: Soluble microbial products SRT: Sludge retention time TMP: Trans-membrane pressure TOC: Total organic carbon UF: Ultrafiltration
WWTP: Wastewater treatment plant
1 Introduction
In the last two decades, there have been extraordinary developments in membrane technologies applied to wastewater treatment. Membrane bioreactors (MBRs) have become a widely used technology treating urban (Xiao et al., 2019) and industrial wastewater (Cattaneo et al., 2008). The combination of a biological treatment with a membrane separation provides a better-quality effluent over conventional activated sludge systems (CAS) regarding many regulated contaminants, in particular suspended solids and microorganisms.
Among the improved characteristics, MBRs have a lower footprint than CAS, can operate with a wide-ranging loading influent due to a higher biomass concentration and produce less excess sludge (Sipma et al., 2010).
One of the main drawbacks of MBRs is membrane fouling which leads to an increment in the operational and maintenance costs and a reduction in the membrane effective lifespan. However, accurate membrane maintenance planning can counteract it (Xiao et al., 2019). Depending on the nature of the influent and the required effluent quality, promising insights have been obtained in recent years using advanced biological systems (MBRs) in combination with innovative treatment technologies: these systems are often called hybrid MBRs (Alvarino et al., 2017) or integrated MBRs (Neoh et al., 2016; Woo et al., 2016). Some have been consolidated, such as activated carbon (AC) and ozonation, while others have not yet been intensively implemented, such as advanced oxidation processes, membrane distillation bioreactors, biofilm/bio-entrapped MBRs, and nanofiltration/reverse osmosis
(Rizzo et al., 2019). In fact, hybrid MBR is designed not only to guarantee specific effluent quality, but also to improve the MBR operation. In this way, the use of adsorbents, such as AC, to mitigate membrane fouling has been the subject of research efforts in recent years (Iorhemen et al., 2017).
Wastewater treatment plant (WWTP) influent is characterised by a high content of organic matter. Of all the substances commonly found, there has been a focus on micropollutants (MPs) in recent years (Verlicchi et al., 2012). MPs consist of substances from natural and anthropogenic sources and, although their origin can be very diverse, they are strictly correlated to mass-produced materials for anthropogenic activities. While most MPs in WWTP influents range from ng/L to µg/L, some can exhibit higher concentrations (Verlicchi et al., 2012). In this context, biological treatments (mainly CAS and MBR) have not been designed to remove MPs from wastewater, but conventional macropollutants (namely suspended solids, organic substances, nitrogen and phosphorus compounds, microorganisms), and thus some of the most commonly consumed or recalcitrant MPs can be found in WWTP effluents at > 1 µg/L (Verlicchi et al., 2012).
Their vast occurrence and diversity, together with the lack of European regulations on their removal in WWTPs and their occurrence in the aquatic ecosystems (Rizzo et al., 2019), entail potential risks for human health and aquatic life, making them contaminants of emerging
concern (CECs) in the sense clearly stated by (Barceló, 2003) and remarked more recently by
(Sauvé and Desrosiers, 2014) and UNESCO
(https://en.unesco.org/emergingpollutantsinwaterandwastewater). Their main characteristic is such that they may be subject to future regulations depending on monitoring data on their occurrence in the different aquatic environments, the results of research on their potential health effects and their contribution to the development of antibiotic resistant bacteria. Their persistence in the environment does not necessarily lead to negative effects, as their transformation or removal rates can be compensated by their continuous release into the environment. In the following, the term “micropollutants” will be used.
The high adsorption capacity of AC has been proposed as one of the most promising mechanisms to remove MPs from wastewater. Adsorption processes do not generate toxic by-products in comparison with other advanced technologies used in hybrid MBRs (e.g. ozonation, photocatalysis) and may also remove biological treatment inhibitors at the same time. One drawback to consider is the potential reduction in AC adsorption capacity due to the presence of dissolved organic matter (DOM) which is present in the stream under treatment (Guillossou et al., 2020; Margot et al., 2013). However, adsorbed DOM may
contribute to the development of microorganisms on the AC surface, enhancing biodegradation processes by the attached biomass (Fundneider et al., 2021b). In this way, design parameters and operational conditions that could contribute to increase the efficiency of the hybrid systems are crucial (Grandclément et al., 2017).
The inefficacy of conventional treatments in removing MPs determines the need for combined systems able to promote different removal mechanisms which could assure a reduction in MP levels and a lower impact on the receiving waters (Rizzo et al., 2019; Siegrist and Joss, 2012). The enhancement of MP removal by adsorption and biodegradation has therefore been studied among different configurations of MBR integrated with AC, both in the case of powdered activated carbon (PAC) or granular activated carbon (GAC).
This review aims to give a snapshot of the removal achieved for a wide spectrum of MPs from wastewater by means of hybrid MBRs, corresponding to MBRs where AC is added in the bioreactor and also to MBRs coupled with AC (in which the AC stage represents a polishing treatment) as well as of the quality (occurrence of MPs) in the final effluent of hybrid MBRs. The review attempts to respond to the following questions: Is it possible to increase the removal efficiency of selected MPs from wastewater by the addition of AC in an MBR or by coupling the MBR with a polishing AC treatment? What are the best PAC dosages or GAC bed characteristics to achieve the best MP removal efficiency? How does AC influence the MBR operation?
In order to provide the tools needed to answer these questions, an in-depth focus is first carried out on the main MP removal pathways occurring once AC is present in the wastewater under treatment and then a literature survey is presented and discussed on the removal efficiencies of a wide spectrum of MPs referring to different combinations of AC and MBR as well as applied operational conditions. The influence on MP removal of the main MP characteristics, AC properties, design and operational parameters and DOM presence is discussed as well as how AC may influence MBR operations, on the basis of lessons learned from collected studies.
2 Framework of the study
The review refers to a collection of peer reviewed papers identified by applying PRISMA guidelines (Moher et al., 2009). It first reports in detail how this collection was found, and then it discusses quality assurance criteria in order to include or exclude records (studies) and the data reported in them from the selected literature (see the section 3.1).
Briefly, the overview refers to the removal of MPs from wastewater by different configurations involving advanced biological treatments (namely MBRs) coupled with
activated carbon (Table 1). A spectrum of 179 MPs (Table 2), including 20 metabolites, belonging to 30 different classes, was considered: 142 pharmaceuticals, 8 personal care products (antiseptics, synthetic musks and UV filters) and 29 different industrial products (including non-ionic surfactants, stimulants, sweeteners, pesticides and compounds included in the group “Others”). Table S1 reports their main chemical characteristics (molecular weight, Log Kow, Log Dow, pKa and charge).
A presentation is then reported of the main configurations of hybrid MBRs operating in combination with AC as well as in “ancillary” configurations where conventional activated sludge (CAS) treatments are combined with a post-treatment (PT), including a PAC contact tank followed by a UF membrane unit or a GAC column (section 3.2.1). The study continues by focussing on the interactions between AC and organic matter (MPs and DOM) as well as microorganisms when AC is added in the wastewater in the bioreactor or in the PT unit (Section 4). A first comparison is carried out between the removal efficiencies achieved by MBR treatment or and in the case of MBR coupled with PAC/GAC in order to highlight the contribution of the AC for many MPs. Then the analysis refers to MP removal efficiencies and concentrations in the final effluent, with regard to the configurations reported in Table 1 and considering different PAC dosages and the volume of wastewater treated in the GAC column, expressed in terms of number of empty bed volumes (EBVs). The discussion which follows deals with the influence of the main factors affecting MP removal: MP properties, AC characteristics and dosage frequency and mode, and operational conditions in the different configurations (sludge retention time SRT, hydraulic retention time HRT, temperature T, PAC contact time, effluent dissolved organic matter DOM, empty bed contact time, EBCT). The study also explores other effects of AC on removal of macropollutants, mitigation of membrane fouling and MBR sludge characteristics. It then concludes with the identification of the fields requiring further research and investigations.
3 Identification of the studies for the qualitative and quantitative analysis
The present systematic review has been developed following the PRISMA guidelines (Moher et al., 2009), a protocol established in 2009 by international experts that defines the steps to follow to obtain a systematic review on a specific topic. The collection of peer reviewed papers was obtained through Scopus, by the key words “MBR” OR “membrane bioreactor” OR “membrane reactor” AND “activated carbon” OR “AC” and following the eligibility criteria discussed in the Supplementary Material (section S1 and Fig. S1). As a result of this process, a collection of 64 peer reviewed papers, published between 2009 and 2020, was defined including studies presenting and discussing the new trends in the enhancement of the
performance of MBR in combination with AC, in terms of removal efficiency of macro- (BOD5, COD, nitrogen compounds and phosphorus compounds) and micro-pollutants, and fouling reduction and control (Figure S1). Based on these studies and following the PRISMA guidelines, a qualitative synthesis was carried out. Then a further refinement was made, leading to the identification of 26 records on which basis a quantitative synthesis was carried out referring to the removal of MPs in MBR coupled AC (PAC or GAC). A few studies (4) referring to CAS where AC was present were included as they provided useful insights into the analysis of MP removal, as will be discussed later. More details about the process followed to define the collection of papers to be included in the review can be found in the Supplementary Material.
3.1 Quality assurance of the literature data
The studies included in this review had to provide a clear description of the plant configuration and report information on sampling (mode and frequency of sampling and sampled matrices) and the adopted analytical methods of the investigated micropollutants. There had to be sufficient collected data to support the study discussion. Moreover, the studies had to state at which plant scale (lab, pilot or full) the investigations were carried out, and also had to give details on the biological stage (i.e. design parameters and operational conditions), feeding type (real, synthetic or spiked) and mode (continuous or batch), as well as the duration of the investigation in order to evaluate the level of saturation of the AC during the sampling campaigns. As to AC, they had to report the carbon types and main characteristics (see Table 3). Finally, in the case of AC used as a PT, the study had to provide details of a further treatment (often a membrane unit) inserted in the configuration in order to guarantee the separation between treated effluent and AC residues. This separation step is generally adopted in the case of a PAC unit, but in some cases it was placed after a GAC column (Sbardella et al., 2018).
Table S2 (Excel) in the supplementary material collects all the information and shows the main issues addressed in the 26 selected studies providing MP concentrations and removal efficiencies. The remaining 38 out of the preselected 64 papers were included in this review as they contributed to explaining the behaviour of the AC that was added in the secondary or polishing treatment.
Some investigations dealt with the removal mechanisms of specific MPs and often used deionised, modelled water spiked with the key pollutants at the desired concentration (such as Lee et al., 2009). These studies were included in this review as they provide interesting analysis and useful considerations on the removal mechanisms of the investigated
compounds. However, the removal achieved is not included in the graphs reported in this paper as they refer to deionised water and no matrix effect was considered. Investigations referring to synthetic water (see Table S2) were included only if details on the characteristics of the water matrix were clearly reported.
Finally, if the concentration of MP in the investigations was found to be less than its limit of quantification (LOQ), half of the LOQ was assumed. If its concentration was found to be less than its limit of detection (LOD), it was assumed equal to the corresponding LOD. If the authors reported a removal efficiency equal to 100% and they did not provide the LOQ or LOD values, it was assumed that the effluent concentration was equal to 10-4 g/L. Removal efficiencies were not considered in the cases in which MP influent concentrations were found to be less than the corresponding LOQ.
3.2 Main characteristics of the reviewed studies
The reviewed studies were carried out in Australia (5), Spain (5), Switzerland (3), Netherlands (3), China (2), Canada (2), Germany (2), Belgium (1), Sweden (1), United Kingdom (1) and Saudi Arabia (1). The plant configurations are schematically reported in Table 1, together with a brief description of the system and the corresponding references. The studies included lab (46%), pilot (42%) and full-scale plants (12%). In 50% of the studies, the feeding was synthetic wastewater, resulting from the addition of specific compounds miming the matrix effect (the composition is provided), and in 50% it was real wastewater. Out of these, only one study spiked MPs into the real wastewater (Remy et al., 2012). Regarding the real wastewater, 69% was urban and 31% hospital effluent (Itzel et al., 2018), (Langenhoff et al., 2013), (Kovalova et al., 2013b), (Paulus et al., 2019). The feeding was continuous in all the studies with the exception of (Alvarino et al., 2017; Serrano et al., 2011).
Among the selected 26 papers dealing with the occurrence and removal of MPs, some reported details of very complex experimental campaigns and it was possible to identify different investigations in the same paper. An investigation consists of an experimental campaign referring to a specific treatment configuration/scenario (MBR equipped with MF or UF membranes, coupled with PAC or GAC), under defined conditions (for instance dosage of PAC or empty bed contact time in GAC column). According to this definition, there was a total of 46 investigations regarding the selected records: their details are reported in Table S2 on the line Investigations on micropollutants.
3.3 Configurations included in the review
The reviewed configurations belong to three main groups depending on the treatment stage in which AC is present and on AC type: PAC in the bioreactor (configurations I and II in Table
1); PAC in a post treatment (configurations III–V in Table 1); GAC in a post treatment (packed column, configurations VI-VIII in Table 1).
Submerged (I) and side stream (II) MBRs are separated, but the collected results are presented together.
If PAC is used in the PT, it is added in a contact tank receiving the biological effluent to be treated and dispersed in it (Kovalova et al., 2013b; Margot et al., 2013). Sufficient mixing is required to guarantee homogenous conditions. An additional filter is requested in order to retain the AC powder: the UF membrane unit is always equipped after the PAC contact tank (configurations III-V). PAC retained in this unit can be withdrawn (III and IV) or recycled back to the biological reactor (V). If GAC is used as a PT, its granules are packed in a column which is fed and crossed by the biological effluent. In order to clean the GAC filter and remove the retentate, a backwash is planned and periodically carried out (Baresel et al., 2019). A UF unit after the GAC column was found only in one study (VIII). Despite the main aim of this review being the analysis of the performance in a hybrid MBR, four studies referring to CAS coupled with AC (configurations III, VII and VIII) were also included. Two studies explore the effect of a PAC unit after a CAS (Löwenberg et al., 2014; Margot et al., 2013) and another two explore the combination of a CAS with GAC ((Grover et al., 2011; Sbardella et al., 2018). The reason for their inclusion is that they further investigate the removal of MPs and provide useful information to also explain MP removal in a hybrid MBR. As reported in Table S2, in 26 out of the 46 investigations, PAC was added in the bioreactor, in 7 PAC was used as a PT and in 13 GAC was used as a PT. In the following sections, it was assumed that if the powder of activated carbon is added in the biological reactor (MBR or CAS), the system is reported as (MBR+PAC) or (CAS+PAC), whereas, if activated carbon is used in a separate tank, the configuration will be represented with these symbols: MBRPAC or GAC; CASPAC or GAC.
It is important to remark that the operation, in case AC is added in the bioreactor or AC acts as a PT by means of PAC or GAC, is regulated by different parameters depending on the three main configuration groups. In MBR+PAC they are (i) the hydraulic retention time
(HRT) of the wastewater in the bioreactor which must be long enough to guarantee MP
transfer from the liquid phase to the PAC surface or its absorption in the floc; (ii) the sludge
retention time (SRT) which must be long enough to promote the development of different
species of microorganisms able to degrade different MPs, (iii) the AC retention time in the bioreactor which is the time AC spends in the tank before its disposal or before it leaves the bioreactor embedded into the floc (in general it is ≥ SRT); finally (iv) the AC working age
which measures the time since it was added in the system (an indirect measure of AC saturation) which is ≤ AC retention time. In PAC acting as a PT, the specific parameters influencing its performance are: the HRT of the (waste)water in the PAC contact tank; (ii) the
AC retention time in the tank that is the time AC stays in the tank before its withdrawal; and
(iii) the AC working age. In GAC acting as a PT, parameters defining its behaviour are: (i) the HRT of the (waste)water within the AC column which is measured by the empty bed contact time (EBCT); (ii) the filtration velocity vf which is the ratio between the influent flow rate and the surface area of the GAC filter and (iii) the working age which depends on the EBV. EBCT has to be set in order to guarantee the time for the MPs transfer from the bulk phase to the GAC surface and also inside its grain. According to the suggested design parameters in well-known manuals (among them (Metcalf & Eddy, 2014)), EBCT should be at least 5–30 min and vf 5–15 m/h. EBCT may be replaced by the effective contact time that is defined as the product of EBCT and the bed porosity. These specific parameters are reported for each study In Table S2, together with many other details on the investigations. Finally, the period of investigations on micropollutant removal in hybrid MBRs with PAC or GAC varied between 9 days (Kovalova et al., 2013b)(Wei et al., 2016) and 3 years (Grover et al., 2011). Out of the 46 investigations, only a few provided detailed trends of the removal efficiencies in the presence of AC over time. These included (Nguyen et al., 2013a)(Serrano et al., 2011)(Alvarino et al., 2017, 2016; Li et al., 2011; Lipp et al., 2012).
Table 1
3.4 The selected compounds
The analysed micropollutants included 179 compounds belonging to 30 classes (Table 2). The compounds in italics and with an asterisk were investigated, but they were never detected. As a result, 163 compounds are included in the graphs and belong to 28 classes (those with an acronym in Table 2).
Table 2.
The class of calcium channel blockers (M) was included in the list in Table 2 as the compound amlodipine was found in raw wastewater (Baresel et al., 2019). It was removed below its LOD in the MBR and for this reason it does not appear in any figure resulting in the investigated configuration MBRGAC.
3.5 Activated carbon used in the investigations
The activated carbon adopted in the reviewed studies was in most cases in powder form (PAC) and in a few studies in granules (GAC). It was generally supplied by: Norit, Chemviron, Desotec, Sigma Aldrich and ChiemiVall, as reported in Table S2. The size generally ranges were < 50 m for PAC and 100–2,400 m for GAC, in accordance with Metcalf and Eddy (2006), only (Sbardella et al., 2018) adopted a GAC with a higher size range (2,360–4,750 mm). Among the selected 66 papers, it was also found that sometimes AC up to 300 m was considered PAC ((Ng et al., 2013)(Yang et al., 2019)(Zhang et al., 2017)). A few authors provide more details about the particle size distribution of the adopted AC ((Ng et al., 2013)(El Gamal et al., 2018)). Many studies also considered the influence and role of pore size (Alves et al., 2018), which was classified, in accordance with IUPAC (Rouquerol et al., 1994), in micropores (diameter < 2 nm), mesopores (diameter between 2 nm and 50 nm) and macropores (diameter > 50 nm).
The main characteristics of AC are reported in Table 3. The most important ones are Brunauer–Emmett–Teller BET specific surface area as it is a measurement of the potential surface area available for promoting the different removal mechanisms which will be discussed later on; iodine number which is a measure of the pore volume available in the AC mass; pore diameter defining the size of the particles which can enter the porous structure of the grain; and the apparent or bulk density, that is the mass of AC contained in a unit volume (including particle, inter-particle void and internal pore volume).
In addition, the point of zero surface charge (pHPZC) is another important characteristic, reported in some study (Alves et al., 2018; De Ridder et al., 2011; Kovalova et al., 2013b, 2013a), which defines the pH at which there are as many positively charged functional groups as negatively charged functional groups on the AC surface (pHPZC between 6.5 and 8 indicating that their surface is slightly positively charged or negatively charged at neutral pH, (De Ridder et al., 2011)). At wastewater pH below pHPZC, the carbon surface is mostly positively charged and, above the surface, it is mostly negative charged. It is important to know this threshold, as the adsorption process is most effective for uncharged apolar adsorbates (Alves et al., 2018).
Only one study (Alves et al., 2018) investigated the influence of the activation type (by steam or by chemicals) of the carbon and compared the results at lab level and (Choi et al., 2005; Paredes et al., 2018) explored the effect of the GAC type on removal efficiencies and GAC lifetime.
Table 3
On the basis of origin and activation mechanism, ACs present a high heterogeneity (Benstoem et al., 2017). However, it is worth noting that the selection of virgin and reactivated carbon and the operation time may influence the adsorption capacity as their characteristics may change over time (Benstoem et al., 2017; Choi et al., 2005).
In the investigations with PAC added in the bioreactor, the dosage was between 0.004 g/L (Remy et al., 2012) and 20 g/L (Asif et al., 2020). In the following analysis the dosages considered are discretized as: < 0.05 g/L, 0.051 g/L; 0.25 g/L, 0.5 g/L; 0.75 g/L, 1–2 g/L and 20 g/L. The highest dosage (20 g/L) was selected on the basis of the batch test carried out by (Asif et al., 2020). It had to guarantee a very high removal (> 90%) of soluble microbial products (SMP) in the biological tank and under unsaturated conditions for PAC over the whole investigation.
As to the GAC column, the removal efficiency is often expressed as a function of the number of empty bed volumes (EBV), defined as the ratio between the treated (waste)water volume and the GAC column volume.
4 The role of activated carbon in the removal of micropollutants
Activated carbon may be added in the bioreactor or it can be used as a PT fed by the secondary effluent or the permeate, as reported in Table 1. Its presence favours similar removal mechanisms for the micropollutants in the case of granules (GAC) or powder (PAC). As shown in Table 3, PAC and GAC are characterised by a high specific surface (m2/g) due to the presence of micro-, meso- and macropores. The internal structure of a grain, without taking into consideration its specific size, is reproduced in Figure 1A. On its whole surface there is a high number of active sites where compounds (micro- and macro-pollutants) occurring in the wastewater can bind, depending on their affinity with the AC surface, and thus they are removed from the liquid phase via sorption mechanisms. Pores in the granule or in the powder are of different sizes resulting in different thresholds for the size of the molecules which can penetrate and then adsorb on the internal surface of the AC grain.
Micropollutant affinity towards an AC is strictly correlated to the physical and chemical characteristics of the AC (Section 3.2.3), namely pore size and texture, surface functional groups (Figure 2C) and charge, and mineral matter content (Alves et al., 2018; Choi et al., 2005; Fuente et al., 2003; Kovalova et al., 2013b). Micropores are directly responsible for MP adsorption (El Gamal et al., 2018) as shown in Figure 1B.
Adsorption is expected to decrease over time due to a gradual saturation of the active sites during operation (Choi et al., 2005). Dissolved organic matter (DOM), and in particular the
fraction of low molecular weight organics (see section 6.1.8), if present in the liquid phase in contact with AC, tends to adsorb on the AC surface (Filloux et al., 2012). Organic particles may enter the macropores, thus they may represent a barrier for the MPs in their movement to reach the active sites of meso- and micropores. DOM and MPs are numerically present at different levels. In this context, (Rattier et al., 2012) found that DOM acts as a strong competitor when it occurs 103–106 times higher than MPs. In the presence of DOM in the liquid phase (wastewater under treatment), microorganisms may develop on the AC surface area and macropores (Alves et al., 2018), promoting the growth of a biofilm, thus favouring biodegradation processes due to microorganism metabolic reactions. The AC thus becomes
biologically activated carbon (BAC) (Figure 1C). The MP biodegradation processes are
enhanced here due to the development of a more specialised biomass, and the coexistence of aerobic and anoxic zones in this biofilm (Alvarino et al., 2016). MPs occurring in the wastewater may be sorbed by two mechanisms: adsorption due to electrostatic interactions between MP charged groups and the oppositely charged biofilm or AC surface, and
absorption into the biofilm stratum due to MP hydrophobic interactions of the aliphatic and
aromatic groups with the lipophilic cell membrane of the microorganisms or the lipid fractions of the suspended solids. Then some may biodegrade by means of microorganisms in the biofilm, transform and even mineralise; others may remain as they are (Baresel et al., 2019) (Figure 1).
Figure 1
When AC is added in the bioreactor, it comes into contact with the flocs (activated sludge): some AC particles are incorporated within them, others are suspended within the liquid phase, depending on the AC added quantity (Ng et al., 2013) (Remy et al., 2010) (Figure 2A). Sludge flocs are dynamic systems where incorporated AC particles may be covered by the biofilm becoming BAC or they may have their surface partially free (Figure 2B). In this last case, MPs may directly adsorb on the AC surface. If the AC is covered by the biofilm, MPs may be absorbed in the biofilm, desorbed from it and adsorbed on the smallest AC pores. Bacteria can only colonise macropores due to size exclusion. Extracellular polymeric substances (EPS) instead can also enter into meso- and micropores and thus act as a catalyst for the biodegradation processes of MPs which manage to reach the surface of these pores and attach to it (Alves et al., 2018).
Figure 2.
If AC acts as a PT, by PAC (as reported in Pills, 2012) or GAC (Sbardella et al., 2018), the development of the biofilm on its surface is still possible: DOM may be retained by the granules (Seo et al., 1996; Sun et al., 2020) and, over time, it may promote the growth of an autochthonous biomass (Sbardella et al., 2018). Sorption and biodegradation are complementary mechanisms that extend the AC life. During backwashing operations of the GAC filter, some MPs could be detached from the filter and found in the backwash water (Baresel et al., 2019). At long operating times, mature or aged biofilm developed on the AC surface may detach giving rise to the biological regeneration process. This cleans the AC surface, and the AC active sites are now free for MP adsorption even at long operating times. The regeneration is not able to create the original conditions and AC replenishment may become necessary to guarantee optimal operating conditions.
To sum up, MP removal mechanisms are the results of continuous interactions among MPs and AC particles, biofilm and organic matter. For this reason, BAC has to be considered a dynamic system where MP sorption and biodegradation occur simultaneously (El Gamal et al., 2018).
4.1 Common parameters and coefficients used in predicting MP removal
The sorption potential of an MP onto an AC is given by its solid water distribution coefficient
Kd defined by eq. 1:
𝐾𝑑 = 𝑐𝑠𝑜𝑟𝑏𝑒𝑑
𝑐𝑑𝑖𝑠𝑠𝑜𝑙𝑣𝑒𝑑 (eq. 1)
where csorbed is the concentration of the compound of interest sorbed on the AC ( g/kg), cdissolved is the MP concentration in the liquid ( g/L). Kd is expressed in L/kg. It is strictly
correlated to the nature of the adsorbent (case specific). A rapid look at the literature on MP sorption on AC shows that experimental values are very scarce (Yang et al., 2012).
As remarked in (Dickenson and Drewes, 2010; Mailler et al., 2015; McArdell et al., 2011; Rattier et al., 2012), MP sorption onto the surface of a particulate matter (activated sludge or AC) is due to MP hydrophobicity (absorption) and to electrostatic interactions between positively charged compounds and negatively charged solid surface (adsorption).
The octanol water distribution coefficient Dow can be used to predict its behaviour.
It is a modification of the octanol-water partition coefficient (Kow defined by eq. 2) accounting for ionisation of the compound (for non-ionisable compounds Dow and Kow have the same value) and it also considers attraction by the solid (correlated to pKa). Equations 3 and 4 corresponds to the correlations between Kow and Dow for acidic and basic compounds respectively.
𝐾𝑜𝑤 ≡ concentration in 𝑛−octanol
concentration in wate𝑟 (eq. 2) 𝐿𝑜𝑔 𝐷𝑜𝑤 = 𝐿𝑜𝑔 𝐾𝑜𝑤 + 𝐿𝑜𝑔 1
1 + 10𝑝𝐻− 𝑝𝐾𝑎 (acidic compound) (eq. 3)
𝐿𝑜𝑔 𝐷𝑜𝑤 = 𝐿𝑜𝑔 𝐾𝑜𝑤 + 𝐿𝑜𝑔 1
1 + 10𝑝𝐾𝑎− 𝑝𝐻 (basic compound) (eq. 4)
For neutral compounds Log Dow = Log Kow and for ionic solutes Log Dow < Log Kow
However, even if Dow is corrected for charge (through pKa), it only reflects how polar the compound is. Adsorbability prediction for charged compounds is more complex, as different mechanisms are involved as it will be better discussed in section 6. Table S1 reports Log Kow, p Ka and Log Dow at different pH as well as charge at pH=7 for the different compounds included in this study.
As to biodegradation, the kinetic constant kbiol is influenced by the operational conditions set in the bioreactor (mainly biomass concentration and type, HRT, and temperature), MP characteristics, and the availability or limitation of substrates which define the type of biodegradation process (by metabolism or cometabolism) (Alvarino et al., 2018). These considerations explain the reasons why predictions are quite difficult and experimental data are often not in agreement with such data.
5 Results
Collected data provided by the investigations included in this review were processed in order to compare the MP removal achieved by the selected configurations in Table 1, at different AC dosages and under different operational conditions. Moreover, AC working age and behaviour over time were also explored and discussed. The first analysis carried out refers to the contribution of AC in removing MPs in the case of PAC added in the bioreactor (Figure 3) or GAC used as a PT (Figure 4) in comparison with the removal achieved by a biological treatment alone. It was not possible to compare MP removal achieved by the biological step alone or in the case of the biological step being followed by a PAC unit due to lack of corresponding values in the biological stage (Kovalova et al., 2013b; Lipp et al., 2012; Löwenberg et al., 2014; Margot et al., 2013).
In Figures 3 and 4, lower case letters at the top of the graph correspond to the specific studies reported below the figure. In some cases, the same compound has been the subject of more than one investigation (for instance, in Figure 3, diclofenac was investigated in 6 studies called: a, b, d, f, g and i). Compounds belonging to a class are grouped together and the name of the class is reported in upper case (according to Table 2) at the bottom of the graph. Finally, the separate grid shows when the micropollutant was released. This means that negative removal efficiencies were reported in the reviewed papers, occurring in MBR alone (more often) and/or in MBR combined with AC (only for carbamazepine, (Li et al., 2011)).
Figures 3 and 4 do not correlate removal efficiencies with specific operational conditions and configurations: the hybrid MBR is considered a black box and the details regarding quantity of added PAC or operational conditions referring to PAC or GAC are not reported, or when the PAC is added (in the anoxic or in the aerobic compartment): they will be discussed in section 6.
In more detail, Figure 3 refers to the removal achieved for 48 compounds belonging to 13 classes in MBR and (MBR+PAC). It emerges that the presence of AC added in the biological tank improves the removal of most of the compounds: it occurred in 79 out of the 108 reported cases. In 13 of the remaining 29 cases, MP removal did not improve and, according to the authors, this was due to the fact that the compound was almost completely removed in MBR and, due to the presence of AC, the contribution was not relevant (Nguyen et al., 2013a). In the last 16 cases, the MBR presents a higher removal efficiency than the corresponding case of MBR+PAC. Details of these analyses are reported in Table S3. Briefly: higher MP removal values found in MBR alone compared to MBR+PAC were related to removal data referring to different AC working age (Alvarino et al., 2017; Nguyen et al., 2013a), different sludge properties resulting in different characteristics of the cake developed against the membrane and thus cake filtration performance (Alvarino et al., 2017) and accidental temperature drop (Li et al., 2011). As to Figure 4, it includes 22 compounds belonging to 9 classes and 44 columns. The removal in MBRGAC was higher in 27 64 cases than in MBR alone. In 16 cases, MBR reached almost complete removal efficiencies and the removal efficiency did not increase after the GAC stage. In only one case referring to paracetamol, the trend is not clear.
Table S4 reports further details about this analysis. Due to a lack of data referring to the removal efficiencies for MPs achieved in MBR alone, but only in GAC as a PT, data reported in (Baresel et al., 2019; Grover et al., 2011; Langenhoff et al., 2013; Sbardella et al., 2018) were not included in this figure.
Figure 3 shows that MP release occurred occasionally with the only exception of trimethoprim, which was always released in the investigations by (Serrano et al., 2011). The authors explained this finding by the fact that nitrifier bacteria were absent in the biomass within the MBR and trimethoprim was not degraded by the different species developed in the microbial community. In the other cases, MP release was ascribed to the following causes: changes in operational conditions (for instance a sharp increment of the MP concentration in the influent) (Li et al., 2011), environmental conditions such as a decrement in temperature which strongly affects biological reaction rates (Li et al., 2011); AC saturation (Alvarino et
al., 2016), re-generation of parent compounds starting from the corresponding metabolites or transformation products (for diclofenac and carbamazepine), (Alvarino et al., 2016). Another possible reason, not reported in the reviewed studies, but often remarked in the literature (Verlicchi et al., 2012), is an inappropriate sampling protocol.
These first rough comparisons lead to the consideration that the presence of AC has the potential to improve removal for most compounds. The influence of the main operational parameters will be analysed in detail in section 6.
Figure 3. Figure 4.
5.1 Removal in MBR+PAC
In order to better investigate the influence of the amount of PAC added in the bioreactor, literature data were reported in Figure 5 considering the different PAC dosages, between < 0.05 g/L and 20 g/L of PAC. PAC dosages were classified as: < 0.05 g/L, 0.05-0.1 g/L; 0.25 g/L, 0.5 g/L, 0.75 g/L, 1-2 g/L and 20 g/L. In Figure S2, the same data are reported according to the Authors. Based on the collected data, 48 compounds belonging to 13 different classes were analysed, and the most studied were: carbamazepine (31 values), diclofenac (28), naproxen and sulfamethoxazole (27), ibuprofen (26), trimethoprim (24), erythromycin (23), roxithromycin (22), EE2 (21) and E1 (20). The remaining compounds have only 1–6 values of removal efficiency. It emerges that all the compounds can be removed by MBR+PAC, even the most recalcitrant diclofenac and carbamazepine. The variability ranges are 32% to 99% for diclofenac, the highest values were found in (Alvarino et al., 2016), and 15% to 99% for carbamazepine, with the top removal reported in (Alvarino et al., 2017). At the lowest doses of PAC (< 0.05 g/L), the removal efficiency is at least 60% with the only exception of sulfamethoxazole (it needs at least 0.25 g/L to achieve 60% removal). The high dosage of 20 g/L in (Asif et al., 2020) was selected in order to guarantee a homogeneous integration of PAC and sludge and to achieve the best rheological properties of the sludge.
An analysis of the collected data highlights that the addition of PAC as low as 0.1 g/L is sufficient to achieve a removal of 80% for 34 out of the 37 compounds which were investigated in this range of PAC addition.
Figure 5.
Data from: (Alvarino et al., 2017, 2016; Asif et al., 2020; Echevarría et al., 2019; Li et al., 2011; Nguyen et al., 2013a; Remy et al., 2012; Serrano et al., 2011; Yang et al., 2012; Yu et al., 2014)
PAC addition in the MBR leads to a relevant increment in PFOS and PFOA removal (Figure 3): from < 7% in the MBR to the range 68% to 94% in the MBR+PAC, depending on the concentration of AC and the compound (Yu et al., 2014). Their removal is only due to adsorption on PAC and 0.08 g/L seems to be enough to reach 80% of removal. The Authors underline that the expected removal with the addition of PAC should be much higher, especially at the highest PAC dosages, but probably because of fouling due to sludge and DOM, the available PAC surface for PFOA and PFOS adsorption was greatly reduced and this was more evident for PFOS, the compound with higher sorption potential (higher Dow, see Table S1). For the most investigated compounds (diclofenac, sulfamethoxazole and carbamazepine), the addition of PAC leads to an increment in removal efficiency, despite its value varying in a range greater than 50%. This leads to the conclusion that PAC added in the MBR does not guarantee a minimum removal for the compounds due to many factors that influence their behaviour, which will be discussed in section 6.
5.2 Removal when AC is used as a post treatment
An analysis of the removal efficiencies achieved when PAC is used as a post treatment is reported in Figure 6: PAC treatment follows the biological step consisting of a CAS (Löwenberg et al., 2014; Margot et al., 2013) or an MBR (Kovalova et al., 2013b). The tested doses were < 0.05 g/L for CAS and MBR and 1-2 g/L for CAS. With regard to the first interval, the tested dosages were 0.008; 0.023 and 0.043 g/L for MBRPAC (light blue square in Figure 6) and 0.0171 g/L for CASPAC (dark square in Figure 6). Referring to the light blue square values, the wide variability emerging from Fig. 6 is strictly correlated to the different dosages. An in-depth analysis is available in the report (McArdell et al., 2011) as well as in (Kovalova et al., 2013b).
Removal values of compounds in MBRPAC < 20% were found at the lowest doses of PAC (0.008 g/L). This was the case for all the contrast media (class N) with the only exception of iopromide which exhibited a removal of 47% already at these dosage conditions. Diatrizoate and ioxitalamic acid were always poorly removed: between 1% and 18% at the different tested doses. Moreover, it was found that poor removal (21% to 35%) is achieved for all contrast media in MBR alone ((Margot et al., 2013) data not shown) and PAC addition may remove them, depending on the added dose. Fluctuations in the removal efficiencies of such recalcitrant compounds also leading to negative values (not shown) may be ascribed to variations in their influent concentrations (Lipp et al., 2012) and to a sampling mode that implies the analysis of the grab or composite samples taken not considering the HRT of the monitored treatment stage (Verlicchi et al., 2012). It emerges that a higher dose is not able to
enhance the removal achieved for diclofenac, sulfamethoxazole, mecoprop and carbamazepine. At the same dose of PAC as a PT after a CAS or an MBR, the removal achieved after an MBR is higher with respect to the removal achieved after a CAS for diclofenac (95% to 99% versus 82% to 85%) and carbamazepine (99% versus 90% to 99%), lower for sulfamethoxazole (2% to 60% versus 58% to 64%) and partially overlapped in the case of benzotriazole (68% to 92% versus 90% to 92%). This can be ascribed to the interactions between the organic matter and the AC surface, which are more relevant in the case of CAS effluent due to its higher concentration with respect to MBR permeate. In these configurations, there was a higher number of compounds with a variability of more than 50% in their removal efficiency compared to configurations I and II (Figure 6) where only three compounds presented such a variability range.
Figure 6.
Data from: (Kovalova et al., 2013b; Löwenberg et al., 2014; Margot et al., 2013)
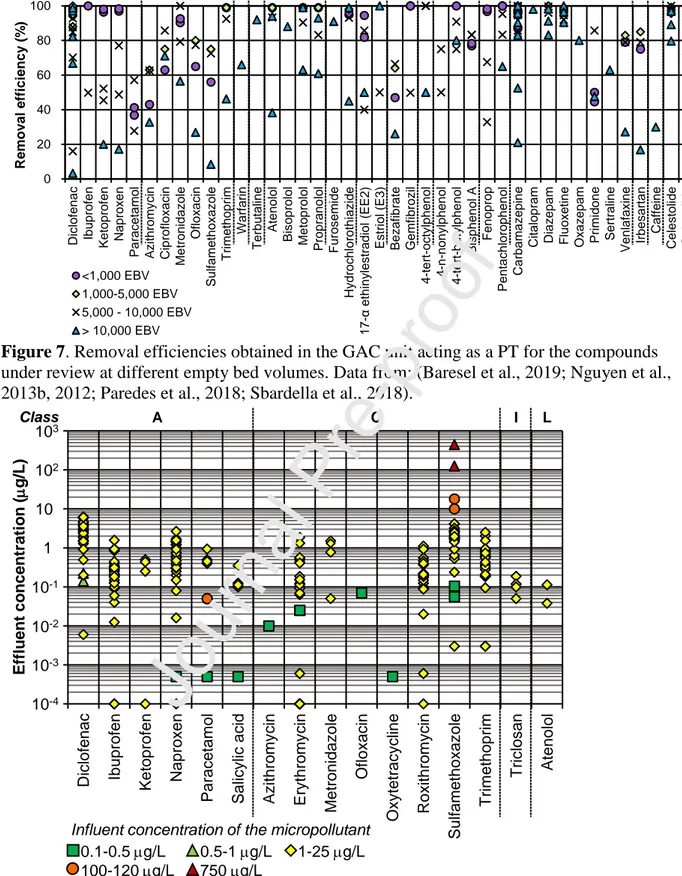
Figure 7 refers to MP removal efficiencies in a GAC column acting as a PT, after the biological step at different empty bed volumes (EBV), that is during the GAC working period. They varied between < 1,000 EBV (Nguyen et al., 2013b, 2012) and 60,000 EBV (Baresel et al., 2019). Some investigations did not report the EBV correlated to the removal values and thus their data are not included in Figure 7 (Grover et al., 2011; Itzel et al., 2018; Langenhoff et al., 2013; Paulus et al., 2019). On the contrary, all the collected data on removal efficiencies in a polishing GAC unit are reported in Figure S3, grouped according to the Authors. It emerges that for most investigated compounds the removal efficiencies vary greatly. The smallest variability intervals were found for bisphenol A (6%, between 77% and 83%), ciprofloxacin (23%, between 63% and 83%), and 4-n-nonylphenol and 4-tert-butylphenol (25% respectively 50% to 75% and 74% to 99%).The widest interval was found for diclofenac (3% to 99%), with the lowest value found in (Nguyen et al., 2013b) and the highest values collected in (Paredes et al., 2018) and (Baresel et al., 2019). The extremely low removal was ascribed to the saturation of the GAC column, whereas the highest removal values may be ascribed to the biological regeneration within the BAC which thus allowed a high and continuous MP removal from the real wastewater, even at high EBVs. As diclofenac is poorly removed in biological processes (20% to 30% as in Figure 4), the contribution of the GAC column in its removal is fundamental. The removal achieved with the GAC filtration is related to MP nature, its biodegradability and sorption potential, the degree of
saturation level of the AC filter, the EBCT, as well as MP concentration in the GAC influent. If a compound is highly removed in the bioreactor, the resulting concentration in the treated effluent is low. In this case, MP removal efficiencies are around 40% to 50% in the GAC column are still to be considered very good as they lead to a very high overall removal. This is the case for ibuprofen, paracetamol, E3, 4-tert-octylphenol, 4-tert-butylphenol and 4-n-nonylphenol. When MP removal in the bioreactor is moderate and also variable in a wide range (20% to 70%), it emerges that the GAC can have two different behaviours, which mainly depend on the nature of the compound. GAC can exhibit a fairly constant removal efficiency up to its saturation (ketoprofen); on the other hand, it seems that GAC performance may adapt to the variations in the permeate concentration. This was the case for metronidazole for which GAC was able to guarantee a very high removal efficiency leading to an overall removal between 86% and 99%, as shown in Figure 4 (Nguyen et al., 2013b). This issue will be discussed later and compared with recent literature findings. In the case of compounds with very low removal efficiencies in the bioreactor, GAC may greatly contribute to their removal and its presence is essential for assuring a good removal of such recalcitrant compounds. If a decrement occurs, it may be correlated to GAC saturation conditions (fenoprop, carbamazepine and diclofenac). If biological regeneration occurs (see section 4), MPs may still be removed by adsorption. This explains the behaviour of atenolol, metoprolol and propranolol, the antibiotic trimethoprim and the diuretic hydrochlorothiazide, and also diclofenac, which maintain a medium-high removal efficiency for a long working time (Baresel et al., 2019; Sbardella et al., 2018). In the case of GAC saturation, biodegradable compounds absorbed in BAC or adsorbed in GAC, may still undergo biodegradation processes which maintain a good removal efficiency at long operation times (azithromycin, ciprofloxacin, ofloxacin, and sulfamethoxazole) (Sbardella et al., 2018).
Figure 7.
Data from: (Baresel et al., 2019; Nguyen et al., 2013b, 2012; Paredes et al., 2018; Sbardella et al., 2018).
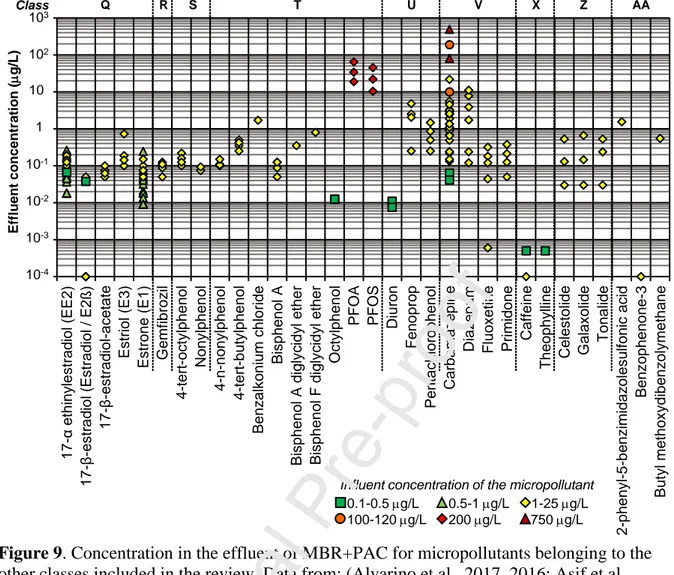
5.3 MP concentrations in MBR+PAC effluent
Figure 8 and Figure 9 refer to MP concentrations in the effluent from an (MBR+PAC) system included in the review. The different symbols used for these effluent quality data depend on the value of the corresponding biological stage influent. Ranges were set for the influent concentrations: 0.01-0.1 g/L, 0.1-0.5 g/L, 0.5-1 g/L, 1-25 g/L, 100-120 g/L and 750
g/L. This discretisation was defined on the basis of the collected literature data and there is no constant interval width for this reason. Data reported in Figures 8 and 9 refer to different types of MBR (in particular they could include UF or MF membrane units, different microbial community species, for instance the presence of nitrifier bacteria as discussed in (Alvarino et al., 2017), different AC dosages in the reactor, different AC ages, different influent characteristics in terms of micro- and macropollutants. They thus provide ranges of effluent concentrations corresponding to different operational conditions in the treatment systems. For this, the analysis of the reported trends requires great caution.
MP concentrations lower than 0.01 g/L correspond to a very good quality of the effluent. They refer to compounds which have a high sorption potential (LogDow > 3, as for E2 ), or are highly degradable (caffeine), or have a low influent concentration (naproxen). Additionally, they refer to high PAC dosages (naproxen, paracetamol, salicylic acid and oxytetracycline, azithromycin, caffeine) (Asif et al., 2020)(Alvarino et al., 2017) or to fresh PAC (erythromycin, roxithromycin, sulfamethoxazole, fluoxetine) (Alvarino et al., 2016)(Alvarino et al., 2017).
The highest effluent concentrations correspond to the highest influent values or ranges of concentrations: this was the case for sulfamethoxazole (Li et al., 2011) (in Figure 8), PFOA and PFAS (Yu et al., 2014) and carbamazepine (Li et al., 2011) (in Figure 9). There is an exception: carbamazepine in Fig. 9 has an effluent concentration similar to the influent one (around 22 g/L). According to the authors (Serrano et al., 2011), this might be ascribed to the saturation of the AC after three months of continuous operations. The release of carbamazepine (see Figure 3) reported in (Li et al., 2011) was related to an accidental low temperature which may have reduced the kinetics of the biological processes and the transfer of the MP from the solid (sludge or AC) to the liquid phase. The effluent concentration increased to 190 mg/L from 100 mg/L in the influent. Paracetamol (Figure 8), an easily degradable compound, was found at a very low concentration also with an influent concentration equal to 118 g/L (Echevarría et al., 2019) and with an AC dosage in the range 0.025–0.050 g/L.
Figure 8. Data from: (Alvarino et al., 2017, 2016; Asif et al., 2020; Echevarría et al., 2019;
Li et al., 2011; Nguyen et al., 2013a; Serrano et al., 2011; Yang et al., 2012)
Figure 9.
Data from: (Alvarino et al., 2017, 2016; Asif et al., 2020; Echevarría et al., 2019; Li et al., 2011; Nguyen et al., 2013a; Remy et al., 2012; Serrano et al., 2011; Yu et al., 2014)
On the other hand, diazepam (Figure 9), a poorly degradable compound, was found in the effluent at 0.1–11 g/L with the corresponding influent in the range 10–25 g/L (Serrano et al., 2011). The highest effluent concentrations are due to PAC saturation (Alvarino et al., 2016).
If a threshold is set equal to 1 g/L for the effluent concentration of an AC treatment, out of the 48 reported micropollutants in Figures 8 and 9, 32 compounds are always below such threshold, and 16 compounds are at least one value above. If the threshold is set at 0.1 mg/L, the compounds with at least one value above it become 39 out of 48. This means that most of the selected MPs may occur in the MBR+PAC permeate in the range 0.1-1 mg/L.
5.4 MP concentrations in the effluent of an AC stage (post treatment)
Figure S4 and Figure S5 refer to the effluent quality if PAC or GAC are used as a PT. Reported data are related to the influent concentrations and to PAC dosage or GAC EBV. Compounds in light pink (64) refer only to PAC, those in light grey (22) only to GAC, and the remaining 29 to both AC types. It emerges that the maximum concentrations in the effluent were found in general for PAC treatment, with the contrast media (class N) being the compounds exhibiting the highest concentrations (10–2,750 mg/L) based on the findings by (Kovalova et al., 2013b). In discussing these data, it is important to remark that they refer to high influent concentrations (Figure 9), and to investigations which exhibited an average (good) removal of around 60% (Figure 6). Limiting the attention to the 29 common compounds (Figure S6), and to the applied conditions (see Figures S4 and S5), it seems that the quality of a PAC unit effluent is better for analgesics/anti-inflammatories, hormones and carbamazepine, whereas in case of a GAC column effluent the quality is better for antibiotics, beta-blockers and diatrizoate. A reduction in the concentrations is more evident for those compounds occurring at higher influent concentrations, underlining that the observed removal efficiencies (Figure 6 and Figure 7) are strictly dependant on the influent concentrations, as also discussed for other treatments, such as the biological stage (Verlicchi et al., 2012).
If a threshold is set at 1 mg/L, out of the 115 compounds analysed, 22 have at least one value exceeding it (20%). They are mainly analgesics, anti-inflammatories and contrast media. A comparison was carried out between the quality in the case of MBR+PAC (Figures 8 and 9) and MBR PAC with regard to the most common investigated compounds: sulfamethoxazole, trimethoprim, carbamazepine and metronidazole. The collected concentrations in MBR+PAC permeate were obtained by an addition of 0.025-1 g/L of PAC in the bioreactor for sulfamethoxazole, trimetroprim and carbamazepine and 0.1 g/L and 0.5
g/L for metronidazole and those referring to the PT unit effluent by an addition of 0.008-2 g/L for all the compounds. It was found that the concentrations of sulfamethoxazole, trimethoprim and carbamazepine are lower when AC acts as a PT, and for metronidazole, the variability ranges of the effluent concentrations are similar in both cases.
Ciprofloxacin shows very good removal in PAC as a PT and in the case of influent concentrations around 15 mg/L.
5.5 Further results
A few studies investigated or estimated the mass load of micropollutants sorbed onto the activated carbon and the activated sludge, with different dosages of PAC in the bioreactor in long-term investigations: PFOS and PFOA in (Yu et al., 2014), and E2 and EE2 in (Yang et al., 2012). (Yang et al., 2012) found that the main contribution due to the presence of PAC is in a greater sorption percentage of the investigated compounds, whereas the impact on biodegradation is quite modest, with the kbiol being quite similar (for E2 it was 8.38 1/d in MBR and 9 1/d in MBR+PAC, for EE2 it was 4.41 1/d in MBR and 4.8 1/d in MBR+PAC). (Alvarino et al., 2016) stated that PAC addition leads to an enhancement in the biotransformation for some MPs mainly for those exhibiting moderate kinetics.
As to Kd, they found that the presence of PAC greatly improves the adsorption of EE2, which is more hydrophobic than E2: its Kd in MBR sludge was 1.431 L/gTSS whereas in MBR+PAC sludge it was equal to 4.123 L/gTSS. As to E2, its Kd was 0.916 L/g TSS in MBR sludge and 1.671 L/gTSS in MBR+PAC sludge. As a consequence, the enhanced sorption capacity in MBR+PAC sludge could increase the amount of EE2 and E2 adsorbed onto sludge.
6 Discussion
The potential of AC in removing MPs from wastewater prompted specific investigations on adsorption batch tests under controlled conditions (e.g. aqueous solutions and synthetic water with a simulated matrix effect) (de Ridder et al., 2010; Dickenson and Drewes, 2010). However, removal mechanisms of MPs in hybrid MBRs are not limited to adsorption processes as described in section 4.
AC and MP structure and properties, wastewater composition, and operational conditions strongly influence the overall removal of MPs in MBR coupled with AC. At the same time, AC presence can influence MP fate during treatment, change sludge properties and also have an effect on membrane fouling. These issues will be discussed in the following sections.
6.1 Factors influencing the removal of MPs by the presence of AC
The main factors influencing MP removal are related to compound properties, AC
characteristics and dosage frequency and mode, wastewater composition (namely DOM and its content of large molecules and low molecular weight organics), and treatment operational conditions. The interactions between MP and AC depend on their properties. The extent at which these interactions may develop is related to the available quantity of AC and MP and the conditions under which these interactions occur.
6.1.1 Micropollutant properties
The main properties affecting MP removal mechanisms include molecule charge, Log Kow or better Log Dow, pKa, molecular size, and specific functional groups within the molecule. Most of these properties are available in Table S1 for the reviewed compounds.
Charge – MP charge is a leading parameter if its removal is due to electrostatic interactions
with AC in a hybrid MBR. An analysis of the removal efficiencies of the selected MPs on the basis of their charge (anionic, neutral, zwitterionic and cationic compounds at the operating pH) and Log Dow is reported in Figure S7 referring to a PAC unit acting as a PT. Similar
trends were found considering removal in GAC column as a PT.
It emerges that cationic compounds (including clarithromycin) seem more prone to be removed by AC treatment due to electrostatic interactions between the positively charged surface of the pollutants and the negative surface of the carbon, confirming the findings by (Kovalova et al., 2013b). Cationic compounds seem to be mostly well removed regardless of their other properties (Mailler et al., 2015; Margot et al., 2013). This fact justifies their small removal variability range compared to anionic or neutral ones. In the case of neutral compounds, removal is influenced by hydrophobicity and molecule structure (mainly functional groups that allow H-bonds and π- π bonds) (de Ridder et al., 2010). A significant positive correlation has been found regarding MP removal and Log Dow (Mailler et al., 2015).
For anionic compounds, electrostatic repulsion is expected between the AC and MP surface. Although it seems to be a relation between hydrophobicity and removal efficiency in the case of PAC as a PT (see Figure S7), no clear evidence of this phenomenon was found in the literature (Mailler et al., 2015; Margot et al., 2013). However, high MP hydrophilicity can result in low adsorption capacity for charged compounds even when electrostatic interactions are expected between AC and MPs (Kovalova et al., 2013a). Moreover, it seems that saturation is more prone to take place for anionic compounds in wastewater (Mailler et al., 2015).
Log DOW – An analysis of the removal as a function of Log Dow has been carried out by
(Alves et al., 2018; Kovalova et al., 2013b; Rattier et al., 2014) for many MPs and they do not show a clear correlation. Referring to neutral compounds, Figure S7 shows that at higher
Log Dow values the removal efficiencies are higher and have a lower variability range.
According to (de Ridder et al., 2010) at log Dow greater than 3.7 hydrophobic interactions
become the dominant removal mechanism.
Molecular weight – (Alves et al., 2018) found that if AC is added to spiked water, there is a
clear correlation between molecular weight and removal efficiency: they stated that the higher the molecular weight, the higher the amount of AC to guarantee the same removal efficiency, confirming that steric hindrance of the large molecules hinders their adsorption rate. This behaviour is more pronounced in the case of hydrophilic compounds, such as iopromide (Log Dow= 0.45).
6.1.2 Characteristics of activated carbon
The main characteristics of AC are reported in section 3.5. Their influence on the removal of selected MPs were investigated by (Alves et al., 2018; Choi et al., 2005; Mailler et al., 2016; Paredes et al., 2018). In particular, (Alves et al., 2018) compared the removal efficiencies for a wide selection of compounds with different types of AC in terms of activation (with steam or chemical), textural properties, chemical properties (related to the functional groups in the outer layer of the grain and in particular to the presence of oxygen surface groups, such as carboxylic, ethers and lactones as reported in Figure 2C), pH-point of zero charge, as well as surface charge at pH=8. They found that in pure water, chemical activated carbons are more prone to attract and bind MPs than steam activated carbons and they guarantee 80% removal at lower doses. (Choi et al., 2005) linked AC characteristics (specific surface area, pore volume and material) to MP adsorption in GAC columns. They found a negative correlation between pore volume and the BET specific surface area; they remarked that the BET specific surface area and pore volume reduce as the operation time increases, their reduction occurs mostly in micro-pores and that MP and DOM adsorbed onto macropores can subsequently cause a micropore blockage. The extent of this reduction depends on the carbon type. According to the investigations by (Fundneider et al., 2021a), a balanced proportion of macro-, meso- and micropores in the GAC improve the MP removal in the presence of DOC, whereas GAC with a high proportion of micropores is more affected by pore blockage due to DOC adsorption leading to a lower MP removal. MP removal is strongly affected by the presence of DOM which may partially cover the AC surface. If an AC is positively charged, it attracts DOM (negatively charged) and thus its surface will have positively and negatively charged zones, thus attracting anionic and cationic MPs respectively (Figure 2). Finally, it was also found that pore volume is more important than specific area and a larger pore volume generally allows a higher removal of MPs (Rossner et al., 2009).