ISSN 1450-2275 Issue 86 May, 2016 © FRDN Incorporated
http://www.europeanjournalofeconomicsfinanceandadministrativesciences.com
The Relationship between PIIGS Banks Balance Sheet
Ratios and CDS Spreads: An Empirical Analysis
Eliana Angelini
Department of Economic Studies “G. d' Annunzio” University, Pescara, Italy
E-mail: [email protected] Tel: + 39-085-4537937
Alessandra Ortolano Department of Economic Studies “G. d' Annunzio” University, Pescara, Italy
E-mail: [email protected] Tel: + 39-085-4537937
Abstract
The paper investigates empirically what kind of relationship between banking sector's CDS spreads and balance sheet variables has been established, in the area most affected by the sovereign debt crisis, during the period itself. To this purpose, we conduct an analysis on a sample of PIIGS banks, compared to a sample of US ones, for the period of the Eurozone crisis, 2009-2013.The study shows the peculiarity of banking sector respect to other productive areas, in terms of relationship between balance sheet ratios and CDS spreads, in order to evaluate credit risk. This research confirms the supposed distortion of market informational efficiency, made by speculation: in particular we retain that speculation on PIIGS banks derived from sovereign debt crisis, while the American banks' one, was influenced mostly by the financial crisis, born just from the banks of this area. The paper also highlights the relevance of sovereign short-term rating, in terms of perception of the riskiness of market: specifically, we show how the banking sector has been deeply influenced by Eurozone crisis. In particular, we note a stronger influence of rating sovereign debt evaluation on PIIGS CDS spreads, respect to balance sheet ratios.
Keywords: CDS spreads, PIIGS, Banking sector, Balance sheet Ratios, Eurozone crisis, Short-term rating
JEL Classification: G1; G120; G21; G240
1. Introduction
As CDS spreads represent the cost to ensure from credit risk, their level is an interesting variable, in order to evaluate the riskiness of a firm.
The recent financial and Eurozone crises, on the other hand, have shown how speculation on the financial and the sovereign sectors, has twisted the informational efficiency of the CDS market. In theory we would expect that the credit riskiness is expressed at the same way, by CDS spreads and the main variables we find in the balance sheets, so we could be able in both cases, to evaluate the risk of default of a firm. Anyway it cannot be hidden that the balance sheet policies influence the
meaningfulness of the items. The Eurozone crisis, that has affected the peripheral European countries, in particular the so-called PIIGS, (i.e. Portugal, Ireland, Italy, Greece and Spain), has been characterized by a deep speculation on the sovereign market, through the relative CDSs; this fact has caused important consequences on the banks of the area, already hit by the repercussions of the American financial crisis. In this context an important role has been acted by the rating agencies, that have deeply downgraded the creditworthiness valuation of the sovereign debt.
The relationship between CDS spreads and balance sheet ratios, in terms of evaluation of credit risk demonstrated by extended literature for industrial sector, has not been observed for the banks, at least until the onset of the financial crisis. Before the explosion of the latter, banking sector was considered safe by the market, probably because of the regulation that deals with this kind of firms. In particular, Leverage ratio, generally considered an important factor of riskiness, wasn't evaluated at the same way in the case of banking sector, although their high levels.
Anyway the uprising of the aforementioned crises, seems to have changed the way the market looks to the banking sector and, at the same time, has induced a speculative process on the sector itself. As banks are the institutions that exchange CDSs, their weakness has established a situation of widespread counterparty risk, that has evolved itself into a form of systemic risk, because of the interconnections of the financial system. In particular, in the Eurozone, we assisted to the phenomenon of the wrong-way risk, because of the dependence of banking sector, on public guarantees.
If on one hand, some recent studies, have demonstrated more attention for banks' balance-sheets, in order to evaluate the credit risk of the institutions, on the other hand contemporary literature, is showing the influence of market factors.
This paper, investigates empirically what kind of relationship between banks' CDS spreads and balance-sheet variables has been established, in the area most affected by the sovereign debt crisis, during the period itself: the aim of this work is to provide an analysis that has been inspired by an extended strand of study, but intends to be focused on the banking sector, with specific regard to PIIGS and the speculation that has hit their public debt. To this purpose, we conduct an OLS analysis on a sample of 50 PIIGS banks, compared with a sample of 30 US ones, for the period of the Eurozone crisis, 2009-2013. We divide balance-sheets' ratios into four classes: Asset, Capital, Liquidity and Operations and for each one, we make a multiple regression, using yearly average CDS spread as dependent variable. Then we verify the influence of Eurozone sovereign debt crisis on the riskiness of banks, in terms of short-term liquidity and quality of assets, using Fitch short-term rating on sovereign debt, as dummy variable.
2. Previous Research
After the renowned theoretical Modigliani and Miller I° Proposition (1958), which stated the irrelevance of the capital structure of a firm to assess its value, the following research, has shown how, in the real world, the ratio between equity and debt is essential, like so the quality of the assets. This issue has acquired particular relevance, in the analysis on credit risk.
Since the seminal work of Merton (1974), the financial literature has produced several works on the analysis of credit risk using balance-sheets, through the so-called approach of the structural models, having anyway regard to macroeconomic factors, like interest rate and liquidity. Essentially, according with Merton, the value of a debt issue of a firm, depends on three variables: a risk-free rate, the terms of the indenture and the probability of default. Simplifying, in his work, Merton shows how the probability of default of a firm and consequently its credit risk, grows with the riskiness of debt, measured by its volatility, which has, obviously, a stochastic nature. Furthermore, the value of the promised payments on debt, acts like a threshold: if, at the bonds' due date, the value of the assets is under that limit, the default will occur. So, as the bondholders will take over the shares of the firm at the time of default, it's like if they can exercise a call option.
More recently the same Merton, with Gray and Bodie (2007), because of the onset of the sovereign debt crisis, has adopted an analogous approach on national balance-sheets: in this case, the
event of default depends on the value of sovereign assets, their volatility and the distress barrier, that is, the present value of the promised payments, on foreign-currency debt. As the CDS spreads depend on the riskiness on the underlying debt, this strand of study has also been used, to explain their determinants.
Ericsson, Jacobs, Oviedo (2004), for instance, confirm the sign of the relationship between CDS premia and the three theoretical variables, i.e. leverage, volatility and interest rates, showing a positive relationship between CDS spreads and the first two variables and a negative sign, between interest rates and the same CDS premia.
Hewavitharana and Rahmqvist (2011), focus their study on the period between January 2008 and December 2010, examining the determinants of CDS spreads through leverage, stock return, volatility and interest rate. The main unexpected results of this study, both in a volatile context, are the positive relationship between interest rate and CDS spreads and the negative one, between the latter and the leverage. The first relationship, could be explained by the fact that in a context of economic distress, as the sample period's one, a firm is unable to meet its short term debts' payments; the second, instead, is unclear.
Bank of Italy's Di Cesare and Guazzarotti (2010), instead, analyze CDS spread changes, for a sample of US non-financial companies, splitting the period of the analysis in the pre-crisis, from January 2002 to June 2007 and the crisis' one, from July 2007 to March 2009. They confirm the explanatory power of firm-specific variables all over the sample period, but they outline its decrease in favour of a systemic factor; at the same time, they show the increase of importance of the leverage ratio, as the market perceives it as a factor of riskiness, especially in time of distress; conversely, equity volatility lessens its impact, since the large swings in implied volatility during the crisis, invalidate its ability to explain long-term asset volatility.
Looking at the banking sector, we find a different situation and, in particular, it's necessary discriminating between the pre-crisis and the crisis period.
Raunig and Scheicher (2009), compare CDS spreads of 41 banks with 162 non-banks' ones, for a period from January 2003 to December 2007. They show that, if before the outbreak of the financial turmoil, banks' CDS spreads are on average lower than the other firms' ones, as they are perceived less risky because of their heavy regulation and public sector support, after the onset of the crisis, the difference between the two sectors shrunk considerably, as both kinds of CDS spreads raise sharply, because of the perception of the riskiness, also for banks.
Annaert et al. (2010) examine CDS spread changes for euro area financial institutions, over the period 2004-2008, identifying three kinds of spread determinants: credit risk factors, trading liquidity and market wide factors. These macro-variables are significant both in the pre-crisis and during the crisis period, but their effect becomes stronger during times of distress, expecially as concerns liquidity and, with regard to credit risk factors, leverage; the effect of business cycle, instead, is less clear, as it could incorporate both credit risk and liquidity factors.
An interesting study based on the balance-sheet indicators, made by Chiaramonte and Casu (2013), focus on a panel data of 89 international banks from 1 January 2005 to 30 June 2011, dividing the period into three segments: the pre-crisis, the crisis and the aftermath. The main results are that, even if banks record very high levels of leverage, CDS spreads aren't high as well, until the outbreak of the crisis: this means that before this event, market hasn't evaluated leverage as a significant factor of riskiness for banks, unlike the other sectors.
Similar findings, related to the low explanatory power of leverage ratio for the banking sector, are shown by Düllmann and Sosinska (2007) and Kalemli-Ozcan et al.(2011).
Other interesting results that emerge from Chiaramonte and Casu's work, are the confirmed negative relationship between ROE and CDS spread over all the sample period and the surprising relationship between the latter and the Tier 1 ratio: instead of a negative relationship as could be expected, there is a positive one, that increases during the crisis: according with the authors, this fact shows that the market considers improper Tier 1 ratio, in order to size up banks' riskiness. Furthermore,
in this study, emerges the significance of the indicator of the quality of the assets portfolio, as predictor of a default.
The last issue, is consistent with an other work focused on large complex financial institutions, made by Calice, Ioannidis and Williams (2011), that states, in a section of the paper, the relevance of the volatility of the assets, respect to the risk of default. It furthermore shows the interconnection between CDS market and banking sector, in a systemic risk perspective.
De Vincentiis (2014), compares the riskiness of global systemically important banks (G-SIB) with the no-SIBs, looking at their respective CDS spreads, trying to find out their determinants. What emerges from the paper, focusing on the crisis period, is the significance of the bank-specific variables related to dimensions, profitability and capital stability and the country risk, measured by sovereign CDS spreads, for both kinds of banks.
Going on with the correlations between banking and country riskiness, an ECB (2009) work about CDS counterparty risk, explains, in this context, the phenomenon of the wrong-way risk, that is the circularity of bank and sovereign risk that works in the following way: States guarantee banks, lessening their risk; at the same time, the same banks, speculate on sovereign risk of their parent company's country, through CDS products; this fact, increases sovereign risk and consequently the banking sector's one, because of banks' dependency, on sovereign financial support.
Bank of Italy's Li and Zinna (2014), observing sovereign and bank CDS term structures, distinguish between the influence of systemic and sovereign risk on the banking one, finding the highest level of systemic risk for Spain and Italy in absolute value; in a relative sense, otherwise, the most important component of risk for the banks of these countries, is their respective sovereign one, since their assets are mostly related to their home countries. As concerns Germany and France, instead, the authors find out the opposite situation, as the assets of their banks, are cross-border.
Analogous conclusions can be found in other works: Caruana and Avdjiev (2012), argue that government rescue to financial sector, in September and October 2008 caused a decline of banks' CDS spreads, with the exceptions of Greece and Italy and a rise of the sovereign ones; but after the fourth quarter of 2009, as emerge fiscal problems, bank and sovereign CDSs become more positive correlated, inducing international active banks, to move their portfolios away, from riskiest euro area countries.
Alter and Schüler (2011), explain the phenomenon of the private-to-public risk transfer in Europe: before government interventions, bank credit spreads disperse to sovereign CDS market, but after the bailouts, because of the changes on the composition of both governments and banks' balance-sheets, there's an increased influence of sovereign CDS spreads on the banking ones; Portugal and Italy are exceptions, as their country risk, seems to affect their respective banking sectors, even before Lehman Brothers event.
Acharya et al .(2011), observing CDS market over the period 2007-2010, underline a two-way feedback between sovereign and financial credit risk in the Eurozone, also showing an association between the increase in the sovereign CDS and a decrease in banks' stock returns, in the post-bailout period.
3. Research Method
We make an OLS analysis, to evaluate the the influence of balance sheet ratios on CDS spreads.
In particular, we divide the ratios into their four main categories (Asset, Capital, Liquidity and Profitability) and we make a multiple regression for each kind of ratio.
Below, we indicate the ratios chosen and their supposed relationship with the CDS spread, highlighting that the latter is as higher as much it's credit risk perception.
Our assumptions (Table 1a), therefore, are made taking into account that for a banking firm, credit risk is lower if there is good creditworthiness of the assets, a strong capital structure, good levels of liquidity and profitability.
1) Loan Loss Provision to Net Interest Revenue (LLP/NIR): the ratio should be as better as
lower, so we suppose a positive relationship with CDS spread;
2) Loan Loss Reserve to Non Performing Loans (LLR/NPL): the ratio should be as better as
higher, so we suppose a negative relationship with CDS spread;
3) Net Charge-Off (NCO) to Average Gross Loans (NCO/AGL): the ratio should be as better
as lower, so we suppose a positive relationship with CDS spread;
4) Impaired Loans to Equity (IL/E):the ratio should be as better as lower, so we suppose a positive relationship with CDS spread.
Capital Ratios used are the following ones:
1) Equity to Net Loans (E/NL): the ratio should be as better as higher, so we suppose a
negative relationship with CDS spread;
2) Equity to Liabilities (Leverage Ratio) ( LEV): the ratio should be as better as higher, so
we suppose a negative relationship with CDS spread;
3) Cap Funds to Net Loans (CF/NL): the ratio should be as better as higher, so we suppose a
negative relationship with CDS spread;
4) Cap Funds to Liabilities (CF/L): the ratio should be as better as higher, so we suppose a negative relationship with CDS spread.
Liquidity Ratios chosen are the following ones:
1) Net Loans to Total Assets (NL/TA): this ratio should be as better as lower, so we suppose
a positive relationship with CDS spread;
2) Net Loans to Total Deposits and Borrowing (NL/TDB): this ratio should be as better as
lower, so we suppose a positive relationship with CDS spread;
3) Liquid Assets to Customer and ST Funding (LA/DSTF): this ratio should be as better as
higher, so we suppose a negative relationship with CDS spread;
4) Liquid Assets to Total Deposits and Borrowing (LA/TDB): the ratio should be as better as higher, so we suppose a negative relationship with CDS spread.
Operations Ratios chosen are the following ones:
1) Net Interest Margin (NIM): this ratio should be as better as higher, so we suppose a
negative relationship with CDS spread;
2) Return On Average Assets (ROAA): this ratio should be as better as higher, so we
suppose a negative relationship with CDS spread;
3) Return On Average Equity (ROAE): this ratio should be as better as higher, so we
suppose a negative relationship with CDS spread;
4) Cost to Income Ratio (C/I): this ratio should be as better as lower, so we suppose a positive relationship with CDS spread.
These are the four models of regression equations:
CDSi,t=β0+β1(LLP/NIR)i,t+β2(LLR/NPL)i,t+β3(NCO/AGL)i,t+β4(IL/E)i,t+εi,t (Model 1) CDSi,t=β0+β1(E/NL)i,t+β2(LEV)i,t+β3(CF/NL)i,t+β4(CF/L)i,t+εi,t (Model 2)
CDSi,t=β0+β1(NL/TA)i,t+β2(NL/TDB)i,t+β3(LA/DSTF)i,t+β4(LA/TDB)i,t+εi,t (Model 3)
CDSi,t=β0+β1(NIM)i,t+β2(ROAA)i,t+β3(ROAE)i,t+β4(C/I)i,t+εi,t (Model 4)
Then we're going to make some regressions to evaluate the influence of short-term sovereign rating,1 on the perception of riskiness of the banks placed in those specific countries. This kind of analysis is made only for PIIGS banks, because we focus our attention on Eurozone crisis. Obviously we assume an ascendant trend for CDS spreads, for negative rating evaluations (Table 1b). We use term rating, because during the aforementioned period, the market was concerned about a short-term default of the sovereign issuers. The rating will act as a dummy variable2, indicated as SR ( i.e.
1
The short -term rating is “Fitch IDR Rating”
2
The dummy variable will work as follows: SR≥ F3 = 1
sovereign rating), and will be used to evaluate how sovereign creditworthiness valuation, influences the riskiness of banks, in terms of short-term liquidity and quality of assets. So we'll take into account these two ratios: Liquid Assets to Customer and ST Funding (LA/DSTF) and Net Charge-Off (NCO) to
Average Gross Loans (NCO/AGL). After regressing the individual relationship between CDS spreads respectively with: the short-term rating, Liquid Assets to Customer and ST Funding and Net
Charge-Off (NCO) to Average Gross Loans, we're going to repeat the last two regressions adding the dummy variable, in order to see if it increases the significance of the results.
The regressions with the dummy variable, are the following ones:
CDSi,t=β0+γ0SRj,t+εi,t (Model 5)
CDSi,t =β0 + β1(LA/DSTF)i,t + γ0SRj,t + εi,t (Model 6)
CDSi,t= β0+ β1(NCO/AGL)i,t+ γ0SRj,t+ εi,t (Model 7)
3.1 Sample
The yearly spreads are calculated making the average of monthly values, obtained by the mean between the highest and the lowest spread recorded each month.3 In particular we focus the analysis on a sample composed by a panel data of 50 banks placed on the so-called PIIGS, observed during the period of the European sovereign debt crisis (2009-2013). Then we compare these results with the ones related to a sample of 30 US banks, for the same period.4
Figure 1: Sample of PIIGS banks
Source: Bankscope
3
With relation to US banks' January 2013 CDS spreads, the average has been calculated using the monthly end values, because of numerous missing values.
4
Figure 2: Sample of US banks
Source: Bankscope
These are the measure of positions of the CDS spreads, for the two samples. PIIGS CDS SPREADS
Min. 1st Qu. Median Mean 3rd Qu. Max.
127.0 227.0 280.5 310.5 375.5 824.0
USA CDS SPREADS
Min. 1st Qu. Median Mean 3rd Qu. Max.
87.0 161.2 185.0 233.1 235.0 1128.0
Figure 3: Average PIIGG and US CDS spreads – Period 2009-2013
Source: Bankscope data elaborations
2008 2010 2012 2014 0 100 200 300 400 PIIGS USA YEAR C D S S P R E A D
The graphics show banks CDS spread trend, for the two samples analyzed, with reference to the period 2009-2013. In order to construct the graphics, we calculated the whole average of CDS spreads for each year, weighting for the number of the banks for each country, in the case of PIIGS.
We note that on average the maximum value of CDS spread is shown by PIIGS banks, but, at the same time, the highest spread used for the analysis, belongs to US banks, as shown by the statistics. The graphics show the two points of maximum: for PIIGS is 2012, while for USA, is 2009. This fact is explained by the influence of respectively Eurozone and financial crisis. Anyway, the two graphics have similar trends: we retain that this issue is due to the systemic nature of the riskiness of markets, during this period.
3.2 Source of Data
Both CDS and ratios data, are provided by the database Bankscope.
We refer the study to banks indicated by the database as U1 or U2, namely firms that aren't holdings.
4. The Results of Hypotheses Testing
The results obtained by Models 1, 2, 3, 4 (Table 2a), are presented as follows.
As concerns the Asset Ratios, we confirm the supposed signs of the coefficients for PIIGS sample, even though the result is significant only for the ratio NCO to Average Gross Loans: this is particularly important because during the period analyzed, banks had many impaired assets, represented by sovereign bonds. Furthermore, the coefficient is quite high, so we think it could be influenced by speculation on sovereign debt market. The signs of the coefficients, are also confirmed for the US sample, except for Loan Loss Provision to Net Interest Revenue; anyway, the only statistic significance deals with the ratio Loan Loss Reserve to Non Performing Loans: the last result, is important because of the influence of the financial crisis, that started in the American market just for the impaired
Subprime Loans.
Talking about the Capital Ratios, the supposed relationship is confirmed only for Cap Funds to
Net Loans and for Cap Funds to Liabilities. The other two results are consistent with literature, that shows the peculiar characteristic of the banking sector: the positive relationship with Equity to Loans
Ratio could be explained by speculation made through CDSs on the banking sector: high levels of Equity could be disregarded. As concerns Leverage Ratio, the positive relationship, shows that market keeps not considering this indicator for banks in terms of credit risk, at least in the European market, probably because of its strict regulation. Nevertheless no result is statistically significant. Looking on the US sample, we have the same results for Equity to Net Loans and Cap Funds to Net Loans we found for PIIGS and for both ratios, the results are significant. Instead we confirm the supposed negative relationship between CDS spread and Leverage Ratio: this result is consistent with the last observations that show a more attention of the market for this indicator, especially for the more leveraged American banking sector. This issue, is in contrast with the positive sign of the Cap Fund to
Liabilities coefficient. In both cases, there isn't a statistic significance.
As concerns Liquidity Ratios in PIIGS sample, we confirm the relationship between them and the CDS spread, except for the ratio Liquid Assets to Total Deposit and Borrowing: this could mean that the market doesn't perceive a sufficient liquidity for banks, in order to give back money to their lenders. On the other hand, the confirmed negative sign of Liquid Assets to Customer and ST Funding, shows that the market believes in the ability of banks to give back money in the short-term, when this indicator is high. We could explain these two apparently contrasting results, thinking about the confidence given to the European market by the liquidity injections made by the ECB, but, on the same time, there is a widespread skepticism versus banking sector, especially in countries particularly affected by the sovereign debt crisis, as Greece. Anyway there isn't a statistic significance in any of the four coefficients. The results on the US sample, confirm the supposed relationships for Net Loans to
Total Assets, the only significant coefficient and for Liquid Assets to Deposits and ST Funding. The outputs dealing with the other two coefficients, seem to be in contrast with the preceding ones in terms of credit risk evaluation: the negative relationship between CDS spread and Net Loans to Total
Deposits and Borrowing, shows a disregard of the market for the liquidity of loans respect to deposits while the positive relationship between the first and Liquid Assets to Total Deposits and Borrowing, shows that market doesn't retain liquid assets able to guarantee for the risk that banks could not give back that kind of liabilities.
Finally looking to the Operation Ratios, the signs of the results are the same for both PIIGS and US samples: the supposed negative sign for ROAA coefficient, is confirmed with statistic significance and means that market, as this ratio indicates the returns of the assets financed by the bank, retains that efficient in terms of evaluation of credit risk; the supposed positive relationship with Cost to Income
Ratio is confirmed as well, even though isn't significant. The regressions haven't confirmed the signs for Net Interest Margin and for ROAE, with statistic significance. These results, could be reasonably explained by the speculation made on banking sector, through CDS products: this fact could make market perception of banks credit risk high, despite situations of good levels of the aforementioned indicators. The relationship found for ROAE, is in contrast with Chiaramonte and Casu (2013) results.
All these findings are confirmed by quite low Adjusted R2 for each class of ratios; anyway there are better results for the ANOVA test, that shows quite low p-value at the Fisher test, especially for the PIIGS sample. In particular, the better significance of Operations ratios, is confirmed by very low p-values (9,551e-05 and 1,94e-05 respectively for PIIGS and US). A quite high p-value, is shown only for US Asset ratios.
As concerns the study of the classical hypotheses of the linear model (Table 3), the analysis of the medium of the residuals is not significant, so we confirm that it's significantly different from zero. With reference to the test of the normality of the errors, the Jarque-Bera test is significant, so the distribution of the errors isn't normal, anyway we could conduct our studies, because of the asymptotic properties. With regard to the analysis of homoscedasticity, we make Koenker test, instead of Breusch-Pagan's one, because the first is a robust version of the second. Specifically, the test is insignificant, so the errors are homoscedastic, as shown by quite high p-values.
Results obtained by the regressions with the dummy variable are quite interesting.
First of all, Table 4 shows that the highest level of correlation between CDS spread and the variables analyzed, is the one related to sovereign debt rating. Furthermore, Table 3b shows that the significance of the dummy variable is quite high for both the regressions. Specifically, we note that the significance of LA/CSTF and NCO/AGL ratios is quite high in both linear regressions: this is particularly important for the short-term liquidity ratio, because in the multiple regression, its low significance, could be influenced by the presence of the other ratios. If we record a lower significance of the two ratios adding the dummy variable, at the same time we note better Adjusted R-squared and more significant ANOVA tests.
Moreover, we retain that the announcement effect by rating agencies, has been more relevant, in order to influence market short-term riskiness perception for banking sector, respect to balance-sheet variables. This is consistent with the recent literature, (i.e. Coro F., Dufour A., Varotto S., (2013)), that shows the importance of rating announcements and macroeconomic factors, in particular liquidity, in order to evaluate the riskiness of the market.
5. Summary and Concluding Remarks
The analysis has shown the peculiarity of banking sector respect to other productive areas, in terms of relationship between balance sheet ratios and CDS spreads, in order to evaluate credit risk. This study has confirmed the supposed distortion of market informational efficiency, made by speculation: in particular we retain that speculation on PIIGS banks derived from sovereign debt crisis, while the
American banks' one, was influenced mostly by the financial crisis, born just from the banks of this area.
Nevertheless, we must highlight that the hypotheses made a priori on the possible relationship between CDS spread level and balance sheet indicators, cannot be considered in an absolute way. We can't neglect the systemic nature of a banking firm and the consequent necessity to analyze its fundamentals, from a global point of view: for instance a high level of ROAE, although if at a first glance could be perceived in terms of good creditworthiness, it could, instead, derive from a very leveraged firm. At same time balance -sheet policies influence the goodness of the information, given by the items.
The paper also highlights the relevance of sovereign short-term rating, in terms of perception of the riskiness of market: in particular we show how the banking sector has been deeply influenced by Eurozone crisis. In particular, we note a stronger influence of rating sovereign debt evaluation on PIIGS CDS spreads, respect to balance-sheet ratios. Anyway, we finally affirm that the speculation made on sovereign debt, has had a heavy importance in order to compromise the informational efficiency of the CDS market: rating agencies' announcements, could have been perceived more worrying than sovereign's and the related banking market's creditworthiness, deserved.
This research could be developed in future studies, in terms of an in-depth analysis of the Liquidity Ratios, and of the impaired Assets, also considering financial market variables, such as liquidity, volatility, in addition to rating agencies evaluations.
Tables 1a and 1b
Summary of Hypotheses
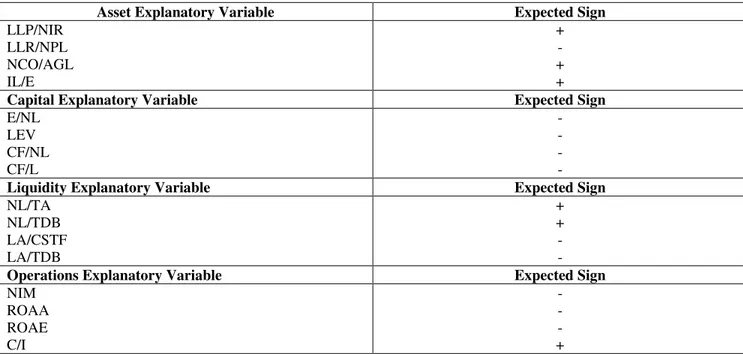
Table 1a: shows a summary of the assumed signs for the relationships between CDS spread and the ratios
As concerns Asset Ratios: LLP/NIR is Loan Loss Provision to Net Interest Revenue; LLR/NPL is
Loan Loss Reserve to Non Performing Loans, NCO/AGL is Net Charge-Off to Average Gross
Loans, IL/E is Impaired Loans to Equity.
As concerns Capital Ratios: E/NL is Equity to Net Loan; LEV is Equity to Liabilities (Leverage
Ratio); CF/NL is Cap Funds to Net Loans; CF/L is Cap Funds to Liabilities.
As concerns Liquid Ratios: NL/TA is Net Loans to Total Assets; NL/TDB is Net Loans to Total
Deposits and Borrowing; LA/CSTF is Liquid Assets to Customer and ST Funding; LA/TDB is
Liquid Assets to Total Deposits and Borrowing.
As concerns Operations Ratios: NIM is Net Interest Margin; ROAA is Return On Average Assets; ROAE is Return On Average Equity; C/I is Cost to Income Ratio.
Asset Explanatory Variable Expected Sign
LLP/NIR +
LLR/NPL -
NCO/AGL +
IL/E +
Capital Explanatory Variable Expected Sign
E/NL -
LEV -
CF/NL -
CF/L -
Liquidity Explanatory Variable Expected Sign
NL/TA +
NL/TDB +
LA/CSTF -
LA/TDB -
Operations Explanatory Variable Expected Sign
NIM -
ROAA -
ROAE -
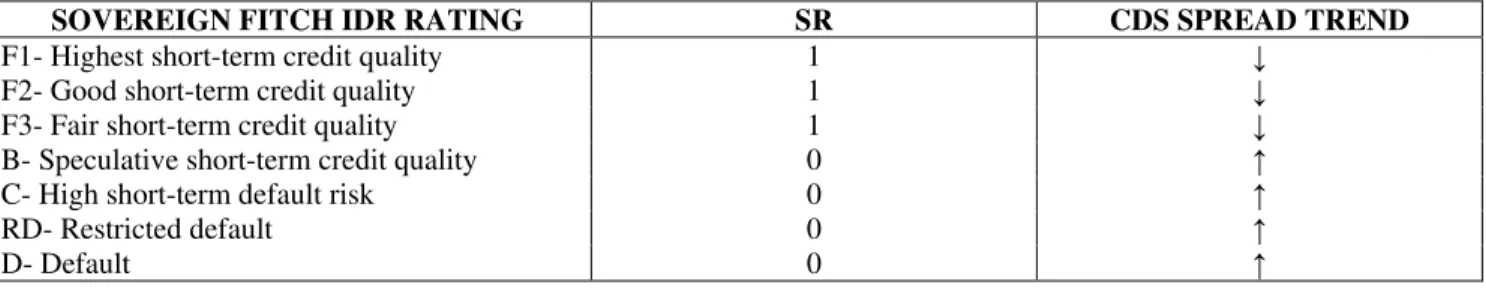
Table 1b: shows a summary of the assumed signs for the relationships between CDS and the dummy variable
SR, represented by Fitch short-term IDR: the value 1 is assigned to the dummy for quite safe sovereign debt, so a descendant trend of the related banks CDS spread is expected; the value 1 is assigned to the dummy for quite risky sovereign debt, so an ascendant trend of the related banks CDS spread is expected
SOVEREIGN FITCH IDR RATING SR CDS SPREAD TREND
F1- Highest short-term credit quality 1 ↓ F2- Good short-term credit quality 1 ↓ F3- Fair short-term credit quality 1 ↓ B- Speculative short-term credit quality 0 ↑ C- High short-term default risk 0 ↑
RD- Restricted default 0 ↑
D- Default 0 ↑
Tables 2a and 2b Models results
Table 2a: shows the results of the Models 1, 2, 3 and 4. The Estimate, represents the value of the intercept and
of coefficients of the regression equations, the standard errors are given in parenthesis. The table also shows t- statistics, the Adjusted R-squared and the Fisher test. The levels of significance are expressed by the p-value: *,** and ***denote significance at 10%,5% and 1%
MODELS RESULTS ASSETS RATIOS-CDS SPREADS
PIIGS USA
Estimate t value Pr(>|t|) Estimate t value Pr(>|t|)
Intercept 288.579 (23.435) 12.314 < 2e-16 *** Intercept 265.969 (25.961) 10.245 <2e-16 *** LLP/NIR 0.007 (0.089) 0.077 0.940 LLP/NIR -0.820 (0.887) -0.925 0.357 LLR/NPL -0.095 (0.224) -0.423 0.673 LLR/NPL -0.445 (0.201) -2.208 0.029 * NCO/AGL 12.540 (4.289) 2.924 0.004 ** NCO/AGL 10.343 (16.266) 0.636 0.526 IL/E 0.147 (0.082) 1.795 0.075. IL/E 0.241 (0.291) 0.827 0.41 Observations: 1000 Adjusted R-squared: 0.059
F-statistic: 3.241 on 4 and 140 DF, p-value: 0.014
Observations: 600
Adjusted R-squared: 0.019
F-statistic: 1.655 on 4 and 130 DF, p-value: 0.1643
CAPITAL RATIOS-CDS SPREADS
PIIGS USA
Estimate t value Pr(>|t|) Estimate t value Pr(>|t|)
Intercept 324.020 (17.427) 18.593 <2e-16 *** Intercept 230.654 (34.266) 6.731 4.87e-10*** E/NL 0.931 (2.451) 0.380 0.704 E/NL 21.924 (8.623) 2.543 0.012 * LEV 8.278 (8.862) 0.934 0.352 LEV -15.721 (17.232) -0.912 0.363 CF/NL -2.431 (1.803) -1.349 0.179 CF/NL -20.352 (7.973) -2.553 0.012 * CF/L -6.712 (7.149) -0.939 0.349 CF/L 13.338 (15.269) 0.874 0.384 Observations: 1000 Adjusted R-squared: 0.062
F-statistic: 3.556 on 4 and 151 DF, p-value: 0.008
Observations: 600
Adjusted R-squared: 0.065
LIQUIDITY RATIOS-CDS SPREADS
PIIGS USA
Estimate t value Pr(>|t|) Estimate t value Pr(>|t|)
Intercept 224.367 (43.196) 5.194 4.65e-07*** Intercept 33.955 (85.289) 0.398 0.691 NL/TA 0.099 (1.327) 0.075 0.941 NL/TA 10.504 (5.236) 2.006 0.000 NL/TDB 1.094 (0.991) 1.094 0.275 NL/TDB -6.899 (4.386) -1.573 0.118 LA/CSTF -0.340 (0.255) -1.335 0.183 LA/CSTF -9.957 (21.667) -0.460 0.647 LA/TDB 0.654 (0.656) 0.996 0.320 LA/TDB 13.927 (22.228) 0.627 0.532 Observations: 1000 Adjusted R-squared: 0.048
F-statistic: 3.857 on 4 and 222 DF, p-value: 0.005
Observations: 600
Adjusted R-squared: 0.032
F-statistic: 2.181 on 4 and 139 DF, p-value: 0.0742
OPERATIONS RATIOS-CDS SPREADS
PIIGS USA
Estimate t value Pr(>|t|) Estimate t value Pr(>|t|)
Intercept 231.878 (22.727) 10.203 < 2e-16*** Intercept 107.227 (49.710) 2.157 0.033* NIM 21.707 (5.759) 3.769 0.0002*** NIM 27.27 (9.847) 2.770 0.006* ROAA -6.277 (3.143) -1.997 0.047* ROAA -63.928 (16.678) -3.833 0.000*** ROAE 0.232 (0.184) 1.261 0.209 ROAE 3.22 (1.516) 2.124 0.035* C/I 0.621 (0.300) 2.071 0.0396* C/I 0.602 (0.374) 1.610 0.110 Observations: 1000 Adjusted R-squared: 0.087
F-statistic: 6.209 on 4 and 215 DF, p-value: 9.551e-05
Observations: 600
Adjusted R-squared: 0.1462
F-statistic: 7.38 on 4 and 145 DF, p-value: 1.94e-05
Table 2b shows the most interesting results of the Models 6 and 7. In particular, we report t statistics and their respective p-values. Also R-squared and Fisher test are shown. The figures in parentheses, are related to the same regressions, without the dummy variable. *,** and ***denote significance at 10%,5% and 1%
DUMMY MODELS RESULTS SHORT-TERM LIQUIDIY + DUMMY
t value Pr(>|t|) LA/CSTF -2.145 (-2.407) 0.0329 * (0.0168 *) SR -8.434 3.1e-15 *** Adjusted R-squared: 0.2397 (0.01935)
F-statistic: 39.3 on 2 and 241 DF, p-value: 1.689e-15 (0.01682)
ASSET QUALITY + DUMMY
t value Pr(>|t|) NCO/AGL 3.221 (3.586) 0.00154 ** (0.000441 ***) SR -7.02 5.55e-11 *** Adjusted R-squared: 0.2766 (0.06631)
Table 3
Residuals analysis
Table 3: shows the p-values' results, for the analysis of the residuals, related to Models 1,2,3 and 4.
PIIGS USA t test (mu=0) Jarque-Bera test Koenker test t test (mu=0) Jarque-Bera test Koenker test
ASSET 1 < 2.2e-16 0.458 ASSET 1 < 2.2e-16 0.405 CAPITAL 1 < 2.2e-16 0.393 CAPITAL 1 < 2.2e-16 0.699 LIQUIDITY 1 < 2.2e-16 0.217 LIQUIDITY 1 < 2.2e-16 0.601 OPERATIONS 1 < 2.2e-16 0.077 OPERATIONS 1 < 2.2e-16 0.33
Table 4
CDS Spread Correlations
Table 4: shows the correlation between CDS spread and the variables, for both samples. Also the correlation between CDS spread and the dummy variable, is shows for PIIGS
PIIGS USA
VARIABLE CORRELATION VARIABLE CORRELATION
LLP/NIR 0.168 LLP/NIR -0.032 LLR/NPL -0.066 LLR/NPL -0.202 NCO/AGL 0.268 NCO/AGL -0.030 IL/E 0.168 IL/E 0.0762 E/NL 0.182 E/NL 0.003 LEV 0.092 LEV 0.0030 CF/NL -0.265 CF/NL 0.0388 CF/L -0.070 CF/L 0.114 NL/TA 0.214 NL/TA 0.054 NL/TDB 0.237 NL/TDB 0.038 LA/CSTF -0.153 LA/CSTF -0.015 LA/TDB -0.169 LA/TDB 0.0583 NIM 0.212 NIM 0.032 ROAA -0.141 ROAA -0.328 ROAE 0.017 ROAE -0.248 C/I 0.197 C/I 0.247 SR -0.485
References
[1] AA.VV. (2009), Credit Default Swaps and counterparty risk, European Central Bank, August [2] Adrian T., Shin H. S. (2010), Liquidity and leverage, in Journal of Financial Intermediation
19, pp. 418–437
[3] Ang A., Longstaff F. A. (2008), Systemic sovereign credit risk: Lessons from the U.S. and
Europe, Working Paper 16982, National Bureau of Economic Research
[4] Angelini E. (2012), Credit Default Swaps (CDS) and their Role in the Credit Risk Market, in
International Journal of Academic Research in Business and Social Sciences, Vol. 2, No. 1, January
[5] Angelini E., Il credit Default Swap nella gestione del rischio di credito. Dinamiche e
determinanti dei CDS spread (2013), G. Giappichelli Editore, Torino
[6] Annaert J., De Ceuster M., Van Roy P., Vespro C. (2010), What determines euro area bank
CDS spreads?, National Bank of Belgium, Working Paper Research, No 190, May
[7] Bonfim D.(2009), Credit risk drivers: Evaluating the contribution of firm level information and
[8] Caruana J., Avdjiev S. (2012), Sovereign creditworthiness and financial stability:an
international perspective, in Financial Stability Review, Banque de France, No. 16, April [9] Chiaramonte L., Casu B.(2013), The determinants of bank CDS spreads: evidence from the
financial crisis, in The European Journal of Finance, Vol.19, No 9, pp. 861-887
[10] Coro F., Dufour A., Varotto S., (2013) Credit and liquidity components of corporate CDS
spreads, in Journal of Banking and Finance, 12/2013
[11] De Vincentiis P. (2014), Lo status di banca sistemica gioca un ruolo significativo? Una
verifica empirica sui Cds delle maggiori banche europee, in Bancaria Special Issue, N° 12/2014
[12] Di Cesare A., Guazzarotti G. (2010), An analysis of the determinants of credit default swap
spread changes before and during the subprime financial turmoil, Banca D''Italia, Working
papers, March
[13] Fender I., McGuire P. (2010), Bank structure, funding risk and the transmission of shocks
countries: concepts and measurement, in BIS Quarterly Review, September
[14] Fulli-Lamaire N. (2013), A tale of two Eurozones: banks' funding, sovereign risk &
unconventional monetary policies, Amundi Asset Management, University of Paris, August [15] Giuliani F. (2012), CDS: Liquidity Shortage or Structural Insolvency?, Working Paper Series,
University of Bologna, March 10
[16] Graf F. (2011), Leverage, Profitability and Risk of Banks-An empirical Analysis, Working
Paper, University of Konstanz, 4, August
[17] Gray D. F., Merton R. C., Bodie Z. (2007), Contingent claim approach to measuring and
managing sovereign credit risk, in Journal of Investment Management 5 4
[18] Hewavitharana D., Rahmqvist J. (2011), Determinants of Credit Default Swap Spreads:a
regime-shifting approach, Departement of Business Administration, Lund University
[19] Hull J., Predescu M., White A.(2004), The relationship between Credit Default Swap spreads,
bond yields, and credit rating announcements, Joseph L. Rotman School of Management, University of Toronto, January
[20] Kalemli-Ozcan S., Soresen B., Yesiltas S. (2011), Leverage across firms, banks and countries,
Working Paper 17354, National Bureau of Economic Research, August
[21] Imbierowicz B., Rauch C.(2014), The relationship between liquidity risk and credit risk in
banks, in Journal of Banking & Finance 40, pp. 242–256
[22] Ismailescu I., Kazemi H. B. (2010), The reaction of emerging market Credit Default Swap
Spreads to Sovereign Credit Rating Changes, October 29 2009, in Journal of Banking and
Finance, Vol. 34, pp. 2861-2873
[23] Lane P. R. (2012), The European Sovereign Debt Crisis, in Journal of Economic Perspectives,
Volume 26, Number, Summer, pp. 49–68
[24] Li J., Zinna G. (2014), How much of bank credit risk is sovereign risk? Evidence from the
Eurozone, Working Papers, Banca d'Italia, Number 990
[25] Merton R.C. (1974), On the Pricing of Corporate Debt: The Risk Structure of Interest Rates, in
Journal of Finance Vol. 29, No 2, pp. 449-470
[26] Mody A., Sandri D. (2011), The Eurozone Crisis: How Banks and Sovereigns Came to be
Joined at the Hip, IMF Working Paper, WP/11/269
[27] Panetta F. et al. (2011), The impact of sovereign credit risk on bank funding conditions, CGFS
Papers, Bank for International Settlements, April
[28] Raunig B., Scheicher M. (2009), Are Banks Different? Evidence from the CDS market, in
Workshop on Challenges in banking research, May
[29] Rea M. A. (2008), L'analisi di bilancio per il controllo della gestione, G. Giappichelli Editore, Torino
[30] Remolona E., Scatigna M., Wu E. (2008), The dynamic pricing of sovereign risk in emerging
[31] Rutigliano M. (a cura di) (2012), L'analisi del bilancio delle banche. Rischi, misure di
performance, adeguatezza patrimoniale, Egea, Milano
[32] Subrahmanyam M. G., Tang D. Y., Wang S. Q. (2012), Does the tail wag the dog? The effect of
credit default swaps on credit risk, HKIMR Working Paper, No.29/2012
[33] Van Rixtel A., Gasperini G. (2013), Financial crises and bank funding: recent experience in