Does The Development Context Affect Bankruptcy
Prediction Models’ General Accuracy? A
Comparative Analysis Of Four Multivariate
Discriminant Models In The Italian Context
Salvatore Madonna, Prof.
Department of Economics and Management, University of Pisa, Italy
Greta Cestari, PhD
Department of Economics and Business Science, University of Cagliari, Italy
Francesca Callegari, Master’s degree
Department of Economics and Management, University of Ferrara, Italy
doi: 10.19044/esj.2016.v12n10p445 URL:http://dx.doi.org/10.19044/esj.2016.v12n10p445
Abstract
This research starts from the work by Madonna and Cestari (2015) that aimed at assessing the usability of three bankruptcy prediction models applied in contexts other than the ones of their elaboration, in order to evaluate their generalizability and the possibility to apply them in wide-scale investigations. We took the cue from that study to assess the usability of four bankruptcy prediction models, when applied to a sample with characteristics other than the ones related to their elaboration. We aimed at verifying the predictive accuracy and the discriminant capacity of the four models, basing on the assumption that the performances displayed by bankruptcy prediction models are usually better when they are applied in contexts similar to the one of their elaboration. Given this premise, we hypothesized that Italian models should perform better than the American one. In order to verify this hypothesis, we tested the four multivariate discriminant models twice: the predictive accuracy was tested applying the models on a sample of firms gone bankrupt within 2012 and 2014; the discriminant capacity on a sample equally composed by bankrupt and operating firms. Both samples were composed by firms located in Italy and operating in recent years. Hence the sample provided and the context of application were different from the ones of the models‘ elaboration.
The results show that even if the Italian models were elaborated basing on contexts more similar to the one of the present application, the best performance is reached by the American Altman’s Z‘-Score model.
Keywords: Bankruptcy prediction models, predictive accuracy, multivariate
discriminant analysis, generalizability
1. Introduction
After the Wall Street crash of 1929, the topic of business failure has been the focus of many studies and researches. Economic operators, both academic and professional, began to feel the need to know the operative status of firms not only at the specific moment when the data were collected, but also in the perspective of future operative conditions. With other words, economic operators wanted to know not only if a firm would eventually fail, but also when it would happen (Sandin & Porporato, 2007). Until then, the analysis of the operative status of firms was limited to the diagnosis of the exact status of the firm at the very moment when the data were collected. When it became clear that diagnosing firms’ status wasn’t enough to avoid business failure, the perspective switched: from crisis diagnosis to crisis prediction. The lack of prospecting information related to the mere diagnosis of the firm’s status implies that its pathologic condition would eventually be discovered when it reaches a point of no return, causing the impossibility to make the necessary decisions and take the necessary actions while there’s still some chance to reverse the firm’s “unhealthy” status. On the contrary, predicting the crisis allows to recognize the future operative status of a firm. It allows to discover the early signs of a forthcoming crisis, and act with timeliness and effectiveness in order to try and fix the problematic elements that are leading to the bankruptcy. Knowing the future status of a firm with some advance is important not only for the operators that work within it, but also for the so-called external operators. An internal operator would benefit of a timely information regarding the future operative conditions of its firm because it would enable a quick and precise response to potential signs of distress. The informational needs of external operators, on the other hand, change depending on the role of the operator itself. There are many kind of external operators: lenders, investors, security analysts, receivable accounts management, creditors, auditors, bond raters, strategy consultants and government agencies. The last kind of stakeholder represents a particular case, because its interests almost coincide with the firm’s ones. Public administrations and governmental agencies need to collect timely information about firms’ operative conditions in order to sustain firms in economic distress with proper economic aids (Poddighe & Cestari, 2006). On the contrary, other external operators need to know the future operative conditions of a firm in order to make decisions for themselves and determine how to behave regarding the relation with the investigated firm. Hence, the assessment is not made in the interest of the investigated firm, but in order to avoid the difficulties deriving from its potential bankruptcy. There isn’t a single definition of business failure (Pretorius, 2009; Shepherd, 2005), but, as mentioned before, it is considered a
dynamic phenomenon (Lorange & Nelson, 1987; Weitzel & Jonsson, 1989; D’Aveni, 1989a; Chowdhury & Lang 1993; Barker & Duhaime, 1997; Müller, 1985; Giannessi, 1960) characterized by a progressive deterioration of firm’s operative conditions (Müller, 1985; Slatter & Lovett, 1999; Guatri, 1995; Sciarelli, 1995; Cestari, 2009). For this reason, even though the prediction of the crisis could generally be useful for many different operators, it is not an easy process. First of all, it is necessary to determine which moment of the deteriorating process should be the object of the prediction. The choice should be made considering the fact that the more the deteriorating process moves forward, the more the gravity of the firm’s condition increases and the effectiveness of the potential remedial actions decreases. So the chosen moment, should be located in the early stages of the crisis. Moreover, it is necessary to implement adequate tools, such as bankruptcy prediction models, which are the result of a series of studies, began in 1930s, designed to test the reliability of fiscal markers (Smith, 1930; FitzPatrick, 1932; Ramser & Foster, 1931; Smith & Winakor, 1935; Wall, 1936). These are tools that generally integrate (1) mathematical, statistical, computing and engineering techniques with (2) measurable and non-measurable indicators, in order to determine firms’ future operative conditions with accuracy and timeliness. Bankruptcy prediction models are traditionally elaborated by initially observing the features of samples composed by operating firms (or firms that ceased to operate in the past) in order to detect the variables and the indexes that better fit to represent the operative conditions of the sample itself. After the elaboration, models are always applied to the original sample, in order to test their reliability, that is the degree of accuracy that the model shows in detecting the operative conditions of the investigated sample. With this test, models generally demonstrate very positive performances: given that they were developed in order to analyze specific samples, it is likely that they would show an high degree of accuracy if applied to firms within those samples. The elaboration process of many bankruptcy prediction models often stops here (Scott, 1981), but another step would be convenient: models should be applied to so-called control samples. Those are samples composed by firms different from the ones included within the original elaboration sample. This second control step, when realized, generally shows lower accuracy performances and allows to assess a more realistic evaluation of the models’ reliability. Bankruptcy prediction models’ developers try to avoid these diminishing results. In fact, they aim at developing models characterized by an almost perfect reliability degree (Bellovary, Giacomino & Akers, 2007). In order to achieve this goal, they tend to utilize samples composed by firms that present a high degree of homogeneity as far as size, sector, type, legal status, area of operation and other features are concerned. This way, they usually obtain bankruptcy prediction models that are very accurate but also over-specialized. It means that these models are only reliable
when they are applied to firms similar to the ones included in the original sample and utilized for the elaboration of the model. When confronted with firms that present characteristics other than the ones of the elaboration sample, those models often display worse results. Even though an over-specialized model can’t be applied to any kind of firm, specialization is not a negative feature per se. The effectiveness of a model depends on the scope of its implementations. For example, a specialized model would result useful for internal analysis or for those organizations that focus on a single kind of firm, even though their analysis are external to the firm itself. In these cases, a specialized model reveals itself efficient and useful, given that the purpose of the analyst is to reach the highest degree of accuracy in the study of a single firm or of a single typology of firms. On the contrary, over-specialized tools wouldn’t fit for investigations developed on a wider scale. If there’s the need to analyze an heterogeneous sample, the analyst should provide a number of different bankruptcy prediction models, each one that fits for a specific kind of firms. The need to provide many different types of models implies an increasing burden both in economic and organizational terms (Madonna & Cestari, 2015). In particular, each single model entails costs related to its development or implementation and to the training of the users, as well as costs related to potential required hardware and software and so on. The more tools are utilized within an organization, the more these costs increase. For this reason, wide-scale investigations would require more generalizable bankruptcy prediction models. Generalizability usually comes with a decreasing in accuracy and reliability, but entails a lower economic burden for those organizations that need to analyze different types of firms. In these cases, bankruptcy prediction models’ users seek a satisfactory degree of accuracy, not an optimal one. Given that the performances of the models are enhanced when they are applied to context similar to the one of their development, it is implicit that their results diminish when the application sample differs from the elaboration one in terms of size, sector, type, legal status, area of operation, etc.. The same consideration can be made if such models are applied in time-frames different to the test case (Grice & Dugan, 2001; Grice & Ingram, 2001; Wu, Gaunt & Gray, 2010).
This investigation follows the studies on generalizability of bankruptcy prediction models. It is set up to verify if applying a model in a context different from its elaboration’s one causes significant losses in the model’s accuracy or if it can be ascribe to a physiologic diminishing in the performances, due to the specific elaboration process of bankruptcy prediction models, that requires the initial observation of a specific sample. Also, we want to verify if models developed within the Italian context show higher degrees of reliability when applied to national firms, than a model developed outside Italy. For this purpose, we chose four bankruptcy prediction models – Altman’s Z’-Score model (1993), Alberici’s model (1975), Luerti’s model (1992) and Bottani, Cipriani and
Serao’s model (2004) – and applied them to a sample of firms operating in Italy. After a brief review of the literature (section 2), section 3 describes the purpose of the paper while section 4 the methodology of the analysis. Results are reported in sections 5 and 6. We conclude in section 7.
2. Literature review
From its first development in 1960s, to the most recent researches in bankruptcy prediction field, a large number of predictive models has been elaborated in order to be applied to very different economic contexts, time-frames, industries and geographical areas. A study by Bellovary, Giacomino and Akers (2007) identified more than 150 existing bankruptcy prediction models, each one elaborated in order to fit for the analysis of firms with specific features, namely the sample provided for their elaboration. The development of bankruptcy prediction models followed different patterns in the international and in the Italian context. In the international context, the first model to be developed was Beaver’s one (1966), based on univariate discriminant analysis. After that, Altman developed his first multivariate discriminant model: the so-called Z-Score model (Altman, 1968). Later, new models have been developed focusing on more innovative methodologies, such as recursive partitioning analysis (Frydman, Altman & Kao, 1985), neural networks (Altman, Marco & Varetto, 1994), genetic algorithms (Kingdom & Feldman, 1995; Varetto, 1998) and fuzzy sets (Tseng & Hu, 2010). In Italy, bankruptcy prediction models’ development was slower and began almost ten years after the rest of the world. First of all, Ruozi (1974) elaborated a model based on univariate discriminant analysis. Then, in 1975, Alberici developed the first multivariate discriminant model specifically realized for the Italian context. It was a pioneering work, that introduced multivariate discriminant analysis in Italy and was followed by other multivariate models: Appetiti’s (1984), Forestieri’s (1986), Luerti’s (1992) and Bottani, Cipriani and Serao’s (2004). Each single model, during its elaboration, demonstrated adequately satisfactory discriminant and predictive capacity. Nevertheless, it has been demonstrated that changings in the context where a model is applied can considerably affect its accuracy. A study by Dugan and Grice (2001) showed that bankruptcy prediction models are sensitive to changings in time periods, industries and financial distress situations. A more recent study (Karas & Režňáková, 2015) demonstrated that also the size of the investigated firms and the methodology followed in the elaboration of the model can affect its accuracy. Given these premises, researchers should choose which model to apply to a particular context knowing which is its use, but also which are its limitations. This way, erroneous application of bankruptcy prediction models can be avoided and more accurate and timely predictions can be made.
3. Purpose of the research
This research aims at verifying the degree of effectiveness of four
bankruptcy prediction models – three Italian models and one American model - in predicting the future operative conditions of a sample composed by heterogeneous Italian firms, with characteristics different from the ones displayed by the original samples provided during the elaboration of each model.
The four chosen models are: Altman’s Z’-Score model (1993), Alberici’s model (1975), Luerti’s model (1992) and Bottani, Cipriani and Serao’s model (2004). While the first model was developed for the American economic context of the years 1970s, the other three models were elaborated for the Italian context. We chose to apply those four specific models for some particular reasons. First of all, multivariate discriminant analysis entails a number of advantages related to its characteristics. In particular, models that are developed using multivariate discriminant analysis are simple and immediate to use. Also, they responds to the efficiency criteria that are essential for wide-scale investigations. Such models entail adequate organizational and economic sustainability: they don’t imply many changes within the organizational structure and they aren’t excessively costly both in terms of direct (elaboration or acquisition; maintenance; support instrumentation; etc.) and indirect (retrieval of information; stabilization of the organizational structure; errors made by the model; etc.) costs (Cestari, Risaliti & Pierotti, 2013). In particular, Altman’s
Z’-Score model demonstrated during time a satisfactory degree of reliability, even
when it was applied to context different from the one of its elaboration. Furthermore, Altman’s model is considered a benchmark for every other study on the topic of bankruptcy prediction. Actually, Altman’s model represented the start for many researchers, that based their models on the former. On the other hand, the three Italian models displayed – each one within its specific elaboration process – a sufficient degree of reliability, that wasn’t verified on control samples. Hence, it is only possible to talk about a declared reliability. Hence, we may know that multivariate discriminant models respond to efficiency criteria, but we still have to verify if they are also effective. The effectiveness of a bankruptcy prediction model is assessed in terms of timeliness and accuracy. A predictive model should provide not only a punctual diagnosis of the present operative status of a firm, but it should also predict its future status. The more a model is able to provide correct information about future conditions of firms, the more it can be considered timely. As for the accuracy, it represents the capacity of a model to recognize and identify the signs of distress and insolvency of a firm, but also the capacity to correctly discriminate between struggling and “healthy” firms. Given these premises, the research questions were:
RQ1: are the four chosen bankruptcy prediction models able to diagnose with timeliness and accuracy a potential distress status of a sample composed
by Italian firms with characteristics different from the ones displayed by their original elaboration samples?
RQ2: are the four chosen bankruptcy prediction models able to accurately discriminate buoyant firms from struggling ones, within a sample composed by Italian firms with characteristics different from the ones displayed by their original elaboration samples?
RQ3: are the three Italian models more reliable than the American one in predicting potential distress status of firms with characteristics different from the ones of their elaboration and in accurately discriminating them within the two groups of buoyant and struggling firms?
In order to answer these questions, we performed a two-phases analysis: (1) the first one focused on assessing models’ predictive accuracy and was performed applying the models to a sample of bankrupt firms located in Italy; (2) the second one on verifying their discriminant capacity, that is the models’ ability to discriminate between struggling and healthy firms in a sample composed by both types. The four bankruptcy prediction models were tested in their original version, that is the form provided by each study, without any adjustment for the specific investigation context. In fact, any adaptation of the models would conflict with our attempt to find a generalizable model. The hypotheses of this research were the following:
H1: Italian models are more effective in predicting bankruptcy of Italian firms, given that they were specifically designed for the Italian market.
H2: Italian models are more effective in distinguishing between failing and flourishing samples within the Italian context, given that they were specifically designed for the Italian market.
4. Methodology and phases of the research
This research was performed basing on an ex-post reasoning approach (Altman, 1988; Rossi, 1988; Teodori, 1989). We utilized a sample composed by firms of known status (already failed or operative at the moment of the collection of the data) in order to verify if the four chosen models were able to predict the bankruptcy of the failed firms and to recognize the real status of both kind of firms. First we studied seminal national and international contributions about the topic of bankruptcy prediction, then we applied the four predictive tools to annual financial statements of firms operating in Italy.
Practically speaking, this was a six-step research. During step one, we selected two samples (bankrupt and active firms) from the Bureau Van Dijk AIDA database, which contains a comprehensive list of Italian firms and their particulars. The sample of bankrupt firms to be used in the first phase was selected according to some specific criteria. The firms are: (1) joint-stock company (S.pA.), limited partnership (S.a.p.a.), or limited liability company (S.r.l.); (2) operating in the Emilia-Romagna region; (3) failed between 2012
and 2014. The firms that were selected this way were then screened in order to exclude “anomalous” ones, that is firms which ceased to exist for reasons other than bankruptcy (mergers, splits, transformations, etc.). Then we verified that the financial statements for the five years prior to the bankruptcy were available in a significant number1 and that there weren’t irregularities in them. At the end, we obtained a sample of 300 firms. The sample of “healthy” firms were randomly selected during phase two. They were listed on the AIDA database as active in the Emilia-Romagna region in 2014. In order to verify that they actually were in good financial health, assets and main financial and economic indexes were assessed a priori. We chose a sample of 150 healthy firms and compare it with the same amount of bankrupt firms, randomly selected within the first sample. Then we collected financial statements for the investigated firms (step two). For bankrupt firms, the financial statements investigated were the ones of the five years prior to the bankruptcy, while for the operating firms, the financial statements collected were the ones of the most recent 5-year period of operation. After step three, when the financial statements were reclassified, the indexes considered in each econometric model were calculated for each firm in each sample (step four). In step five the four investigated models were applied to this figures and the scores were calculated, in order to proceed with step six, when the scores were compared with the respective cut-off points or grey areas threshold values. Models that provide a cut-off point enable the classification of firms within two groups: solvent and insolvent; models that provide grey-area threshold values enable the classification of firms within three groups: solvent, insolvent and uncertain. The predictive capacity of each model was verified by comparing the results of the application with the real-world status of the firms belonging to the sample: the classification was correct if it matched the real-world status of the firm, otherwise it was incorrect.
5. Results of the first analysis: models’ predictive capacity
The first phase of the analysis aimed at verifying the reliability of the four investigated models in detecting signs of insolvency. The models were tested in the following order: Altman’s Z’-Score model; Alberici’s model; Luerti’s model and Bottani, Cipriani and Serao’s model.
5.1 Altman’s Z’-Score model
The efficacy of Altman’s Z’-Score model was tested twice. First the scores obtained by the application of the discriminant function were
1
The financial statements for the five years prior to the bankruptcy were not available for every failed firms. We considered it enough to collect at least three to five financial statements, in order to make a significant analysis.
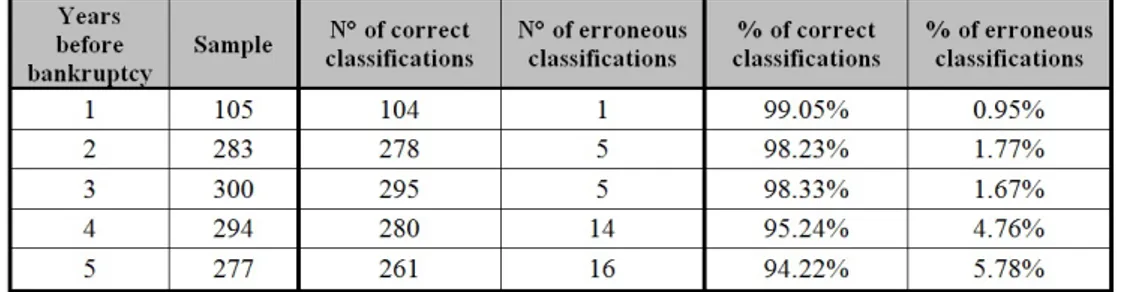
compared with the cut-off point; then the same scores were compared with the grey area threshold parameters. The first phase (comparing the scores with the cut-off point) enabled the firms to be allocated to one of two groups: insolvent (correct classification) and solvent (incorrect classification). The results are exposed in table 1.
Table 1 – Reliability of Altman’s Z’-Score model: cut-off point2
Altman’s model applied in its basic form reveals an excellent reliability. The model correctly classifies always more than 94.00% of the sample, over the 5-year period, reaching 99.05% in the first year preceding the bankruptcy and 98.23% in the second year. In the fourth and fifth years preceding bankruptcy the model maintains a significant predictive capacity, despite a slight dip in prediction accuracy. This phenomenon should be considered normal, as the symptoms of insolvency are less evident the further back in time the model is applied, and therefore the outcome is more difficult to predict via econometric testing. As the percentage of correct classification, the percentage of erroneous classification increases proportionally.
The second phase of the application of Altman’s model used the grey area threshold parameters in order to discriminate the sample of firms within three groups: solvent, insolvent, uncertain. The results (table 2) are different than the ones obtained with the application of the cut-off point: both correct and erroneous classifications decrease, while the percentage of the uncertain classifications reflects these variations. In particular, in the first year prior to the bankruptcy the rate of correct classification is only 91.43%: less than the worst performance of Altman’s model applied with the cut-off point. From second year on, the rate of correct classifications steadily decreases. In the fifth year preceding bankruptcy, the percentage of correct classifications is 51.26%. A value so close to the statistical significance limit (50.00%) shows that the application of the model is not useful. Considering the percentage total error does enable the diagnostic reliability of Altman’s model to be judged in a positive light. Indeed, the introduction of a grey area was provided by Altman
2
Changings in investigated observations depends on the fact that financial statements were not available for all of the five years preceding the bankruptcy for each investigated firm. The reasons why five financial statements weren’t available for some firms are various: firms operating less than five years, missed filing of accounts, etc..
in order to reduce the rate of error. So it is normal that the erroneous classifications are equal or less than the ones realized by the application of the cut-off version of the model. Any reliability assessment cannot be made disregarding the “uncertain” class of firms. Already in the second year prior to bankruptcy, this percentage reaches 22.26%. This cannot be considered a positive sign, because the firms classified in the uncertain area request further investigations which imply costs for the users in terms of time and resources.
Table 2 – Reliability of Altman’s Z’-Score model: grey area
5.2 Alberici’s model
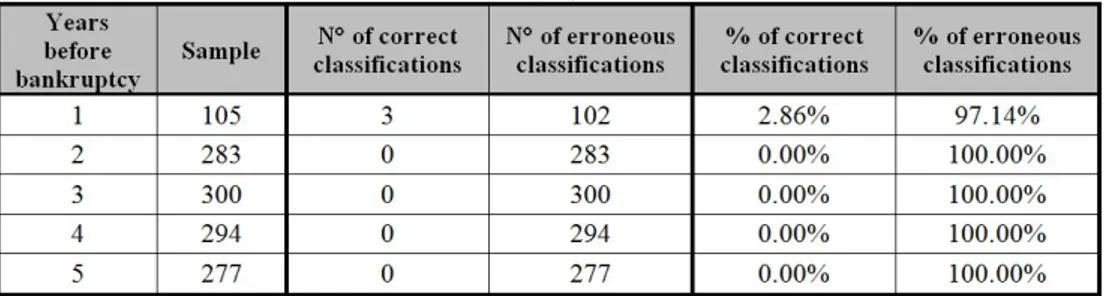
The model designed by Alberici provides a cut-off point and enables the discrimination of firms into two groups: insolvent and solvent. Table 3 summarizes the results of its application.
Table 3 – Reliability of Alberici’s model
Alberici’s model doesn’t display any predictive capacity, nor reliability. The discriminant function is unable to detect the signs of distress of the sample: it only reaches a percentage of correct classifications equal to 2.86% in the first year prior to the bankruptcy, while in the following years the whole sample is classified in the wrong group. These results show that the model possesses no discriminatory properties and is unable to predict bankruptcy in firms of characteristics different than the ones’ of its original development. Because of this, it cannot be considered a predictive model, rather than a simple combination of indexes describing a specific sample of firms within an equally specific time-frame.
5.3 Luerti’s model
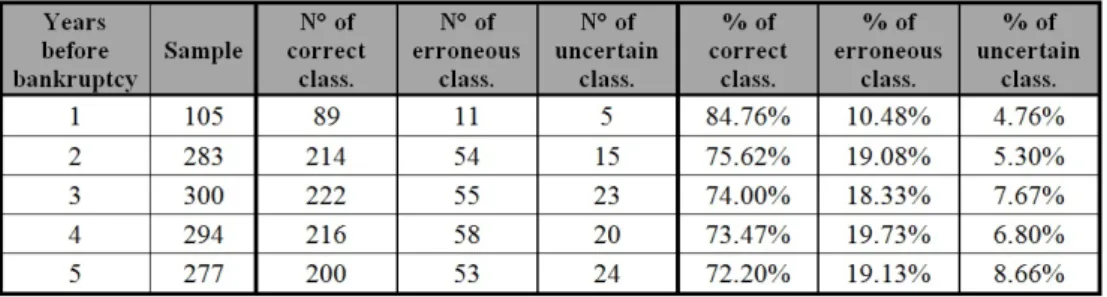
Luerti’s model provides two threshold values that discriminate firms within three groups: certainly insolvent firms, insolvent firms which require further investigations and solvent firms. Table 4 summarizes the results of its application.
Table 4 – Reliability of Luerti’s model
The model shows high satisfactory levels of correct classifications in each one of the five years considered. The percentage of bankrupt firms actually classified within the insolvent group always maintains a satisfactory level of statistical significance. As far as erroneous classifications are concerned, while they don’t reach excessively high percentages in absolute terms, they seem to be a little too high, given that the model provides a grey area. In fact, the decreasing of correct classifications is mostly explained by the increasing of erroneous classification and not by the increasing of uncertain classifications. Both of them (erroneous and uncertain classifications) imply costs for the user of the model, but since erroneous classifications are costlier than uncertain ones, it is not possible to evaluate the model in a completely positive way.
5.4 Bottani, Cipriani and Serao’s model
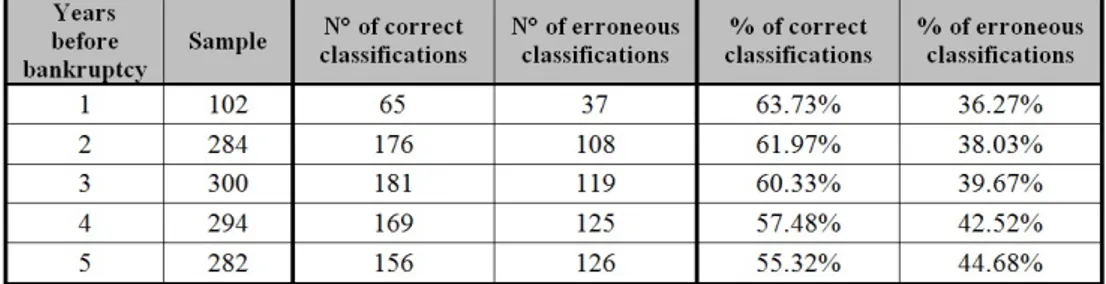
Bottani, Cipriani and Serao’s predictive model enables the discrimination of firms in three groups: solvent, insolvent and uncertain. The model, as shown in table 5, is a satisfactory mean to predict bankruptcy from the data pertaining to the year immediately before the critical event. Indeed, it correctly classifies 82.86% of firms.
Table 5 – Reliability of Bottani, Cipriani and Serao’s model
As usual, the further back in time from the event, the less reliable the test: a significant loss of accuracy was detected in the second period examined,
and this rate constantly decreases. Despite the presence of the grey area, the rate of erroneous classifications is undeniably relevant. So the introduction of the grey area does not appear particularly effective. Also in this case the model cannot be judge in a positive way, because of the low rate of correct classifications, combined with the relevant rate of missed classifications.
6. Results of the second analysis: model’s discriminatory capacity
After having assessed the predictive capacity of the four investigated models, the following analysis aimed at verifying their discriminatory capacity. In this case, it is necessary to assess total accuracy (the predictive capacity across the entire sample), specific accuracy (the predictive capacity within the operational and bankrupt groups) and the type of error made. The models were tested in the following order: Altman’s Z’-Score model; Luerti’s model and Bottani, Cipriani and Serao’s model. As Alberici’s model didn’t show any predictive capacity, we decided to exclude it from the second phase of the analysis. The investigated sample was composed by 150 bankrupt firms (randomly selected from the sample utilized in the first phase of the research) and 150 operative firms.
6.1 Altman’s Z’-Score model
Altman’s model was first tested in the cut-off point version and then in the grey area version. Table 6 shows the total accuracy relating to the application of the cut-off point to the scores: the percentages of correct classifications are statistically significant for the whole five-year period considered.
Table 6 – Altman’s Z’-Score model’s total accuracy: cut-off point3
As far as the specific accuracy is concerned, tables 7 and 8 show that the model is better at classifying bankrupt firms, while it proves a little less discriminant capacity when it comes to healthy firms. The classification of healthy firms isn’t statistically significant during the most recent five-years operative period of healthy firms. On the other hand, the discriminant capacity related to the classification of bankrupt firms always maintains very high
3
Changings in the sample are due to the lack of some financial statements for the bankruptc firms over the five years analyzed. As I wanted to analyze the same number of bankrupt and operative firms, I randomly selected a number of “healthy” observations equal to bankrupt firms’ one.
percentage of success. Values never decrease over 90%, with a maximum of 98.04% of correct classifications in the first year before the bankruptcy. It shows a very significant discriminant capacity when it comes to bankrupt firms.
Table 7 – Altman’s Z’-Score model’s specific accuracy: cut-off point (bankrupt firms)
Table 8 – Altman’s Z’-Score model’s specific accuracy: cut-off point (healty firms)
The analysis cannot proceed disregarding the determination of the type of errors encountered. Two types of error were identified: type I error (false negative) and type II error (false positive). The former occurs when a firm in trouble is discriminated as solvent; the latter when a buoyant firm is classed as bankrupt. In this particular case, type II errors are many more than type I errors. What matters, though, is not the number of errors, rather the financial burden they entail (Lace & Koleda, 2008). In fact, the real-world impact of the two errors differs: type I errors are more costly than type II ones (Altman, 1984). Given that type I errors are remarkably fewer than type II errors, Altman’s model with a single cut-off point can be judge in a positive way.
After the application of the cut-off point, the same model was tested with the grey area threshold values. In this case, as for the total accuracy (table 9), the percentage of the uncertain firms reaches significant values already in the third year before bankruptcy. This value constantly increases from the third year to the fifth year, showing an increasing loss of predictive capacity.
Table 9 – Altman’s Z’-Score model’s total accuracy: grey area
Altman’s Z’-Score with the grey area doesn’t prove a significant discriminant capacity, because even when correct classifications rates are statistically significant, they are combined with high rate of erroneous or uncertain classification. Even in this case, the analysis of the specific accuracy reveals a greater discriminating capacity if the model is applied to bankrupt firms (table 10), rather than to healthy firms (table 11), whose correct classifications are significantly lower than the statistically significance threshold. Given that the correct classifications depicted in table 9 are substantially higher than the correct classifications observed in the analysis of the specific accuracy related to healthy firms, it becomes clear that the former results are mostly due to the higher percentage of correct classifications obtained in the application of Altman’s model to bankrupt firms.
Table 10 – Altman’s Z’-Score model’s specific accuracy: grey area (bankrupt firms)
Table 11 – Altman’s Z’-Score model’s specific accuracy: grey area (healty firms)
Again it is necessary to analyze the type of error encountered: type II errors are more than type I errors, so the model tends to make the less costly type of error. However, the grey area approach presents a substantial number of
uncertain classifications, which also represent a further burden, both financial and in terms of time. Indeed, Altman’s model with the grey area threshold reveals itself to be inefficacious and, therefore, unfit for purpose in this research.
6.3 Luerti’s model
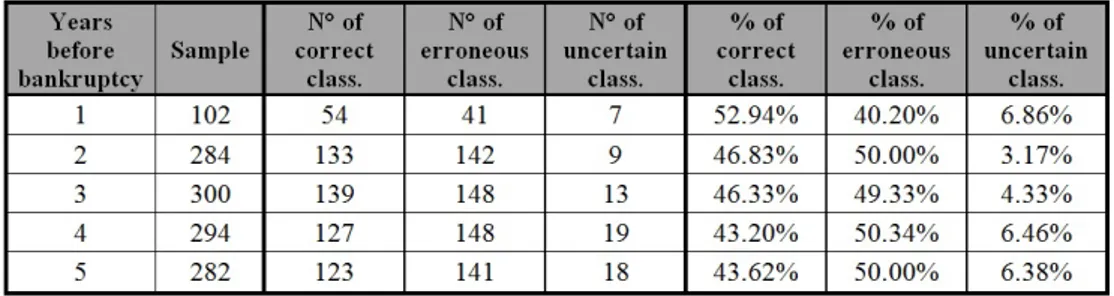
Third test examined Luerti’s model discriminatory capacity. As for total accuracy (table 12), this model doesn’t show high degrees of precision: only in the first year previous the investigated instant the percentage of correct classification is above the limit of statistical significance, while in the following considered years it decreases under a percentage equal to 50.00%.
Table 12 – Luerti’s model’s total accuracy
At the same time, the percentage of erroneous classifications always lies around the same 50.00% value. The small variations and part of the missed classifications fall into the “uncertain” group. The latter reaches very small percentages and doesn’t attain its purpose: to reduce the rate of erroneous classifications. It implies that a large part of evaluations made basing on the application of Luerti’s model cannot be considered reliable. Focusing on specific accuracy, the model displays a higher discriminatory capacity when applied to bankrupt firms (table 13) rather than to healthy firms (table 14).
Table 13 – Luerti’s model’s specific accuracy (bankrupt firms)
The specific accuracy related to the discrimination of the former group of firms reaches high percentages in every year of the investigated period. The uncertain classifications reach very low percentages, too. When the model is applied to healthy firms, it shows significantly different results. Correct classifications are 17.65% of the sample in the first year prior the investigated event and fluctuate in the following years: 11.97% in the second year, 12.00%
in the third year, 8.84% in the fourth year and 10.64% in the last investigated year. At the same time, the rate of missed classifications is extremely relevant in every considered year. Fluctuations also affect the erroneous and uncertain classifications’ groups, with the latter that still doesn’t attain the purpose of reducing the rate of erroneous classifications. The fact that the largest part of error that Luerti’s model makes are type II errors enables a slight review of the negative evaluation of this model’s performance. Type I error – which are the most costly for the user – are limited to very little percentages, so the model can be judge in a more positive way.
Table 14 – Luerti’s model’s specific accuracy (healthy firms)
6.3 Bottani, Cipriani and Serao’s model
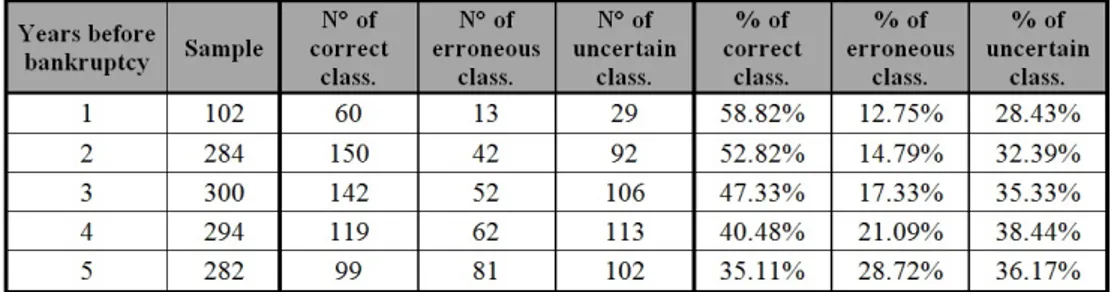
Last model to be tested was Bottani, Cipriani and Serao’s. As far as total accuracy is concerned (table 15), the percentages of correct classifications are extremely close to the edge of statistical significance in the first and the second years prior to bankruptcy, while they go beyond it in the following years.
Table 15 – Bottani, Cipriani and Serao’s model’s total accuracy
It means that the model doesn’t show high statistical levels of predictive capacity when both bankruptcy and healthy firms are considered. In addition, erroneous and uncertain classifications reach preponderant values already in the second considered year. While uncertain classifications increase until the fourth year and then decrease for a small percentage, erroneous classifications constantly increase during the considered five-year period. As erroneous classifications are more costly than uncertain ones, the more than proportional increasing in the former implicates a worsening of the judgement related to the model’s utility.
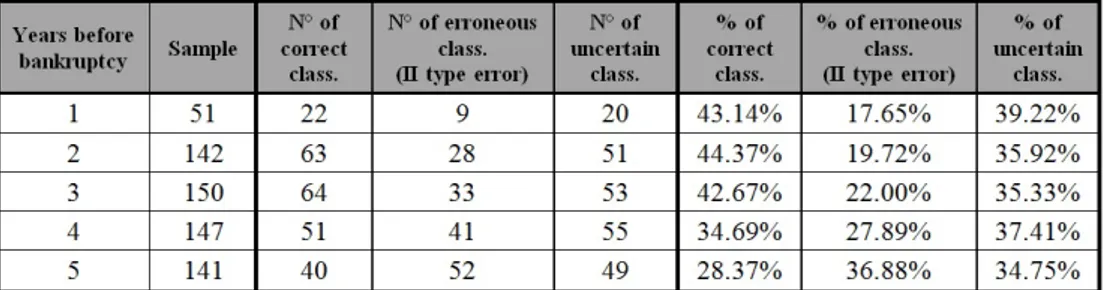
As far as the specific classification is concerned, the discriminant capacity of the model appears to be slightly higher for bankrupt firms (table 16) rather than for healthy firms (table 17).
Table 16 – Bottani, Cipriani and Serao’s model’s specific accuracy (bankrupt firms)
Table 17 – Bottani, Cipriani and Serao’s model’s specific accuracy (healthy firms)
In particular, correct classifications of healthy firms are always lower than correct classifications of bankrupt firms. The weight of the grey area varies through the investigated years: in the first and second years before bankruptcy, the uncertain rate is higher for the healthy firms; in the third year the percentage of uncertain classifications reaches the same value both for bankrupt and healthy firms, while in the fourth and fifth years the percentage is slightly higher for bankrupt firms. Nevertheless, this doesn’t represent a positive sign for the classification of healthy firms, because the decreasing of uncertain classification is not combined with the increasing of correct ones, but with the increasing of erroneous classifications. The analysis of the type of error encountered enables a slight improvement of the judgement given to the model. The most frequent errors are type II, correlated with the lower cost for the user.
7. Conclusion
With this research, we tried and determine the degree of effectiveness of four bankruptcy prediction models – namely Altman’s Z’-Score, Alberici’s, Luerti’s and Bottani, Cipriani and Serao’s – in predicting the future operative status of a sample composed by heterogeneous Italian firms.
Given that the four models provide two different classifications of the firms, first of all it became necessary to decide how to compare and rank them. Namely, while Altman’s model in the cut-off version and Alberici’s model provide a
dichotomic distinction between “solvent” and “insolvent” firms, Altman’s
Z’-Score model with the grey area, Luerti’s model and Bottani, Cipriani and Serao’s
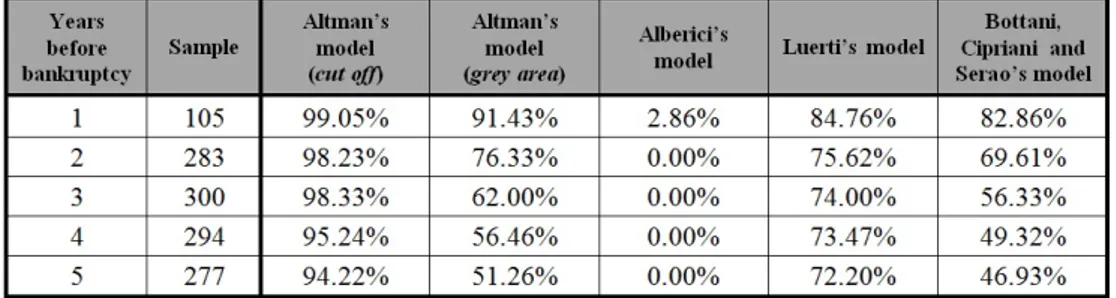
model add the “uncertain” classification to the possible outcomes. But if we only consider correct classifications, then a comparison between the results can be made. As shown in table 18, the model that reaches the highest performance in predicting the early stages of firms’ bankruptcy is Altman’s Z’-Score model applied in the version that provides the cut-off point. The American model shows its superiority also if applied in the grey area version: actually it displays worse results than the other version of the same model, while with respect to the other three Italian models it reaches a higher degree of predictive accuracy. As far as the Italian models are concerned, the performance of Luerti’s model shows itself better than the performance of Bottani, Cipriani and Serao’s model, except in the first year prior to the bankruptcy. As for Alberici’s model, it shows a complete lack of predicting capacity, revealing itself to be a mere descriptive function. Alberici’s model isn’t generalizable, hence it doesn’t fit the purpose of this research. Given these results, the first hypothesis (H1) of this research – namely that Italian models would have been more suitable for predicting the fate of Italian firms – must be rejected.
Table 18 – Comparison of predictive reliability of the models
The second phase of the research aimed at verifying the discriminatory capacity of the models. Hence, we analyze both total accuracy – that is the capacity of the model to correctly classify the whole sample – and specific accuracy – that is the capacity of the model to correctly discriminate the status of each type of firms: bankrupt and operative ones –. In fact, high degrees of total accuracy don’t imply that the model is equally efficient in discriminating “healthy” and “unhealthy” firms. Given that the percentage of total accuracy is only the average value resulting from the specific accuracy related to the two other kinds of firms, acceptable degrees of total accuracy might hide high percentages of correct classifications as far as a type of firms is concerned, and lower – sometimes even statistically irrelevant – percentages of correct classification for the other type. Given these premises, it is necessary to analyze the rate of type I errors (bankrupt firms discriminated as they were buoyant) and type II errors (“healthy” firms classified as bankrupt). As for the total accuracy (table 19), Altman’s model applied with the cut-off point is still the most
performant. The other three models, instead, display similar performances. In particular, Bottani, Cipriani and Serao’s model obtains the best performance in every investigated year, except the fifth one, when the most performant model is Luerti’s. The latter and Altman’s model applied with the grey-area threshold values switch their ranking during the investigated years: while the latter reaches the highest performance in the first year prior to the bankruptcy and the correct classifications in the second year reach the same value for both models, in the last three considered years the model that displays the best performance among the two is Luerti’s model.
Table 19 – Models’ comparison: percentages of correct classifications
As aforementioned, in analyzing a predictive model, it is not possible to ignore the type of errors encountered. From this new point of view, previous judgement must be partially revised. As far as type I errors are concerned (table 20), Altman’s model applied with the grey area reaches the best performance, followed by the same model in the cut-off version and by Bottani, Cipriani and Serao’s model. Finally, the predictive model by Luerti displays the worst performance. As for type II errors (table 21), the worst performance is displayed by Luerti’s model; the second worst model is Altman’s Z’-Score in the cut-off point version, followed by the other version of Altman’s model and by Bottani, Cipriani and Serao’s model, which present similar performances. These results imply the rejection of the second hypothesis (H2) too. In fact, Italian models didn’t prove themselves better at discriminating Italian firms.
To conclude, this research shows that bankruptcy prediction models developed within the Italian economic context aren’t more reliable than the American model in detecting the early signs of company distress of Italian firms and in discriminating them within the two groups of buoyant and struggling firms. The assumption that models applied to context similar to the one of their application should show better performances has to be rejected. In fact, the best performance is reached by the American Altman’s model (in both its version), while the other three Italian models show – with different performance gaps – less discriminatory and predictive capacity.
Table 20 – Models’ comparison: percentages of I type errors
Table 21 – Models’ comparison: percentages of II type errors
Acknowledgments
While this work has been a joint effort of the authors, the individual contributions can be identified as follows: paragraphs 1 and 4: Salvatore Madonna; paragraphs 2 and 6 Greta Cestari; paragraphs 3, 5 and 7: Francesca Callegari.
References:
Alberici, A. (1975). Analisi dei bilanci e previsione delle insolvenze. Milan: Isedi
Altman, E.I., (1968). Financial ratios. Discriminant analysis and the prediction of corporate bankruptcy. Journal of finance, 23(4).
Altman, E.I. (1984). A further empirical investigation of the bankruptcy cost question. Journal of Finance, 39(4), 1067-1089.
Altman, E.I. (1988). The prediction of corporate bankruptcy. A discriminant analysis, New York: Garland Publishing Inc..
Altman, E.I., Haldeman, R.G., & Narayanan, P. (1977). Zeta Analysis. A new model to identify bankruptcy risk of corporations. Journal of Banking and Finance, 1, 29-54.
Altman, E.I., & Hotchkiss, E. (2010). Corporate financial distress and bankruptcy: predict and avoid bankruptcy, analyze and invest in distressed debt. New York: John Wiley & Sons.
Altman, E.I., & La Fleur, J.K. (1985). I modelli di previsione delle insolvenze: le loro applicazioni alla gestione d’impresa. Finanza, marketing e produzione, 4, 77-93.
Altman, E.I., Marco, G., & Varetto, F. (1994). Corporate distress diagnosis: Comparison using linear discriminant analysis and neural networks (the Italian experience). Journal of Banking and Finance, n. 18.
Altman, E.I., & Narayanan, P. (2001). An international survey of business failure classification models. Financial Markets, Institutions & Instruments, 6(2), 1-57.
Altman, E.I., & Sametz, A.W. (1977). Financial crises: institutions and markets in a fragile environment. New York: John Whiley and Sons.
Altman, E.I., Avery, R.B., Eisenbeis, R.A., & Sinkey, J.F. Jr. (1981). Applications of classification techniques in business, banking and finance. Greenwich: Jai Press Inc..
Appetiti, S. (1984). L’utilizzo dell’analisi discriminante per la previsione delle insolvenze: ipotesi e tesi per un’analisi dinamica. Temi di Discussione, Rome: Servizio Studi della Banca d’Italia.
Barker, V.L. III, & Duhaime, I.M. (1997). Strategic change in the turnaround process: theory and empirical evidence. Strategic Management Journal, 18(1),13-38.
Beaver, H.W. (1966). Financial ratios as predictors of failure. Journal of Accounting Research, 4, 71-102.
Bellovary, J.L., Giacomino, D.E., & Akers, M.D. (2007). A review of bankruptcy prediction studies: 1930 to present. Journal of financial education, 33 (Winter), 262-298.
Bottani, P., Cipriani, L., & Serao, F. (2004). Il modello di analisi Z-Score applicato alle PMI. Amministrazione & finanza. 19(1), 50-53.
Bozzolan, S. (1992). Un modello dinamico per l’analisi e la previsione delle insolvenze aziendali. Analisi finanziaria, 7, 71-99.
Brédart, X. (2014). Bankruptcy prediction model: the case of the United States. International Journal of Economics and Finance.
Cascioli, E., & Provasoli, A. (1986). La previsione delle insolvenze aziendali, un metodo quantitativo. In M. Cattaneo, F. Cesarini, A. Provasoli, B. Quatraro (Ed), Crisi di Impresa e Amministrazione Controllata, Milan: Giuffrè.
Cestari, G. (2009). La diagnosi precoce della crisi aziendale. Analisi del processo patologico e modelli predittivi. Milan: Giuffrè.
Cestari, G., Risaliti, G., & Pierotti, M. (2013). Bankruptcy prediction models: preliminary thoughts on the determination of parameters for the evaluation of effectiveness and efficiency. European Scientific Journal, 9(16), 265-290.
Charalambous, C., Charitou, A., & Kaourou, F. (2000). Comparative analysis of artificial neural network models: application in bankruptcy prediction. Annals of Operations Research, 99(1-4), 403–425.
Charitou, A., Neophytou, E., & Charalambous C. (2004). Predicting corporate failure: empirical evidence for the UK. European Accounting Review, 13(3), 465-497.
Chowdhury, S.D., & Lang, J.R. (1993). Crisis, decline and turnaround: a test of competing hypotheses for shortterm performance improvement in small firms. Journal of Small Business Management, 31(4), 8-17.
D’Aveni, R.A. (1989a). The aftermath of organisational decline: a longitudinal study of the strategic and managerial characteristics of declining firms. Academy of Management Journal, 32(3), 577-608.
D’Aveni, R. (1989b). Dependability and organizational bankruptcy. Management Science, September, 35(9), 1120-1138.
Dugan, M.T., & Grice, J.S. (2001). The Limitations of Bankruptcy Prediction Models: Some Cautios for the Researchers. Review of Quantitative Finance and Accounting, 17, 151-166.
Edmister, R. O. (1972). An empirical test of financial ratios analysis for small business failure prediction. Journal of Finance and Quantitative Analysis, 7(2), 1477-1493.
Eisenbeis, R.A. (1977). Pitfalls in the application of discriminant analysis in Business, Finance and Economics. Journal of Finance, 32(3), 875-900.
Ferraris Franceschi, R. (1978). L’indagine metodologica in economia aziendale. Milan: Giuffrè
FitzPatrick, P.J. (1932). Symptoms of industrial failures as revealed by an analysis of the financial statements of failed companies, 1920-1929. Washington DC: The Catholic University of America.
Forestieri, G. (1986). La previsione delle insolvenze aziendali. Profili teorici e analisi empiriche. Milan: Giuffrè.
Frydman, H., Altman, E.I., & Kao, D. (1985). Introducing Recursive Partitioning for Financial Classification: The Case of Financial Distress. The Journal of Finance, 40(1), 269-291.
Giannessi, E. (1960). Le aziende di produzione originaria. Pisa: Colombo Cursi.
Gilbert, L., Menon, K., & Schwartz, K. (1990). Predicting bankruptcy for firm in financial distress. Journal of Business Finance and Accounting, 17(1), 161-171.
Grice, J.S., & Dugan, M.T. (2001). The limitations of bankruptcy prediction models: some caution for the researcher. Review of Quantitative Finance and Accounting, 17 (2), 151-166.
Grice, J.S., & Ingram, R.W. (2001). Tests of the generalizability of Altman’s bankruptcy prediction model. Journal of Business Research, 54(1), 53–61. Guatri, L. (1995). Turnaround. Declino, crisi e ritorno al valore. Milan: Egea. Jones, F.L. (1987). Current techniques in bankruptcy prediction. Journal of Accounting Literature, 6, 131-146.
Karas, M. & Režňáková, M. (2015). Predicting bankruptcy under alternative conditions: the effect of a change in industry and time period on the accuracy of the model. Procedia, Social and Behavioral Science, 213, 397-403.
Kingdon, J., & Feldman, K. (1995). Genetic Algorithms and applications to finance. Applied Mathematical Finance, 2(2), 89-116.
Lace, N., & Koleda, N. (2008). Selecting the right tool for evaluating of solvency: the case of latvian enterprises. 5th International Scientific Conference Business and Management, Vilnius, Lithuania, 16-17 May 2008. Lorange, P., & Nelson, R.T. (1987). How to reorganize – and avoid – organizational decline. Sloan Management Review, 28(3), 41-46.
Luerti, A. (1992), La previsione dello stato di insolvenza delle imprese. Il modello AL/93 di Credit Scoring elaborato in base alla IV Direttiva CEE, Milan: Etaslibri.
Madonna, S., & Cestari, G. (2012). Affidabilità ed efficienza dei modelli di previsione delle insolvenze nel contesto economico ferrarese. Riflessioni nella prospettiva dell’intervento pubblico a supporto della crisi aziendale. Rome: RIREA.
Madonna, S., & Cestari, G. (2015). The accuracy of bankruptcy prediction models: a comparative analysis of multivariate discriminant models in the Italian context. European Scientific Journal, December 2015, vol. 1 106-133. Mantoan, M., & Mantovan, P. (1987). Un modello di previsione del dissesto d’impresa. Rivista dei dottori commercialisti, n. 1-2, 135-159.
Martin, D. (1977). Early warning of bank failure: a logit regression approach. Journal of Banking and Finance, 1(3), 249–276.
Müller, R. (1985). Corporate Crisis Management. Long Range Planning, 18(5), 28-48.
Ohlson, J.A. (1980). Financial Ratios and the Probabilistic Prediction of Bankruptcy, in “Journal of Accounting Research”, n. 1, Spring, 109–131 Peel, M., Peel, D., & Pope, P. (1985). Some evidence on corporate failure and the behaviour of non-financial ratios. The Investment Analyst, 75, 3-7. Pencarelli, T. (2013), Le crisi d’impresa. Diagnosi, previsione e procedure di risanamento. Milan: Franco Angeli.
Platt, H.D., & Platt, M.B. (1991). A linear programming approach to bond portfolio selection. Economic Financial Computing, Spring, 71-84.
Poddighe, F., & Cestari, G. (2006). L’intervento pubblico a supporto della crisi aziendale. Affidabilità ed efficienza dei modelli di previsione delle insolvenze. Quaderni del Dipartimento di Economia, Istituzioni, Territorio, Università di Ferrara, n. 9.
Poddighe, F., & Madonna, S. (2006). Modelli di previsione delle crisi aziendali: possibilità e limiti. Milan: Giuffrè.
Pompe, P., & Feelders, A. (1997). Using machine learning, neural networks, and statistics to predict corporate bankruptcy. Microcomputers in Civil Engineering, 12, 267-276.
Pretorius, M. (2009). Defining business decline, failure and turnaround: a content analysis. South African Journal of Entrepreneurship and Small Business Management, 2(10), 1-16.
Probst, G., & Raisch, S. (2005). Organizational crisis: the logic of failure. Academy of Management Executive, 19(1), 90-105.
Ramser, J.R., & Foster, L.O. (1931). A Demonstration of Ratio Analysis. Bureau of Business Research, Bulletin nr. 40. Urbana: University of Illinois. Rossi, C. (1988). Indicatori di bilancio, modelli di classificazione e previsione delle insolvenze aziendali. Milan: Giuffré.
Ruozi, R. (1974). Sull’attendibilità dei bilanci e sulla loro validità ai fini di previsione delle insolvenze. Bancaria, 1, 7-15.
Sandin, A.R., & Porporato, M. (2007). Corporate bankruptcy prediction models applied to emerging economies: Evidence from Argentina in the years 1991-1998. International Journal of Commerce and Management, 17(4), 295-311.
Schmuck, M. (2013). Financial distress and corporate turnaround: an empirical analysis of the automotive supplier industry. Wiesbaden: Springer Fachmedien Wiesbaden.
Sciarelli, S. (1995). La crisi d’impresa. Il percorso economico della crisi aziendale. Padua: Cedam.
Scott, J. (1981). The probablity of bankruptcy. A Comparison of Empirical Predictions and Theoretical Models. Journal of Banking and Finance, 5 (3), 317-344.
Shepherd, D.A. (2005). The theoretical basis for my plenary speech about our successes and failures at research on business failure. Invited paper. Proceedings: Regional Frontiers of Entrepreneurial Research, Brisbane, 123-134.
Shin, K., & Lee, Y. (2002). A genetic algorithm application in bankruptcy prediction modelling. Expert Systems with Applications, 23(3), 321–328. Slatter, S., & Lovett, D. (1999). Corporate recovery: managing companies in distress. Washington D.C.: Beard Books.
Smith, F.R. (1930). A Test Analysis of Unsuccessful Industry Companies. Bureau of Business Research, Bulletin nr. 31. Urbana: University of Illinois. Smith, F.R., & Winakor, A.H. (1935).Changes in Financial Structure of Unsuccessful Corporations. Bureau of Business Research. Bulletin nr. 51. Urbana: University of Illinois.
Taffler, R. (1982). Forecasting company failure in the UK using discriminant analysis and financial ratio data. Journal of the Royal Statistical Society, 145(3), 342-358.
Tennyson, M., Ingram, R., & Dugan, M. (1990). Assessing the information content of narrative disclosures in explaining bankruptcy. Journal of Business Finance & Accounting, 17(3), 390-410.
Teodori, C. (1989). Modelli di previsione nell’analisi economico-aziendale. Turin: Giappichelli.
Tseng, F.M., & Hu, Y.C. (2010). Comparing four bankruptcy prediction models: Logit, quadratic interval logit, neural and fuzzy neural networks. Expert Systems with Applications, Esevier.
Varetto, F. (1998). Genetic Algorithms Applications in the Analysis of Insolvency Risk. Journal of Banking and Finance, 22(10-11), 1421–1439. Varetto, F., & Marco, G. (1994). Diagnosi delle insolvenze e reti neurali, Rome: Bancaria
Wall, A. (1936). How to evaluate financial statements. New York: Harper. Weitzel, W.F., & Jonsson, E. (1989). Decline in organizations: a literature integration and extension. Administrative Science Quarterly, 34(1), 91-109. West, R.C. (1985). A factor-analytic approach to bank condition. Journal of Banking and Finance, 9(2), 253–266.
Wu, Y., Gaunt, C., & Gray, S. (2010). A comparison of alternative bankruptcy prediction models. Journal of Contemporary Accounting & Economics, 6(1), 34-45.
Zmijewski, M.E. (1984). Methodological issues related to the estimation of financial distress prediction models. Journal of Accounting Research, 22, 59-82.