Classe di Scienze
PhD Thesis
The aging synapse: an integrated
proteomic and transcriptomic analysis.
Candidate:
Cinzia Caterino
Supervisor:
Prof. Alessandro Cellerino
Graphical abstract
DEPs DEGs
Abstract
An important hallmark of aging is the loss of proteostasis, which can lead to the formation of protein aggregates and mitochondrial dysfunction in neurons. Although it is well known that protein synthesis is finely regulated in the brain, especially at synapses, where mRNAs are locally translated in activity-dependent manner, little is known as to the changes in the synaptic proteome and transcriptome during aging. Therefore, this work aims to elucidate the relationship between transcriptome and proteome at soma and synaptic level during aging.
Cerebral cortices were isolated from 3 weeks-old mice, 5 months-old and 18 months-old mice and synaptosomal fraction was extracted by ultracentrifugation on discontinuous sucrose gradient. The fraction was then analyzed by Data Independent Analysis (DIA) Mass Spectrometry and the resulting data were analyzed using Spectronaut software. RNA was also extracted and analyzed by ribo-zero RNA-seq. Data were analyzed and combined with R software.
Proteomic and transcriptomic data analysis revealed that, in young animals, proteins and transcripts are correlated and synaptic regulation is driven by changes in the soma. During aging, there is a decoupling between transcripts and proteins and between somatic and synaptic compartments. For example, there is an increase of ribosomal proteins at synapses that is not mirrored by a concomitant increase at somatic level. Furthermore, soma-synapse gradient of ribosomal genes changes upon aging, i.e. ribosomal transcripts are less abundant and ribosomal proteins are more abundant in synaptic compartment of old mice with respect to younglings.
Mass spectrometry analysis of synaptic protein aggregates revealed that they are particularly rich in ribosomal proteins and also of some components of lysosomes and proteasome, suggesting that loss of proteostasis and inefficient degradation leads to aggregation of ribosomes in synaptic compartment. Strikingly, Desmoplakin, a structural constituent of desmosomes, was also highly abundant in synaptic aggregates. This study suggests that aging affects both the local translational machinery and the trafficking of transcripts and proteins.
Introduction
1. Synapses and synaptogenesis
Contact between neurons is established through structures called synapses. In general, there are two main types of synapses: electrical and chemical. Electrical synapses (neuronal gap junctions) function by the propagation of electrical impulses from one cell to another (and vice versa) via direct, physical contact. As a consequence, these synapses are characterized by a relatively simple organization of membrane structure and associated organelles and by a relatively lower plasticity(Zoidl & Dermietzel, 2002).
Chemical synapses convert electrical signals into chemical signals, which are then transmitted to the receiving neuronal partner and further converted again into electrical signals (Poggio & Koch, 1987). Therefore, chemical synapses use a broad range of neurotransmitters and neuropeptides for intercellular communication, in addition to a localized signal transduction machinery (Oswald Steward & Schuman, 2003). Cell–to-cell communication that occurs by chemical transmission is characterized by complex protein-driven molecular mechanisms of synthesis, delivery, storage, docking, fusion, neurotransmitter release and reuptake (Purves, 2004). In general, synapses are composed of three main constituents: a presynaptic component (presynaptic ending, axon terminal), a synaptic cleft, and a postsynaptic component (dendritic spines in excitatory neurons and dendrite shafts, cell bodies or axon initial segments in inhibitory neurons). The pre- and the postsynaptic membranes are uniquely distinguishable by visible densities along their corresponding plasma membranes. Together with the synaptic cleft, they are collectively referred to as the synapse (Fig.1). These elements are always wrapped by astrocytic processes that have important roles in key aspects of brain development and function, such as neuronal metabolism, synaptogenesis, homeostasis of the extracellular milieu, or cerebral microcirculation (Kettenmann & Ransom, 2013). Furthermore, it has recently been reported that astrocytes are able to discriminate the type of synapse they are in contact with, and influence synaptic transmission by means of Ca2+ currents. Therefore, we refer to this structure as to the “tripartite” synapse (Perea, Navarrete, & Araque, 2009). Typically, the presynaptic ending is characterized by the conspicuous presence of neurotransmitter-filled vesicles.
Figure 1. The image shows an isolated synapse from a brain sample before mass spectrometry analyses. The
pre-synapse typically shows many vesicles containing neurotransmitters kept attached to the post-synapse (Z. Taoufiq, 2013).
Synapses in the brain are generally divided in two categories, depending from the densification of their presynaptic and postsynaptic elements (Gray, 1959). According to this characterization, type 1 synapses have an asymmetrical densification of the pre- and postsynaptic elements, are usually associated to small, round, clear synaptic vesicles and are mainly implicated in excitatory actions. On the other hand, type 2 synapses have a symmetrical densification of the two terminals, are associated with small, clear, flattened or pleiomorphic vesicles, and are mostly involved in inhibitory actions (Fig.2).
Figure 2. Classification of the chemical synapses in the brain. Type 1 synapses are mostly excitatory and show
an asymmetry of the density of the terminals. Type 2 synapses are symmetrical and mostly inhibitory. Picture adapted from Shepherd, 2004.
In response to presynaptic membrane depolarization, neurotransmitters are released into the cleft following a rapid influx of Ca2+ ions in the presynaptic terminal. In particular, Ca2+ binds to
synaptotagmin which can then interact with the preassembled SNARE complex on the neurotransmitter vescicles. This interaction displaces complexin from the SNARE complex, bends the phospholipids, and opens the fusion pore (Tang et al., 2006). Neurotransmitter molecules bind their receptors on the postsynaptic membrane, leading to opening of ion channels that can result is either depolarization (excitation) or hyperpolarization (inhibition) of the postsynaptic terminal. The presynaptic terminal (bouton) also contains other organelles such as mitochondria, smooth endoplasmic reticulum, microtubules, and neurofilaments. The presynaptic membrane is variably populated by docking/fusion apparatus, ion channels, and other protein constituents. A 20–30 nM wide synaptic cleft separates the pre- and postsynaptic membranes and generally contains a dense plaque of intercellular material that includes microfilaments (Bai & Witzmann, 2007).
The postsynaptic membrane in excitatory synapses (type 1 synapses), is recognizable by a collection of dense material visible by electron microscopy on its cytoplasmic surface, the post-synaptic density (PSD) (Gray, 1959; Palay, 1956). This area is a specialization of the postsynaptic submembrane cytoskeleton, it is composed of granular/filamentous material, contains cisternae of smooth endoplasmic reticulum, and its existence seems to be dependent on the presence of the presynaptic ending. A subcellular fraction enriched in structures with PSD-like morphology has been shown to contain signal-transduction molecules thought to regulate receptor localization and function in the CNS (Kennedy, 2000). In particular, PSD of excitatory synapses is enriched in cytoskeletal proteins (actin, tubulin, fodrin and neurofilament proteins), signaling molecules, such as calcium-calmodulin-dependent protein kinase II (CaMKII), membrane receptors, such as NMDA and AMPA receptors, and the quaternary complex of Homer, Shank, GKAP and PSD-95, which are able to link the NMDA receptor complex and group I metabotropic glutamate receptors (mGluRs) (Okabe, 2007). Synaptic proteins are distributed as indicated in Fig.3.
Figure 3.Distribution of synaptic proteins in an excitatory synapse. Picture adapted from Chiu & Cline (2010)
In mammals, synaptogenesis starts in the embryo and proceeds after birth, with rapid and specific changes of synapse numbers, synapse morphology and protein expression that can proceed throughout life (Meredith, 2015; Rice & Barone, 2000). In particular, synapse numbers in rodents rapidly increase in the first three weeks after birth (Rice & Barone, 2000), and the typical synaptic structure with normal sized synaptic vesicles and postsynaptic thickening can be observed at the end of the first postnatal week (Li, 2010). Synaptogenesis consists of biochemical and morphological changes in both the pre- and postsynaptic elements. Physiochemical compatibility of these elements and correct timing with competitive exclusion of inappropriate connections are essential for the formation of a specific network of connections (Jacobson & Jacobson, 1991). These developmental changes allow neurons to establish connections with appropriate partners, to prune the initial wiring of extensive synaptic connections into a more refined and restricted number of relatively stable synaptic contacts, and to tune the functional properties of synapses to prepare them for adult function and plasticity (Margeta & Shen, 2010). During synaptogenesis, target recognition cues, such as cadherins and integrins, guide the migrating neurons to specific layers of the cerebral cortex (Graus-Porta et al., 2001). To establish contact with its synaptic partner, the growing dendritic process follows then a variety of diffusible chemotropic factors (that can be attractive or repulsive) in its extracellular milieu (McAllister, 2002). On the other end, the postsynaptic neuron is not a passive receptor of the connection, but actively participates to the target recognition through its filopodia (Nimchinsky, Sabatini, & Svoboda, 2002). Upon synapse formation, NMDA receptor is recruited to
the nascent excitatory synapse (Barrow, 2009). Subsequent AMPA receptor recruitment makes the synapse functional and allows rapid synaptic transmission (Hall & Ghosh, 2008). It is generally accepted that in addition to these examples the synaptic proteome undergoes extensive developmental changes that underlie the progression of synaptogenesis and synapse maturation (Moczulska et al., 2014). On the other hand, dysregulated synaptic protein expression and disruption of timely interactions of proteins during development have been linked to impaired synaptic function in several disorders, such as autism, schizophrenia and several forms of mental retardation (Grant, 2012). Recently it has been shown that, receptors involved in the chemotropic response to recognition cues are tightly coupled to ribosomes and their activation triggers local translation in retinal ganglion cells. In particular, this coupling is achieved through RNA binding proteins (RBPs) which link mRNAs and ribosomes to these receptors. The RBPs that act as linkers are specific for each receptor (Koppers et al., 2019).
2. Synaptic plasticity and activity-dependent translation
It is important to recognize that the nervous system continues to remodel and change not just early in development but throughout the entire period of development (and even during adulthood) in response to environmental influences as well as genetically programmed events. This phenomenon is termed synaptic plasticity. As already mentioned in §1, the influx of Ca2+ triggered by presynaptic membrane depolarization, leads to the exocytosis of neurotransmitter-loaded synaptic vesicles. Since the number of vesicles docked to the presynaptic terminal is variable, there is a certain probability P that a given vesicle is released into the synaptic cleft (Korn & Faber, 1991). If P is high, the synapse will therefore exhibit depression, because the first action potential will exhaust the pool of available vesicles and the subsequent action potentials will evoke smaller effects. On the contrary, when P is small, the synapse may exhibit facilitation, because the first action potential will only cause a small number of vesicles to be released and, if the inter-stimulus interval is small enough, spikes in a train will trigger larger effects due to accumulation of synaptic Ca2+(Thomson, 2000). Multiple forms of synaptic plasticity, such as Long-Term Potentiation (LTP) and Long-Term Depression (LTD) were observed in neocortex in vivo (Tsumoto & Suda, 1979). Interestingly, identical stimuli can trigger LTP or LTD and both mechanisms have been reported to be dependent on NMDA receptors activation in several brain areas (Hunt & Castillo, 2012): in the dentate gyrus, for example, the direction of NMDAR plasticity (e.g., LTP or LTD) appears to depend on the free Ca2+ concentration triggered by the induction protocol (Harney, Rowan, & Anwyl, 2006). It has been reported that LTP and LTD mechanisms are dependent on dendritic protein synthesis (Huber, Gallagher, Warren, & Bear, 2002). In particular, LTP can be divided in two phases: early LTP, which is traditionally elicited by a single weak tetanic stimulation, lasts less than 3 h and is unaffected by protein synthesis inhibitors (Frey, Krug, Brödemann, Reymann, & Matthies, 1989); by contrast, late LTP, typically induced by multiple tetanic stimuli, is both longer-lasting and dependent on new synthesis of new proteins in the dendrites (Huang, Nguyen, Abel, & Kandel, 1996). In fact, when isolated CA1 dendrites were treated with protein synthesis inhibitor anisomycin after a train of tetanic stimuli, a decline in LTP was observed (Cracco, Serrano, Moskowitz, Bergold, & Sacktor, 2005).
3. Synaptic ribosomes and ribosome profiling experiments
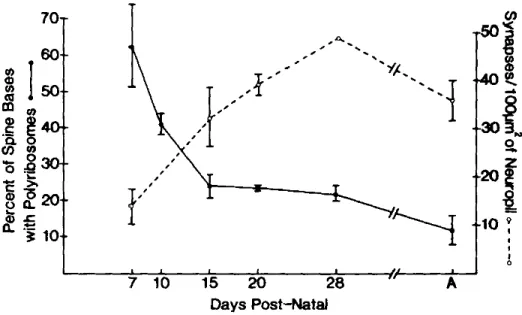
As already mentioned in §2, in order to achieve activity-dependent translation, ribosomes must be present at synaptic level. Ultrastructural studies demonstrated that ribosomes already populate immature dendritic spines in the hippocampus of very young animals (7 days-old rats), accumulating as polysomes within the stubby protrusion of the spine, in a ubiquitous fashion. The maturation of the synapses, between days 10 and 28, leads to a change in the shape of the spines and to a localization of polysomes at the base of the spine neck. Quantitatively, it was observed that the number of polysomes in each spine decreases between development and adulthood, as well as the number of spines itself, as shown in Fig.4 (O. Steward & Falk, 1985).
Figure 4. Relation between age (indicated as Days post-natal), number of spines in dentate gyrus and percent
of polyribosomes located at the base of the spine in rats. Figure taken from O. Steward & Falk, 1985.
It was also hypothesized that synaptic polyribosomes could be involved in local translation (Koenig & Adams, 1982). Strikingly, it has recently been shown that monosomes are involved in synaptic translation in hippocampal neuropil and that the localization of mRNAs in synapses or somata and the association with monosomes is regulated by different 3’UTRs (Biever et al., 2019). Evidence that local protein synthesis is required for long-lasting synaptic plasticity was first provided by Kang and Schuman. They demonstrated that BDNF could induce LTP that was blocked by protein synthesis inhibitors even when pre- and postsynaptic pyramidal neurons were severed from their somas (Kang & Schuman, 1996). Afterwards, it was shown that other forms of synaptic plasticity require dendritic translation, such as mGluR-LTD (Huber, Kayser, & Bear, 2000). Furthermore, Cracco et al. showed that disruption of the rapamycin-sensitive signaling pathway interferes with the persistence of LTP in
isolated dendrites (Cracco et al., 2005). This is also supported by the observation that components of the translational machinery, such as ribosomes and tRNAs, as well as translation initiation and elongation factors (Sutton & Schuman, 2006), the RNA-induced silencing complex (RISC) and microRNAs (miRNAs; Schratt, 2009) are all present at the synapse. These findings suggest a local regulation of translation in an activity-dependent way that would allow each individual synapse of a given neuron to remodel its respective synaptic proteome through alterations in protein abundance and/or protein activity independently from neuronal soma (Hanus & Schuman, 2013). It has been shown that a group of developmental and adult brain disorders, including fragile X syndrome (FXS) and autism (Belmonte et al., 2004) are linked to abnormal changes in synaptic connectivity and plasticity due to defects in protein translation in dendrites. On these bases, a recent work by Schuman and coworkers was able to demonstrate that local translation is a characteristic of both pre- and postsynaptic elements (Hafner, Donlin-Asp, Leitch, Herzog, & Schuman, 2019). Furthermore, they were able to characterize the pool of mRNAs present and translated at synaptic level: these are mainly involved in synaptic function or related to mitochondria and ribosomes. Finally, they showed that local translation takes place also in inhibitory boutons and it is involved in different forms of synaptic plasticity, such as potentiation induced by neurotrophins (BDNF) and depression induced by the activation of metabotropic glutamate receptor 1 or 5 (mGluR1/5) or by endocannabinoids (Hafner et al., 2019).
Synaptic activity triggers the active transport of mRNAs and their associated factors, such as RNA binding proteins (RBPs) or miRNAs from the cell body into dendrites (Doyle & Kiebler, 2011). Currently, there is little insight concerning the molecular dynamics of mRNA transport. The hypothesized model predicts that, upon transcription, trans-acting RBPs recognize and bind cis-acting localization elements (zipcodes), commonly located in the 3’-untranslated region (3’-UTR) of transcripts. One of the most noteworthy examples of differential 3’-UTR usage is Brain Derived Neurotrophic Factor (BDNF) mRNA. BDNF transcripts can be processed at two different polyadenylation sites, giving rise to two different isoforms, one with a long 3’-UTR (2.85 kbp) and one with a short 3’-UTR (0.35 kbp) (Liu, 2006, 2005). The two isoforms produce the same protein, but the short transcript is restricted to the soma, while the long transcript is transported to the dendrites (An, 2008). In general, before its export from the nucleus to the cytoplasm, pre-mRNA is processed to a mature form and transported through the nuclear pore complex (Le Hir, Gatfield, Izaurralde, & Moore, 2001). After its export, the RNA-protein complex undergoes maturation via the binding of additional factors, including RBPs, adaptors and/or motor proteins. This remodeling results in the packaging of the mRNA into functional transport ribonucleoprotein particles (RNPs; Hutten, Sharangdhar, & Kiebler, 2014). Once assembled, cytoplasmic RNPs are translocated along microtubules via motor proteins to synapses. However, it is not clear how messenger ribonucleoparticles (mRNPs) are recruited to and retained at specific, activated synapses for subsequent translation. It has been suggested that the local actin cytoskeleton and associated motor proteins anchor specific mRNAs at the synapse (Martin & Ephrussi, 2009). Learning and memory require local transport of mRNAs and de novo synthesis of proteins. As each form of synaptic activation may exert distinct characteristics, most likely via different signaling cascades involving distinct signaling receptors, different sets of proteins are required for translation in order to achieve
Local synaptic translation, finally, plays a role also in the biogenesis of structural components. In fact, it has been showed that β-catenin mRNA preferentially localizes to newly established presynaptic terminals and is locally translated. This protein leads to a reduction in the rate of synaptic vesicle release during development of functional boutons, thus allowing the correct formation of the synaptic contact (Taylor, Wu, Tai, & Schuman, 2013).
4. Synapse reduction during aging
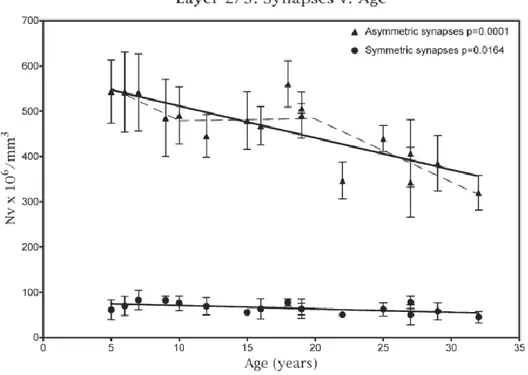
Aging of the brain is associated with mild cognitive decline, which mainly affects declarative and working memory, the latter being mediated by the prefrontal cortex (PFC). Several studies have analyzed the aging of this brain area and have suggested that, rather than a loss of neurons, a reduction of spines takes place during aging. In particular, Duan et al.(2003) showed that in layer III of area 46 of monkeys PFC the dendritic length is not affected by aging, but in old animals the number of spines on apical dendrites was reduced by 43%, while the number of spines on basal dendrites is reduced by 27%. Another study in monkeys correlated synaptic loss in layers II/III of area 46 with aging, showing that after 20 years the greatest synaptic loss affects asymmetric synapses (Fig.5) (Peters, Sethares, & Luebke, 2008).
Figure 5.Age-dependent synaptic loss in layers II/III of area 46 of monkeys prefrontal cortex. Symmetric and
In the same study, they showed an inverse correlation between Cognitive Impairment Index (CII) and asymmetric synapse number in layers II/III of area 46 (Peters et al., 2008), meaning that a decrease in synaptic density is associated to a higher cognitive impairment. A successive study (Dumitriu et al., 2010) demonstrated that the age-dependent synaptic reduction in area 46 of monkey PFC mostly affects thin spines, which are the most motile and plastic and seems to be associated with the acquisition of new memories. In particular, they found a strong correlation between the decrease in working memory function (measured with DNMS - delayed non-matching-to-sample – test) and the average volume of thin spines (rho = 0.97; Fig.6). For what concerns the other types of spines, such as the mushroom-shaped ones, they found no change upon aging. Finally, they observed that the thin spines that were left unmodified in old animals were larger than those present in young animals, suggesting a decreased functionality of these highly dynamic structures (Dumitriu et al., 2010).
Figure 6. Cognitive performances significantly correlate with synaptic density and spine volume. A)Correlation of synaptic density with DNMS test in young and old animals. B) Correlation of thin spines
density with DNMS test in young and old animals. C) Correlation of DNMS with thin spine head volume in young and old animals. D) Correlation between mushroom spine head volume and DNMS test scores in
In contrast with primate brain, mouse cortex exhibits an increase in bouton dynamics upon aging. In particular, en passant boutons seem to be formed and eliminated with a much higher frequency in old animals, thus impairing the acquisition of new memories connected with the stabilization of the synaptic contact (Grillo et al., 2013).
5. Synaptosomes as a research tool
The fundamental role of the synapse in neurotransmission and plasticity has fueled increasing efforts for the identification of synaptic protein and later RNAs, leading to the establishment of increasingly comprehensive mapping and profiling of the synaptic proteome and transcriptome. Sample complexity reduction strategies are required to facilitate meaningful applications of proteomic and transcriptomic analyses. The feasibility of protein enrichment by subcellular fractionation has been demonstrated through the analysis of the rat brain sub-proteomes of cytosolic, mitochondrial and microsomal fractions (Ori et al., 2015). Another well-established subcellular fractionation technique, synaptosomal isolation, has recently been applied in various proteomic studies, providing an enrichment of cellular components found at the synapse. By further fractionation the synaptosomes, it is possible to isolate specific synaptic regions, such as the vescicles.
The term “synaptosome” was first mentioned in a paper published in 1964 by Whittaker's group (Gray &Whittaker, 1962). The aim of the study was to explore the synaptic localization of several known and putative neurotransmitters and their synthesizing enzymes, and to subfractionate the disrupted synaptosomes to obtain homogeneous fractions of synaptic vesicles and other synaptic components(Whittaker, Michaelson, & Kirkland, 1964). Rather than organelles, synaptosomes are artificial, membranous sacs that contain synaptic components and are generated by subcellular fractionation of homogenized or ground-up nerve tissue, because the lipid bilayers naturally reseal together after the axon terminals are torn off by the physical shearing force of homogenization. Synaptosomes contain the complete presynaptic terminal, including mitochondria and synaptic vesicles, along with the postsynaptic membrane and the postsynaptic density (PSD). This typical morphology can be observed clearly via electron microscopy (Fig.7; Daniel, Malladi, Kettle, McCluskey, & Robinson, 2012). Roughly 40% of synaptosomal mass is composed of glial fragments (Biesemann et al., 2014) that most likely originate from the tripartite synapse.
Figure 7. Synaptosomes were attached to PEI-coated 1.4-mm sapphire coverslips in 96-well plates by
centrifugation in 30 μg/ml of synaptosomal protein in SET medium. Synaptosomes were then incubated in HBK at 30 °C for 15 min to facilitate recovery from low-temperature conditions. Synaptosomes were processed for electron microscopy and imaged. Scale bar 0.5µm. Figure from Daniel et al.(2012)
Synaptosome preparation is achievable with slightly different protocols all based on several differential centrifugation steps followed by sucrose (Gray &Whittaker, 1962; Whittaker et al., 1964), Ficoll/sucrose (Booth & Clark, 1978), or Percoll (Nagy & Delgado‐Escueta, 1984) density-gradient ultracentrifugation, to enrich a crude synaptosomal fraction from their mitochondrial and microsomal contamination. Synaptosomes have been extensively used as research tool in both proteomic (Moczulska et al., 2014; Schrimpf et al., 2005) and transcriptomic studies (Chen et al., 2017) (cfr §7 and §9 for more details).
6. Proteomic analysis platforms
In the last decade, mass-spectrometry based methods have been developed to obtain global profiling of protein abundance in biological samples. When a global assessment of the total synaptosomal proteome is desired, a combination of several proteomic platforms should be used, as these have been shown to be complementary rather than alternative ways of measuring protein abundances in biological systems (Wu, Wang, Baek, & Shen, 2006). For the last 15 years, liquid chromatography-tandem mass spectrometry (LC-MS/MS)-based proteomics has provided broad detection and relative quantification of thousands of proteins across a variety of biological samples using a data-dependent acquisition (DDA) strategy (Bateman et al., 2014). In DDA, a subset of the most abundant ions reaching the mass spectrometer detector during an MS1 scan
are individually isolated and fragmented in sequential MS2 scans, and each MS2 scan can be analyzed with a database search algorithm (Fig.8 - Mann, Hendrickson, & Pandey, 2002).
Figure 8. A cartoon schematic of how peptides are isolated, fragmented, and analyzed by a mass
spectrometer working in data-dependent acquisition (DDA) or data-independent acquisition (DIA) modes. In DDA, single precursor ions are isolated, fragmented, and analyzed in an MS2 scan by the mass spectrometer. The precursor ions are then chosen by the instrument on the basis of abundance. DIA is different from DDA in that all precursor ions within a selected mass range are isolated, fragmented, and analyzed in a single MS2 scan. Picture adapted from Hu, Noble, & Wolf-Yadlin, (2016).
DDA typically can quantify a few thousand of proteins from cells or tissue homogenates. Unfortunately, irreproducibility and imprecision are fundamental to DDA’s design; if too many peptide species co-elute and appear in a single MS1 scan, then DDA stochastically samples only the most abundant peptides and misses the rest. This approach diminishes reproducibility and prevents the measurement of low-abundance peptides (Venable, Dong, Wohlschlegel, Dillin, & Yates, 2004). Additionally, to survey as many peptides as possible, DDA deliberately samples each peptide species only once or twice, preventing precise absolute quantification that requires multiple measurements per peptide (Hu et al., 2016). DIA repeatedly samples the same peptides for more precise quantification; it differs from DDA by dispensing with the isolation of individual peptide species and instead repeatedly selecting mixtures of peptide species within large, pre-specified mass ranges for MS2 scans. DIA is therefore guaranteed to sample all peptides within the selected mass ranges, allowing for the identification of all sufficiently abundant peptides within them if the resulting spectra are properly interpreted (Bilbao et al., 2015). Proper interpretation of DIA data is currently problematic because the complex MS2 scans contain mixtures of peptides and therefore are more difficult to analyze. Fortunately, recent developments in bioinformatics software have adequately overcome this DIA issue, so that DIA now closely matches DDA in the number of peptide identifications while still allowing precise quantification of most of them. Quantification relies on comparing DIA spectra to sets of annotated and refined peptide-MS2 spectrum matches from DDA experiments called spectral libraries that show accurate,
empirically determined fragmentation patterns for each peptide in the library. However, DIA is currently more imprecise, compared to other MS acquisition modalities, to measure very low-abundance peptides, likely because their signals are dwarfed by those from abundant co-eluting peptides (Hu et al., 2016).
In this work I followed the pipeline illustrated in Fig.9. Proteins were precipitated, digested, separated by Ultra Performance Liquid Chromatography and analyzed by Mass spectrometry. The peaks were then analyzed with Pulsar software for library creation and then quantified with Spectronaut.
Figure 9.Proteomics pipeline. Proteins are precipitated using acetone, then trypsinized, separated by UPLC
and analyzed by MS/MS. Libraries are created using Pulsar and peaks are quantified using Spectronaut. Then differential expression analysis and overrepresentation analysis are run using R studio.
7. Synaptosome proteomics
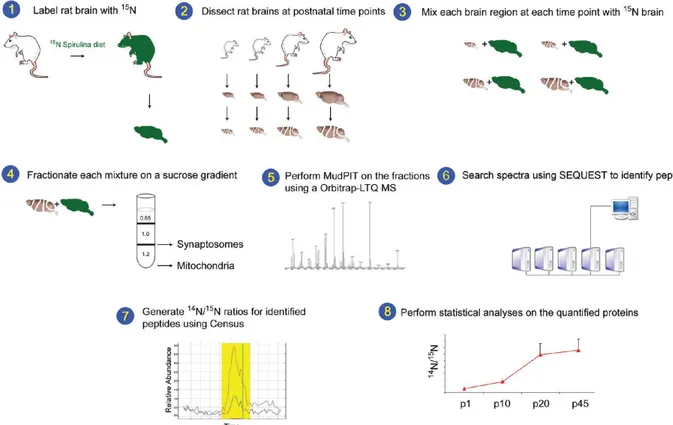
The application of Mass Spectrometry (MS) methods represented a major breakthrough in the identification of proteins present in the synapse. Previous proteomic analyses of synaptosomal samples revealed a high complexity of its proteome (Filiou et al., 2010; McClatchy, Liao, Lee, Park, & Yates, 2012). In Filiou’s paper Isoelectric Focalization (IEF) was coupled with LC-MS/MS to obtain a comprehensive analysis of murine synaptosome proteome and phosphoproteome. With this technique, they identified 2980 unique proteins with two or more peptides, including 118 phosphoproteins (Filiou et al., 2010). McClatchy et al., instead, used Metabolic15N labeling and Multidimensional Protein Identification Technology (MudPIT) to analyze three rat brain regions (cortex, hippocampus and cerebellum) at four different time points (p1, p10, p20, p45) (Fig.10). They identified 167429 peptides and found 3081 statistically significant changes during development and 1896 statistically significant changes between brain regions (McClatchy et al., 2012).
Figure 10. Graphical abstract from McClatchy et al. (2012). Rats were labeled with 15N, and the 15N-labeled
p45 brains (green) were removed and homogenized (1). The hippocampus, cortex, and cerebellum were dissected from unlabeled (14N) rats at p1, p10, p20, and p45 (2). The 15N total brain homogenate was mixed
from each mixture using a discontinuous sucrose gradient (4). Each fraction was analyzed by MudPIT on an LTQ-Orbitrap hybrid mass spectrometer (MS) (5). The MS data was searched with SEQUEST to identify the peptides and subsequent proteins in each fraction (6). Census calculated the 14N /15N ratios for the identified peptides. An example of the Census output with the 14N (red line) and the corresponding 15N (blue line) peptide abundances is shown. The y-axis is relative abundance and the x-axis is time (7). Statistical analyses were performed on the average 14N /15N protein ratios. The 14N /15N ratios for the protein synaptophysin from the synaptosomal fraction in the cortex are shown (8).
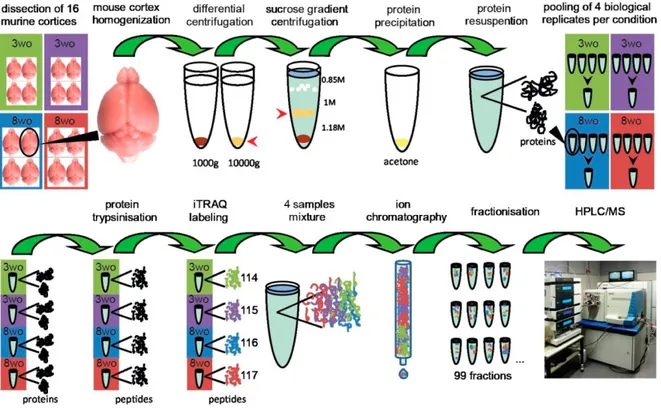
Finally, Moczulska et al. (2014) used an improved variant of MudPIT to quantitatively analyze changes in the synaptic proteome during development of the mouse brain. They quantified the developmental expression level of 3422 proteins during early postnatal development from adolescence (3 weeks) to early adulthood (8 weeks) (Moczulska et al., 2014; Fig.11).
Figure 11. Graphical abstract from Moczulska et al. Sample preparation and experimental workflow
incorporating high-resolution strong cation exchange. Mouse cerebral cortex from 16 animals was isolated, homogenized, and differentially centrifuged at 1000 g and 10000 g. The pellet obtained after 10000g centrifugation was redissolved and layered on a discontinuous sucrose gradient. The synaptosomal fraction was collected from the 1.18 M/1 M interface, and proteins were subsequently precipitated by cold acetone. The protein concentration was measured, and four pools (two young and two adult) were obtained by combining an equal amount of protein from individual synaptosomal preparations of four brains of identical age. The four protein samples were trypsinized and labeled with one of the four iTRAQ reagents. Subsequently, labeled samples were mixed, followed by off-line separation using strong cation exchange (SCX) chromatography. SCX fractions were analyzed by HPLC−MS using a 3 h gradient on a high-resolution nano HPLC system that was coupled online to a Velos Orbitrap mass spectrometer. Proteome Discoverer was used
for peptide identification, protein inference was accomplished according to maximum parsimony principle, and quantification was based on iTRAQ reporter ion intensities.
8. Transcriptomics analysis platforms
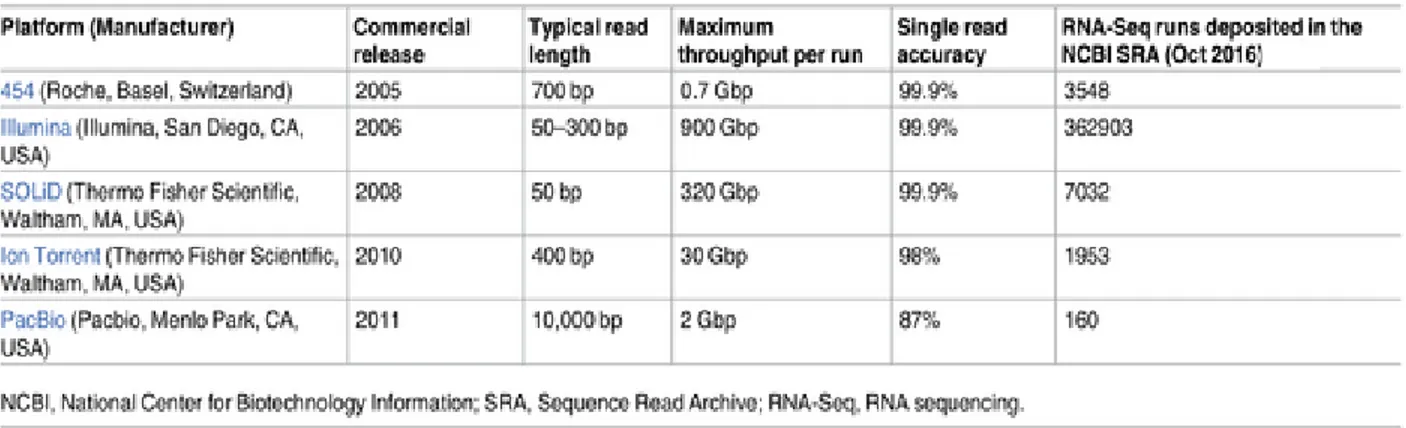
Transcriptomics platforms are able to provide a snapshot of a given condition, allowing the sequencing of a representative sample of all RNAs found in a tissue in a certain time point. The first attempt to obtain the transcriptome profile of human brain resulted in only 609 mRNA sequences (Adams et al., 1991). From that time, technology advancement provided high throughput platforms capable of identifying thousands of transcripts, and transcriptomes of disease states, tissues and also single cells are routinely generated (Sandberg, 2014). Before performing RNA sequencing, it is necessary to extract RNA from tissues or cells. This is usually achieved treating samples with chaotropic salts and then isolating RNA from other macromolecules such as DNA and proteins (Chomczynski & Sacchi, 1987). After RNA purification, it is necessary to remove ribosomal RNA (rRNA), which accounts for 80% of total RNA in a sample: rRNA removal strategies are usually based on affinity capture of rRNA (RiboZero techniques) or selective enrichment of mRNAs (polyA+ enrichment) (Zhao et al., 2014). Normally, for an RNA-seq experiment, a combination of high-throughput sequencing methodology and computational data analysis is used. Since the RNA molecule is converted to cDNA prior sequencing, high-throughput sequencing platforms for RNA-seq are basically the same as those for DNA RNA-sequencing (summarized in Fig.12).
Figure 12. Sequencing technology platforms commonly used for RNA-seq. Picture adapted from Lowe,
Shirley, Bleackley, Dolan, & Shafee (2017).
The length of the sequence generated by these platforms is usually around 100bp, but can vary from 30 to 10000 nucleotides (Fig.11). The standard pipeline of an RNA-seq experiment consists in the fragmentation of the RNA specimen, followed by its conversion in a cDNA molecule, which is then sequenced. The sequences are then quality controlled, aligned to a reference genome to obtain a quantitation of the abundance of each transcript (Lowe et al., 2017) and then analyzed for differential
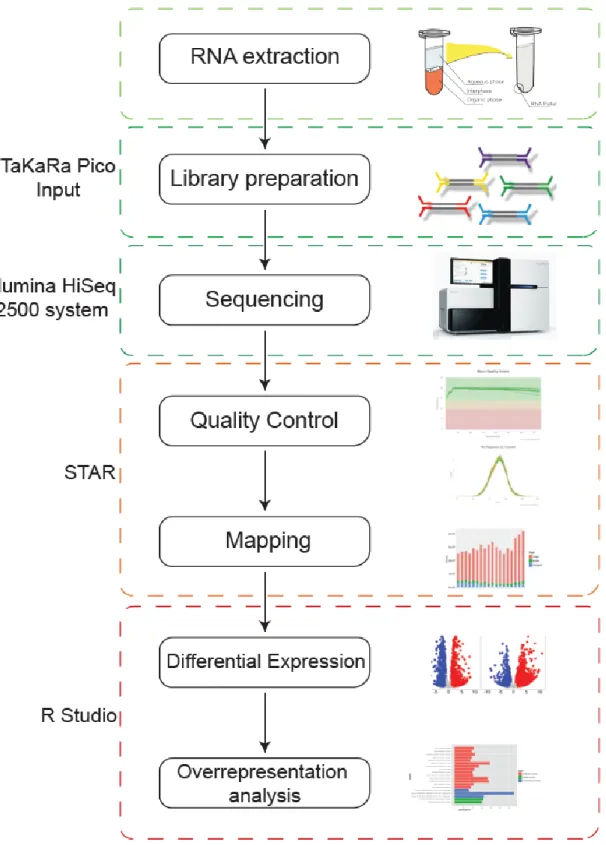
expression using R studio. In this work, I performed RNA-seq according to the standard pipeline described above, as illustrated in Fig.13.
Figure 13.Summary of RNA-sequencing. The mature transcripts are extracted from an organism, fragmented
and converted into cDNA. Libraries are prepared using TaKaRa Pico system, then cDNA is sequenced using Illumina technology. The sequences are quality controlled and aligned to a reference genome using STAR software. Finally they are analyzed in silicousing R studio.
9. Synaptosome transcriptomics
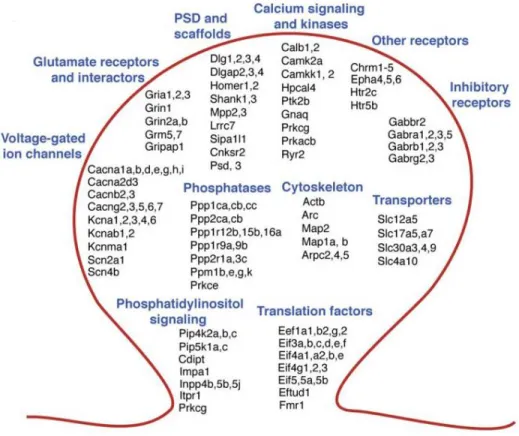
The application of high throughput sequencing platforms to synaptosome preparations is a relatively new field of analysis. Williams et al. applied microarray analysis to synaptoneurosomes isolated from the prefrontal cortex dissected post mortem from patients with Alzheimer’s disease at different stages. They were able to reveal early expression change in neuroplasticity genes, including those regulated and translated at the synapse(Williams et al., 2009). In Cajigas et al., the 454 sequencing technology was used to identify the full complement of mRNAs present in synaptic regions. They focused their attention on the CA1 area of the rat hippocampus and identified 2,550 mRNAs that are associated with the dendrites and/or axons in the hippocampal neuropil (Cajigas et al., 2012; Fig.14)
Figure 14.Main synaptic transcript families identified by microarrays performed on the CA1 neuropil. Picture
adapted from Cajigas et al. (2012)
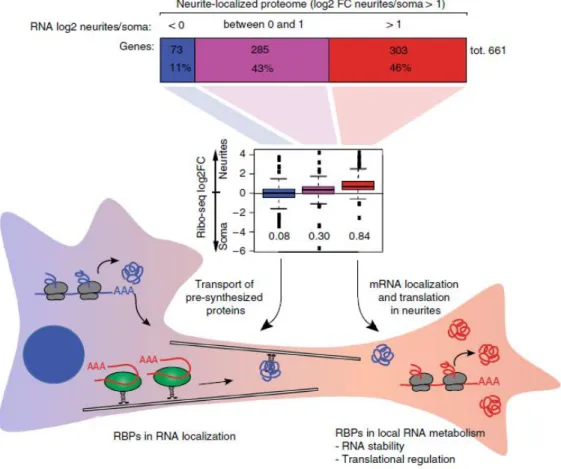
A recently published paper presented, for the first time, a comparative analysis of the synaptosome transcriptome in aging mouse brain. The authors show that, along with changes in expression of genes contributing to biological pathways related to neurite guidance and synaptosomal physiology, a vast number of novel, unannotated lincRNAs is also affected within local synaptic environment as a result of aging (Chen et al., 2017). In the work by Zappulo et al.(2017), a comprehensive analysis of synaptic transcriptome and proteome is provided. The authors used cultured neurons and
mechanically separated neurites from somata and performed on the two fractions RNA-sequencing, proteomic analysis and also quantified mRNA translation rates by ribosome profiling a protein synthesis by stable isotope labelling aminoacids in cell culture (SILAC) (Zappulo et al., 2017). They identified 661 proteins and 18111 protein-coding transcripts enriched in neurites. Among the latter they identified transcripts known to be synaptically localized and also transcripts encoding mitochondrial proteins. Using Ribo-seq and pulsed SILAC, they were able to confirm the translation of 242 proteins in soma and neurites. Interestingly, they identified some RNA binding proteins (RBPs) in neurites, which are associated mainly with translational control, RNA stability and spicing and some conserved RBP binding motifs in neurite-localized mRNAs. In this way they were able to divide neuritic proteins in three main classes: those that are translated locally, those that are mainly transported from soma to neurites and those with intermediate characteristics. To the latter class belong proteins whose synthesis has a partial contribution from the transported corresponding
mRNA
(Fig.15).
Figure 15. Proteins localized to neurites were divided in three groups according to the relative synaptic
abundance of the corresponding mRNA: proteins that are localized to the neurites but don’t have significant contribution from the corresponding mRNA are indicated in blue, neurite-localized proteins that have a partial contribution of the corresponding mRNA are indicated in purple, neurite-localized proteins whose
mRNA is also localized in neurites are indicated in red. As expected, the latter group of transcripts is also the more enriched in the ribo-seq experiment (middle panel). Picture adapted from Zappulo et al. (2017).
Ouwenga et al.(2017) applied TRAP (Translating Ribosome Affinity Purification) to a percoll-purified synaptoneurosomal fraction of mouse prefrontal cortex. With this approach, they were able to obtain a list of local translation candidates containing not only known synaptic proteins, but also novel candidates, such as Brsk1. Furthermore, they analyzed 3’UTRs and 5’UTRs of synaptically translated transcripts and found a high heterogeneity of regulatory sequences, such as G quartets and strong polyA signals (Ouwenga et al., 2017). Finally,Middleton, Eberwine, & Kim (2019) used single cell RNA sequencing to analyze transcript composition of mechanically dissected neurites and somata. They were able to provide a catalogue of constitutive dendritic transcripts (consDend) related to synaptic functions and cytoskeleton. Interestingly, they also identified a set of differentially expressed dendritic transcripts (deDend), whose function was mainly related to translation and mitochondrial activity. Furthermore, the same work identified some secondary structures in the 3’UTR, including two hairpin structures derived from B1 and B2 SINE elements, which appear to mediate the localization of the transcripts to the dendrites. In line with the abovementioned work of Zappulo, they postulated that, rather than the differential expression of Dendritic Targeting Elements (DTEs), neuritic mRNAs achieve their localization using tissue-specific RBPs(Middleton et al., 2019).
10. Protein aggregation
Protein aggregation is a phenomenon in which misfolded protein, that are not in the conformation required for their functionality, form large multimeric complexes or interact inappropriately with other cellular components impairing cell viability (Stefani & Dobson, 2003). Some diseases, called misfolding diseases, arise when a specific protein fails to fold correctly (Thomas, Qu, & Pedersen, 1995). Considerable attention is nowadays focused on a group of misfolding diseases called amyloidosis. In these diseases, specific peptides or proteins fail to fold or to remain correctly folded and then aggregate so as to give rise to ‘amyloid’ deposits in tissue (Stefani & Dobson, 2003). Amyloid structures can be recognized because they possess specific biochemical properties, due to a characteristic structure, constituted of highly organized β-sheets (Jiménez et al., 1999). Amyloidoses include a range of sporadic, familial or transmissible degenerative diseases, some of which affect the brain and the central nervous system (e.g. Alzheimer’s and Creutzfeldt-Jakob diseases)(Dobson, Swoboda, Joniau, & Weissman, 2001).
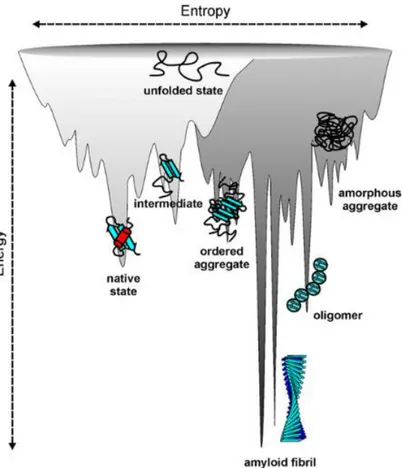
Newly synthesized proteins fold into their native structure, which represents a local minimum of free energy. During the folding process, though, the polypeptide might assume some intermediate conformations which are characterized by a lower energy state than the native state, such as that of the amyloid fibril (Jahn & Radford, 2008; Fig.16).
Figure 16. llustration of a combined energy landscape for protein folding and aggregation, showing the
multitude of conformational states available to a polypeptide chain. Picture adapted from Jahn & Radford (2008).
Protein misfolding that leads to aggregation can arise as a consequence of age, environmental stress, chemical modifications, destabilising mutations or lack of oligomeric assembly partners (O’Connell, Zhao, Ellington, & Marcotte, 2012; Vendruscolo, 2012). In fact, loss of proteome balance during aging, was recently analyzed in Caenorhabditis elegans (Reis-Rodrigues et al., 2012; Walther et al., 2015). Reis-Rodrigues et al.(2012) analyzed SDS-insoluble aggregates and found a notable enrichment for proteins encoding ribosomal subunits and, in general, for proteins related to translation, growth, cofactor metabolic process, determination of adult lifespan and respiratory chain (Reis-Rodrigues et al., 2012). In Walther’s work, the authors used SILAC in order to label and identify proteins at different time points and observed a change in stoichiometry of different proteins which may underlie an impairment of proteostasis. Furthermore, they analyzed protein aggregates and observed that the most soluble proteins were also the most abundant and those that contributed more to the aggregation in aged animals. They also observed that long-lived daf-2 mutants sequestered toxic proteins into aggregates, while hsf-1 mutants accumulated more soluble proteins. Therefore, they hypothesized that protein aggregation might be the combined result of the general proteostasis impairement and of an attempt of the cell to sequester toxic proteins from the cytoplasm (Walther et al., 2015).
11. Aim of the thesis
In the scenario described above, a comparison between synaptic transcriptome and proteome at different ages seems to be lacking. Therefore, the aim of this work is to analyze, for the first time, the composition of synaptic proteome and transcriptome in mouse brain aging. To achieve this, I isolated synaptosomes from 3 weeks-, 5 months- and 18 months-old cortices and performed RNA-sequencing and Data-Independent Acquisition proteomics. These three time points span the three main stages of the brain: in fact at 3 weeks synaptogenesis is still ongoing, although the brain is already formed; at 5 months the mouse is considered young adult and this is an intermediate time point between development and aging. Some studies have found age-related deficits in contextual memory when comparing young (3–6-months-old) and aged (16–18-months-old) C57BL/6 mice (Fukushima et al., 2008; Peleg et al., 2010), therefore we picked this age as last time point in which cognitive decline starts. Furthermore, to shed some light in synaptic protein aggregation, synaptic aggregates were isolated from old mouse cortex optimizing a recently published protocol (Reis-Rodrigues et al., 2012), in order to perform proteomic analysis.
Results
1.Validation of synaptosomal enrichment by western blot and qPCR.
Synaptosomes were extracted from brains of 4 young (3 weeks old), 4 adult (5 months old) and 4 old (18 month old) male mice (n=12). The quality of enrichment for the synaptosomal fractions was initially assessed by Western blotting analysis using antibodies against glutamate receptor ionotropic NMDA 2B (NMDAR2B), a known postsynaptic protein (Hussain et al. 2016), Histone H3 (H3) and Tubulin. Fig.17A depicts a representative immunoblot showing enrichment of NMDAR2B and depletion of H3 in synaptosomal fractions. Fig.17B-C report the quantification of H3 and NMDAR2B in the different fractions.
RNA was extracted from synaptosomes. Expression of the following transcriptsthat were detected as enriched in hippocampal neurites by Cajigas (Cajigas, 2012) was measured by qPCR: Calcium/calmodulin-dependent protein kinase type II alpha chain (CAMKIIα), discs large homolog 4 (Dlg4), Glutamate Ionotropic Receptor AMPA Type Subunit 1 (Gria1) and Activity-regulated cytoskeleton-associated protein (Arc)(Fig.17D-G). Expression levels were normalized with respect toH3f3b, coding for the histonic protein 3, a transcript reported to be enriched in the somatic compartment (Cajigas, 2012). Since there was no significative difference between the three age groups, the data from the 12 animals were combined during the quantification of Western blot and qPCR.
Figure 17. Enrichment of canonical synaptic protein and transcripts. A) Example of Western blot on
subcellular fractions derived from an old mouse. TH = Total Homogenate, CY = Cytosol, CS = Crude Synaptosomes, ES = Enriched Synaptosomes. B) Quantification of Histone3 protein amount in each subcellular fraction. Statistical significance calculated with One-way ANOVA test. Tubulin was used as loading control. Since no significant difference was detected between the age groups the data from all the animals were combined for the quantification. N = 12. TH = Total Homogenate, CY = Cytosol, CS = Crude Synaptosomes, ES = Enriched Synaptosomes. C) Quantification of NMDAR2B protein amount in each
subcellular fraction. Statistical significance calculated with One-way ANOVA test. Tubulin was used as loading control. N = 12. TH = Total Homogenate, CY = Cytosol, CS = Crude Synaptosomes, ES = Enriched Synaptosomes. D-G) qPCR on synaptically-enriched transcripts. The expression values are normalized on
H3F3B, coding for the histonic protein 3 B. Lines connect fractions derived from the same samples. Total
homogenate (TH) and enriched synaptosomes (ES) were compared. Statistical significance was calculated with paired Student’s t-test. Since no significant difference was detected between the age groups the data from all the animals were combined for the quantification. N = 12. D) Camk2a mRNA. E) Dlg4mRNA. F)
Gria1mRNA. G) Arc mRNA.
After passing this initial quality control, global expression profiles of transcripts in the total homogenate and in the synaptosomal fraction were obtained using RNA-seq (Performed by the transcriptomic facility of Fritz Lipmann Institute in Jena) with Ribozero depletion of ribosomal RNAs (Petrova, Garcia-Alcalde, Zampaloni, & Sauer, 2017). Reads were aligned to the reference Mus
musculus genome (GRCm38.85) using Tophat software and assigned to specific genes. Since this
technique does not enrich specifically for messenger RNAs and primary transcripts are not depleted, a moderate percentage of reads mapping to intronic sequences is expected. Notably, the percentage of intronic reads was much smaller in the synaptosomal fraction (Fig.18), consistent with notion that this fraction contains mature RNAs transported from the cell body. A total of 32978 (19097coding) and 27905 (17911 coding) transcripts were detected with at least one read in the total homogenate and synaptosomal fraction, respectively.
Protein abundances were quantified by mass-spectrometry based proteomics and data independent acquisition (Performed by the proteomic facility of Fritz Lipmann Institute in Jena). A total of 4083 and 3221 proteins were detected with non-null peptide absolute intensity in the total homogenates and synaptosomal fraction, respectively. The percentage of proteins for which also the corresponding transcript was detected is 77% in total homogenate (N = 3176) and 98% in synaptosomes (N = 3168).
Figure 18. Fraction of reads mapping on intergenic region (purple), exonic regions (blue), intronic regions
(green), ribosomal RNA (rRNA) genes (red) in total homogenate (A) and synaptosomes (B). Unmappable reads are indicated in orange.
For each transcript and protein expressed in both fractions, an enrichment score in the synaptosomes was calculated (N = 3149). For each time point, genes belonging to gene sets synapse (GO:0045202) and nucleus (GO:0005634) were selected (Nuclear genes = 987 and synaptic genes = 346 in young animals; nuclear genes= 789 and synaptic genes = 337 in adult animals; nuclear genes = 925 and synaptic genes = 331 in old animals). Interestingly, the number of nuclear genes detected from transcriptomic and proteomic analysis is lower in adult animals than in young and old animals. Probability distribution functions of the enrichment scores of the abovementioned genes were estimated by kernel density and visualized as density plots. Fig.19A-C illustrate the enrichment of transcripts coding for synaptic proteins and the depletion of transcripts coding for nuclear proteins and Fig.19D-F illustrate the enrichment of synaptic proteins and the depletion of nuclear proteins for each of the three age steps separately.
Figure 19.Global enrichment of synaptic proteins and transcripts in the synaptosomes of three age groups. A-C) Gaussian kernel density plot of transcript enrichment. Synaptosomal fold change is reported in logarithmic
scale on the x axis, while the y axis shows the estimated probability density functions. Black line refers to proteins belonging to the GO category nucleus (GO:0005634) and red line to the GO category synapse (GO:0045202) are depicted in red. A)young animals, B) adult animals C) Old animals. D-E) Gaussian kernel density plot of protein enrichment. Synaptosomal fold change is reported in logarithmic scale on the x axis, while the y axis shows the estimated probability density functions. Black line refers to proteins belonging to the GO category nucleus (GO:0005634) and red line to the GO category synapse (GO:0045202) are depicted in red. D)young animals, E) adult animals F) Old animals.
2. Comparison of synaptosomal transcript enrichment with published datasets.
My RNA-seq data were compared with three recently published datasets. Ouwenga et al.(2017) used a Translating Ribosome Affinity Purification (TRAP) approach to identify transcripts specifically translated in neuronal processes in cerebral cortex (Fig.20A). A highly-significant correlation was detected providing an independent demonstration that our samples are enriched for synapses and that synaptic transcripts can be reliably identified. The fact that the correlation of our data was
particularly high with the TRAP dataset (rho = 0.723, p value < 2.2*10-16calculated with Spearman’s correlation), suggests that most of the transcripts I detected are actively translated. Zappulo et al. (2017) used neurons differentiated from mouse embryonic stem cells to analyze protein and RNA expression and translation rates in mechanically isolated cell bodies and neurites. They also analysed translation rates of synaptic transcripts by means of Ribo-seq and stable isotope labeling with amino acids in cell culture (SILAC) experiments. Finally, Middleton, Eberwine, & Kim(2019) used primary mouse hippocampal neurons from E18 embryos in which cell bodies and dendrites were mechanically separated using a micropipette. They performed single-cell RNA amplification and sequencing (aRNA) and identified a subset of highly conserved dendritic transcripts. These data were compared with synaptosomal enrichment of either transcripts or proteins I obtained from my preparations, combining the data from all three age groups (N=12) (Tab.1). In the case of Zappulo
et al. dataset, the correlation is lower than in the previous comparison (rho = 0.208 for proteins, p
value = 0.007 and rho = 0.068 for transcripts, p value < 7.68*10-7 calculated with Spearman’s correlation). It should be noticed, however, that I analysed synaptic proteome and transcriptome from cerebral cortex of adult animals, while Zappulo et al.(2017) used an in vitro differentiation model of only six days that generates embryonic neurons of uncertain regional identity. Finally, it is noteworthy that I found a high correlation of our data with highly conserved dendritic transcripts from Middleton et al.(2019)(rho = 0.523, p value = 1.11*10-9 calculated with Spearman’s correlation) (Fig.20D), further corroborating the strong synaptic content of my synaptosomal enrichment.
Table 1. Datasets correlated with proteomic and transcriptomic data.
Study Tissue Age Data Our dataset N. of matching
entries Ouwenga et al., 2017 mouse cortex 3 week
s
TRAP-seq
RNA-seq Ribo-zero RNA-seq 3527 Zappulo et al., 2017 mESC derived neurons DIV6 Stranded total RNA-seq Ribo-zero RNA-seq 5135 Zappulo et al., 2017 mESC derived neurons DIV6 LFQ proteomic LFQ proteomic 167
Middleton et al., 2019 Primary hippocampal
neurons E18 single-cell RNA amplification and sequencing Ribo-zero RNA-seq 529
Figure 20. Comparison of synaptosomal enrichment of transcripts or proteins with published datasets.
Enrichment is expressed as fold change synaptosomal fraction vs. total homogenate in logarithmic scale. Correlation was computed as using Spearman’s correlation coefficient and reported in the upper right corner of the plot, together with its p value. The best linear fit of the data equation is reported on the upper right part of the plot. A) Comparison with the dataset of Translating Ribosome Affinity Purification from cortical neuronal processes of Ouwenga et al. (2017). B) Comparison with neurite-enriched transcripts of embryonic neurons from Zappulo et al. (2017). C) Comparison with neurite-enriched proteins of embryonic neurons
from Zappulo et al. (2017). D) Comparison with conserved dendritic transcripts identified in Middleton et al. (2019).
3. Comparison of synaptosomal enrichment in transcriptome and proteome.
Genes were selected that: i) are detected also at the protein level and ii) are differentially expressed (in either direction) between synaptosomal fraction and total homogenate when p-values for differential expression at the protein and transcript level are combined in a meta-analysis (Fisher’s method) (Lury & Fisher, 1972) in young animals. This selection left 3149 pairs of matched proteins and transcripts. Synaptosomal enrichment at protein and transcript level of these is plotted as scatter plot in Fig.21. The first quadrant of this plot contains proteins that show synaptic enrichment also at the transcript level. Examples of proteins belonging to this group are the presynaptic protein Bassoon and the postsynaptic proteins Calcium/calmodulin-dependent protein kinase type II alpha chain (CAMKIIα), discs large homolog 4 (Dlg4) and Glutamate Ionotropic Receptor AMPA Type Subunit 1 (Gria1). The overrepresented GO categories within this gene set are reported in Fig.22B and clearly correspond to terms related to synapses and neuronal processes. The third quadrant contains genes that show somatic enrichment both at protein and transcript level, the overrepresented GO categories within this gene set are reported in Fig.22C and clearly correspond to terms related to nuclear proteins, as expected. The second and the fourth quadrants are interesting, as they contain genes whose corresponding proteins and transcripts show opposite directions of enrichment. The second quadrant contains synaptically-depleted proteins whose transcripts are enriched in the synaptosome. The overrepresented GO categories of this gene set are represented in Fig.22D and correspond mainly to organelles such as the mitochondrion or the ribosome but also to extracellular matrix and – surprisingly – to spliceosome. These likely correspond to transcripts that are translationally repressed or proteins whose half-life is shorter in the synapses. The fourth quadrant contains enriched proteins coded by depleted transcript. These proteins are possibly synthesized at somatic level and transported to the neuronal processes. The overrepresented GO categories of this gene set are represented in Fig.22A. These are enriched for term related to lytic vacuoles and vescicle components that are involved in soma-processes trafficking or in synaptic vescicle trafficking, such as dynamin family proteins, Syntaxin 12 (Stx12) and the synaptosomal associated protein 25 (Snap25).
Figure 21. Comparison of synaptosomal enrichment in proteome and transcriptome. Proteins and RNAs
enrichment are plotted as log of the ratio synaptosome vs. total homogenate. Quadrants were named clockwise, starting from the upper right one. The distribution of genes in each quadrant is not uniform according to Fisher’s exact test (p = 3.932*10-06). Protein and RNA fold changes were correlated using Spearman’s correlation (rho = 0.107, p = 1.675*10-9). TH = Total homogenate, Syn = Synaptosomes.
Figure 22. Overrepresentation of Cellular Component Gene Ontology terms in the four quadrants of Fig.21.
Similar terms are clustered together based on their semantic similarity using the REVIGO algorithm, and are colored according to log10(p value). A) Genes showing synaptosomal enrichment of protein and depletion of transcript. B) Genes showing synaptosomal enrichment of both protein and transcript. C) Genes showing
synaptosomal depletion of both protein and transcript. D) Genes showing synaptosomal depletion of protein and enrichment of transcript.
To obtain indirect evidence that transcripts in the second quadrant of Fig.21 (i.e. transcript enriched and protein depleted) are translationally repressed, I used the Zappulo et al.(2017) dataset as reference. I chose this dataset and not that from Ouwenga et al. (2017) because in the work by Zappulo et al., the authors quantified translation rates by Ribo-seq and protein synthesis rates by SILAC in isolated neurites as compared to isolated soma, whereas in the work by Ouwenga et al. the informations regarding proteins synthesis are not provided. Probability distribution functions of translation and protein synthesis rates were estimated by Gaussian kernel density and are reported as density plots in Fig.23A,B. Both translation rate and protein synthesis rate were lower for genes of the second quadrant as compared to genes of the first quadrant (p < 2.2*10-16 and p = 0.02, respectively, estimated by Wilcoxon Test).
Figure 23. Rates of translation and protein synthesis for transcripts in quadrants 1 and 2 of Fig.21 .A)
Probability density plot of the translation rates of transcripts belonging to quadrant 1 (black line) and 2 (red line). The samples are independent according to Wilcoxon Test (p < 2.2*10-16). B) Probability density plot of the protein synthesis rates of transcripts belonging to quadrant 1 (black line) and 2 (red line). The samples are independent according to Wilcoxon Test (p = 0.02).
As shown in Fig.22C, this quadrant is enriched for genes coding for ribosomal and mitochondrial proteins. To better visualize this relationship, I highlighted in the plot of Fig.21 genes belonging to the GO categories translation (GO:0006412), ribosomes (GO:0005840) and respiratory chain (GO:0070469) and synapse (GO:0045202) (Fig.24A) and I obtained translational rates in the neurites for these genes from Zappulo et al. and plotted these as probability density plots (Fig.24B). It is apparent that translation is higher for synaptic transcripts, which are all actively translated at synaptic level as compared to genes belonging to ribosome, translation and respiratory chain categories. It is of particular note that transcripts coding for the translational machinery are enriched but translationally repressed at synaptic level.
Figure 24. Comparison of synaptosomal enrichment in proteome and transcriptome for selected GO terms
in young animals. A) Proteins and RNAs were divided in four quadrants according to their fold change. Genes belonging to specific Gene Ontology (GO) terms were highlighted in different colors, red = synapses, yellow = translation, blue = ribosome, green = respiratory chain as indicated also in the legend. B) Probability density plot of the translation rates of transcripts belonging to the different terms. Samples are non-identical according to Kruskal-Wallis Test (p < 2.2*10-16).
The comparison between proteome and transcriptome of synaptosomes and total homogenate was repeated using the same procedure for the other two time points, yielding, respectively, 2726 and 3055 pairs of matched proteins and transcripts in adult and old animals (Fig. 25A depicts data coming from adult animals and Fig.26A refers to data coming from old animals). I also highlighted in the plots of Fig.25Aand 26A genes belonging to the GO categories translation (GO:0006412),
ribosomes (GO:0005840), respiratory chain (GO:0070469) and synapse (GO:0045202)(Fig.25B and Fig.26B).
Figure 25. Comparison of synaptosomal enrichment in proteome and transcriptome in adult animals. A)
Proteins and RNAs enrichment are plotted as log of the ratio synaptosome vs. total homogenate. Quadrants were named clockwise, starting from the upper right one. The distribution of genes in each quadrant is not uniform according to Fisher’s exact test (p = 2.86*10-07). Protein and RNA fold changes were correlated using Spearman’s correlation (rho = 0.141, p = 1.342*10-13). B) Genes belonging to specific Gene Ontology (GO) terms were highlighted in different colors, red = synapses, yellow = translation, blue = ribosome, green = respiratory chain as indicated also in the legend. TH = Total homogenate, Syn = Synaptosomes.
Figure 26. Comparison of synaptosomal enrichment in proteome and transcriptome in old animals. A)
Proteins and RNAs enrichment are plotted as log of the ratio synaptosome vs. total homogenate. Quadrants were named clockwise, starting from the upper right one. The distribution of genes in each quadrant is not uniform according to Fisher’s exact test (p = 6.847*10-16). Protein and RNA fold changes were correlated using Spearman’s correlation (rho = 0.270, p < 2.2*10-16). B) Genes belonging to specific Gene Ontology (GO) terms were highlighted in different colors, red = synapses, yellow = translation, blue = ribosome, green = respiratory chain as indicated also in the legend.TH = Total homogenate, Syn = Synaptosomes.
The overrepresented GO categories within the gene sets depicted in Fig.25A and 26A are reported in Fig.27 (referring to adult animals) and Fig.28 (referring to old animals). During aging, there is no substantial change in the genes enriched at synaptic level. The most relevant changes in GO categories affect genes that are enriched at transcript but not protein level in synaptosomes (located in the second quadrant). I could observe that in young animals there was an overrepresentation of categories related to spliceosome, both in quadrants 2 and 3 (Fig.22C-D); in adult and old animals these categories are overrepresented only in the 3rd quadrant (Fig.27C, 28C). GO categories related to ribosomes and respiratory chain are on the other hand overrepresented in the 2nd quadrant in young and adult animals (Fig.22D, 27D), but not in old animals (Fig.28D). At 18 months, in fact, respiratory chain GO category is overrepresented in Q3 (Fig.28C).
Figure 27. Overrepresentation of Cellular Component Gene Ontology terms in the four quadrants of Fig.25A (adult animals). Similar terms are clustered together based on teir semantic similarity using the
REVIGO algorithm, and are colored according to log10(p value). A) Genes showing synaptosomal enrichment of protein and depletion of transcript. B) Genes showing synaptosomal enrichment of both protein and transcript. C) Genes showing synaptosomal depletion of both protein and transcript. D) Genes showing synaptosomal depletion of protein and enrichment of transcript.
Figure 28. Overrepresentation of Cellular Component Gene Ontology terms in the four quadrants of Fig.26A (old animals). Similar terms are clustered together based on their semantic similarity using the
REVIGO algorithm, and are colored according to log10(p value). A) Genes showing synaptosomal enrichment of protein and depletion of transcript. B) Genes showing synaptosomal enrichment of both protein and transcript. C) Genes showing synaptosomal depletion of both protein and transcript. D) Genes showing synaptosomal depletion of protein and enrichment of transcript.