R E S E A R C H
Open Access
NGS-Trex: Next Generation Sequencing
Transcriptome profile explorer
Ilenia Boria
1, Lara Boatti
2, Graziano Pesole
3,4, Flavio Mignone
2*From Ninth Annual Meeting of the Italian Society of Bioinformatics (BITS)
Catania, Sicily. 2-4 May 2012
Abstract
Background: Next-Generation Sequencing (NGS) technology has exceptionally increased the ability to sequence DNA in a massively parallel and cost-effective manner. Nevertheless, NGS data analysis requires bioinformatics skills and computational resources well beyond the possibilities of many“wet biology” laboratories. Moreover, most of projects only require few sequencing cycles and standard tools or workflows to carry out suitable analyses for the identification and annotation of genes, transcripts and splice variants found in the biological samples under investigation. These projects can take benefits from the availability of easy to use systems to automatically analyse sequences and to mine data without the preventive need of strong bioinformatics background and hardware infrastructure.
Results: To address this issue we developed an automatic system targeted to the analysis of NGS data obtained from large-scale transcriptome studies. This system, we named NGS-Trex (NGS Transcriptome profile explorer) is available through a simple web interface http://www.ngs-trex.org and allows the user to upload raw sequences and easily obtain an accurate characterization of the transcriptome profile after the setting of few parameters required to tune the analysis procedure. The system is also able to assess differential expression at both gene and transcript level (i.e. splicing isoforms) by comparing the expression profile of different samples.
By using simple query forms the user can obtain list of genes, transcripts, splice sites ranked and filtered according to several criteria. Data can be viewed as tables, text files or through a simple genome browser which helps the visual inspection of the data.
Conclusions: NGS-Trex is a simple tool for RNA-Seq data analysis mainly targeted to“wet biology” researchers with limited bioinformatics skills. It offers simple data mining tools to explore transcriptome profiles of samples
investigated taking advantage of NGS technologies.
Background
Despite Next-Generation Sequencing (NGS) technolo-gies are becoming increasingly accessible and cost effec-tive and a large number of analysis tools are regularly made available to the research community, the through-put level reached and the complexity of the analysis still poses serious problems related to the management and the interpretation of data.
While the conceptual analysis pipeline to deal with NGS data is relatively easy to be drawn, the actual implementa-tion can be challenging. Indeed, the simple mapping of sequences onto a reference genome requires adequate computational power and properly set-up systems. Things gets even more complicated when it comes to compare data with annotated features because of the need of up-to-date databases and automated analysis procedures.
Even if many tools are available to perform those tasks (for a recent review and comparison see [1]) - also allow-ing the usage of remote servers thus reducallow-ing the hard-ware and softhard-ware requirements - they still require some skills to be installed or their usage needs suitable training.
* Correspondence: [email protected]
2
Dipartimento di Scienze e Innovazione Tecnologica, Università del Piemonte Orientale, Alessandria, Italy
Full list of author information is available at the end of the article
© 2013 Mignone et al.; licensee BioMed Central Ltd. This is an open access article distributed under the terms of the Creative Commons Attribution License (http://creativecommons.org/licenses/by/2.0), which permits unrestricted use, distribution, and reproduction in any medium, provided the original work is properly cited.
The efforts needed to set up the infrastructure and to acquire the required skills are beyond the possibility of many laboratories and are often not justified for projects where only few deep sequencing cycles are needed to address specific biological questions.
To fill this gap we developed an automatic system tar-geted to the analysis of Next Generation Sequencing data obtained from large-scale transcriptome studies. This sys-tem, we named NGS-Trex (NGS Transcriptome profile explorer) is available through a simple web interface http://www.ngs-trex.org and besides requiring a simple user interaction it offers an accurate characterization of the transcriptome profile of the samples under investiga-tion. The system is also able to assess differential expres-sion of genes at both gene and transcript level (i.e. splicing isoforms) by comparing the expression profile of different datasets.
Among the different tools available the only one that can be directly compared to NGS-Trex is the recently published GeneProf system [1]. GeneProf http://www. geneprof.org/GeneProf/ and NGS-Trex share the same philosophy being both web-based and intended to offer an “easy to use” tool for RNA-Seq data analysis. Also the well-established Galaxy tool [2] can be used to ana-lyse RNA-Seq data. However Galaxy is a more general purpose framework and it requires a strong user interac-tion at each stage of the workflow resulting in a rela-tively complex tool that requires a steep learning curve.
Results
Analysis overview
To complete the overall procedure the user has to per-form three simple steps: 1) create a“project” and upload the sequences; 2) tune the analysis parameters; 3) mine data for relevant information.
All datasets within the same project - besides being pro-cessed with the standard analysis procedure - are automati-cally compared each other to identify differentially expressed genes or differentially represented splice sites (i.e. introns). Data can be analysed with the default options but it is also possible to tune the procedure by setting few para-meters through a very simple form as shown in Figure 1. This allows the user to control sequences pre-processing, read mapping criteria against the reference genome and annotation strategy as described below.
Data analysis
The basic analysis workflow implemented in our tool fol-lows a common schema for RNA-Seq data. It is basically articulated into 4 steps: 1) sequence filtering to discard low quality reads, to remove cloning linkers and to iden-tify, whenever possible, sequence strandness; 2) mapping of reads onto the reference genome; 3) comparison of mapped reads to annotated features; 4) identification of
“interesting” features (such as highly expressed genes, un-annotated splicing events, significant differences in expres-sion levels).
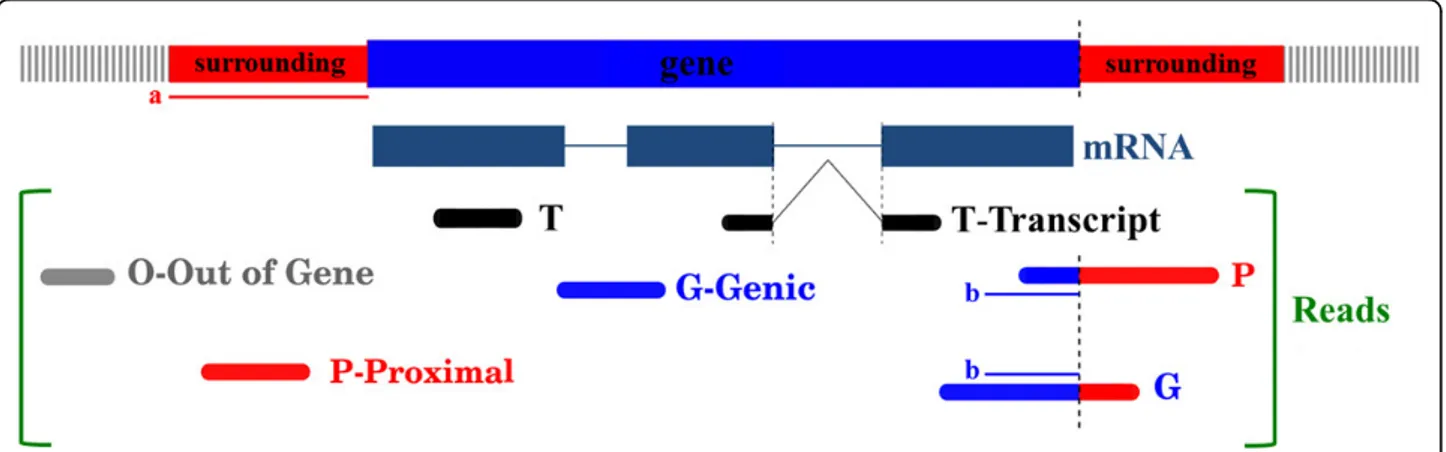
Through the filtering step it is possible to trim low qual-ity sequences and to remove adapters that may be part of the reads. If different adapters were used for 5’ and 3’ ends, it is also possible to orient reads improving the sub-sequent annotation procedure. Reads are then mapped onto the reference genome using two different algorithms depending on the sequencing technology: gmap [3] for longer sequences (such as Roche 454 reads) and TopHat [4] for shorter reads (i.e. Illumina or SOLiD). Mapped sequences that satisfy a filtering threshold defined by mini-mum overlap, minimini-mum similarity and maximini-mum number of multiple matches over the reference genome are selected for the annotation process. The annotation pro-cess is a multi-step procedure that ends with the assign-ment of reads to gene-specific clusters. We assign reads to genes with three degrees of confidence: reads mapping to a region flanking the gene (within a user-defined range) are tagged as proximal“P”, reads overlapping gene coordi-nates are tagged as genic“G”, reads showing contiguous mapping to RefSeq transcripts and not extending them over a user-defined threshold are tagged as“Transcript reads” “T”. Figure 2 shows a graphical representation of the assignment process.
The annotation process is very critical and several fac-tors may affect the quality of the annotation. The main problem is related to ambiguities in the correct assignment of a read to a gene [5]. Two distinct classes of ambiguities can be identified: we define class I ambiguities those gen-erated by overlapping genes and class II ambiguities those caused by reads which are not uniquely mapped on the genome (mainly due to paralogues genes, pseudogenes or gene clusters).
Several analysis workflows simply bypass class II ambi-guities by discarding sequences not uniquely mapped. The main problem with this approach is the introduction of an experimental bias with the alteration of reads count of gene families. Our system attempts to solve ambiguities using information about relative orientation of genes, about confidence of the assignment of the read to ambigu-ous genes and relying on strand information obtained from spliced reads. Indeed donor and acceptor sites of spliced reads can be used to guess the correct strand of reads when they are not oriented.
If reads are oriented (or spliced) and overlapping genes are on opposite strands, ambiguities can be easily solved and the read is assigned to the gene on the same strand; conversely if reads are not oriented and/or genes are on the same strand the correct assignment of a read to the right gene is more challenging. However, a reasonable solution to this issue is the assignment of the read to the competing genes with different level of confidence
Boriaet al. BMC Bioinformatics 2013, 14(Suppl 7):S10 http://www.biomedcentral.com/1471-2105/14/S7/S10
(the order of assignment of read is “T” > “G” > “P”). Whenever an ambiguity cannot be solved the user can choose either to discard the read or to assign the same read to both genes.
Finding“interesting features”
In addition to read assignment to genes and transcripts NGS-Trex identifies un-annotated splice sites. Putative new splice sites are classified according to their donor/acceptor
Figure 1 Setup analysis form. Snapshot of the form for the setup of all the parameters needed to perform the three steps of the analysis (pre-processing of sequences, mapping onto the reference genome, comparison to the available annotation). All fields are pre-compiled with default values.
sites and to the number of supporting reads. However they are not assembled into transcript models.
Finally, whenever two or more datasets are available for the same project, the system automatically identifies genes and introns that show a differential expression pattern. As pointed out in [6] a standard procedure for the identifica-tion of differentially expressed (DE) genes is not yet avail-able. Moreover current implementation of DE genes calculation in NGS-Trex treats each pair separately (biolo-gical replicates - if available - are not taken into account). In this context Fisher’s exact test appears adequate to reli-ably explore putative DE genes [7] and was implemented in our tool.
Data mining tools
Upon completion of the analysis process statistical sum-maries of data are provided together with several data mining tools.
Statistics show summary information about parameters used for the analysis, lengths distribution charts for both submitted and processed reads and flowchart of reads classified during the mapping and annotation processes. Finally, an overview of specific features like the number of novel introns, differentially expressed genes or introns is shown.
As depicted in Figure 3 it is possible to perform several queries on data by accessing very simple query forms. The“Query gene” panel allows a rapid search of a single gene using either the entrez gene ID or the hugo accession. The result is a brief summary showing the count of reads assigned to the gene and the count of both annotated and new introns identified by the analysis. Furthermore the dif-ferential expression pattern of the selected gene within the different datasets is provided. With the“Advanced search” panel it is possible to rank genes that satisfy several criteria.
In particular three indexes are available:“coverage”, the total number of sequences assigned to the gene;“depth”, the maximum number of reads covering a specific genic position;“focusing index”, the ratio between depth and cov-erage. If all or most of the reads map in a single position along the gene, the focusing index is high thus implying that the reads likely match a repetitive sequence. The lower is the focusing index, the more homogeneous is the distri-bution of aligned reads along the gene under investigation. When multiple datasets are queried it is possible to apply search criteria as intersection or union among datasets.
“DE genes” and “DE introns” panels can be used to high-light genes and introns that are significantly differentially expressed, i.e. up- or down-regulated between a reference and the others datasets.
Finally, with“New introns” query form it is possible to obtain a list of un-annotated splicing events and with “Transcripts” query panel it is possible to investigate the relation between reads and known transcripts by identify-ing the relative position of reads respect to CDS and UTRs regions.
Results are shown as tables and can be downloaded as tab-delimited text file to be easily imported into a spread-sheet program. A basic genome browser interface is also available to allow visual inspection of data and to simplify the download of reads assigned to a gene or mapped onto a genomic region.
Benchmark
To benchmark our system we processed the sequences obtained by [8] with Titanium 454-Roche-platform. Sequences are available at the NCBI Sequence Read Archive (SRA, http://www.ncbi.nlm.nih.gov/Traces/sra) with accession SRA012436. The Authors carefully analysed data and performed experimental validation to confirm
Figure 2 Read to gene assignment confidence. Reads are assigned to genes with three different levels. Proximal (P) reads are those mapping close to gene boundaries, Genic (G) reads overlap gene coordinates, Transcript (T) reads show ungapped matches with RefSeq transcripts annotated as part of the gene model, Extragenic reads (O) represent reads falling outside gene coordinates beyond the defined“surrounding” region. Both the extension of the“surrounding region” (thin red line labeled as “a” in figure) and the minimum overlap with gene mapping region to classify reads as“G” (thin blue line “b”) can be defined by the user.
Boriaet al. BMC Bioinformatics 2013, 14(Suppl 7):S10 http://www.biomedcentral.com/1471-2105/14/S7/S10
among other findings - splicing variants, enrichment in alternative splicing events and alterations in expression levels of several genes. Sequences were obtained from a pool of cDNA produced from two distinct cell lines HB4a and HB4aC5.2. A barcoding sequence was inserted to dis-criminate between the two datasets.
We firstly analysed the whole dataset mainly using our default values (we only tuned overlap and minimum simi-larity threshold for the mapping step to match the same values used in the paper: 70% and 96% respectively).
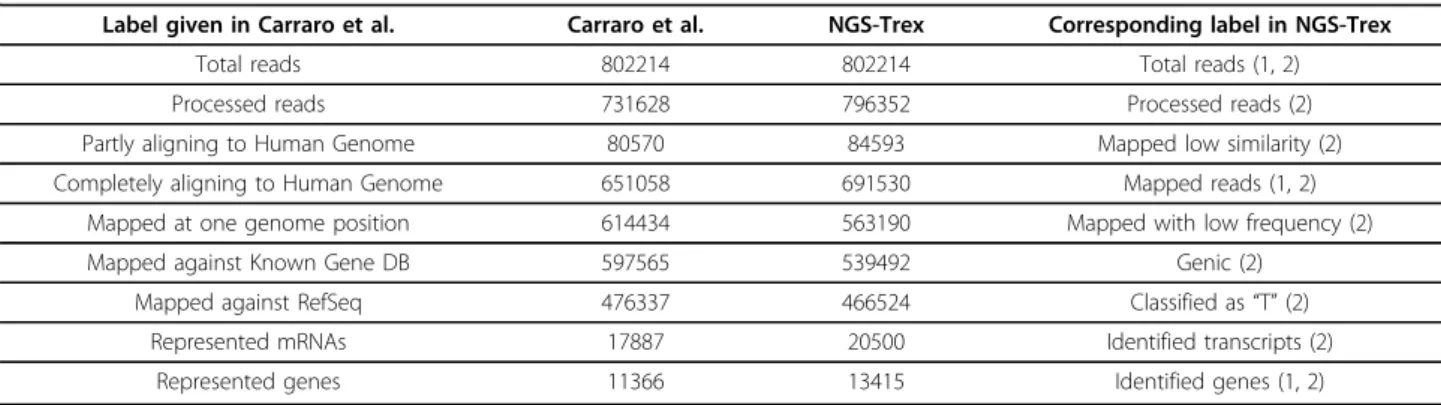
Table 1 summarizes the comparison between the results shown by Carraro et al. [8] and the results obtained with NGS-Trex analysis. It is important to underline that all data reported in the table are readily available from the web interface in the summary table or in the statistical report and show good correlation with data obtained by Carraro et al.
To identify DE genes we processed again the sequences using the barcoding information to discriminate between the two datasets. While NGS-Trex does not explicitly deal with pooled samples it is easy to obtain this feature creat-ing as many datasets as the barcodes used and defincreat-ing the proper barcode sequence as the linker in the filtering step of the procedure.
Comparison of fold changes and pValues of genes identi-fied as differentially expressed by Carraro with those extracted by NGS-Trex web interface is available in Addi-tional File 1. Fold changes are highly correlated between the two studies (rho = 0.775, p-Val < 2.2e-16) as depicted in Additional File 2 (kindly provided by one of the reviewers) reinforcing the reliability of the results obtained from our approach. Finally, we focused on new splicing events. Carraro and colleagues identified 2865 putative
new splicing events classified as intron retention, alterna-tive exon usage and alternaalterna-tive splice sites events (see Figure 4 in Carraro paper [8] or a description of the differ-ent classes). Those data are not directly comparable with our results because we use a different approach: while results shown in the paper deal with splicing from the “exon point of view”, NGS-Trex treats splicing from the “intron point of view”. So - as an example - we cannot explicitly identify a cassette-exon event but only the two distinct flanking introns. For this reason, considering that we do not identify intron retention events and that each exon-inclusion event is generated by 2 splice sites, the 2865 new splice variants suggested in the paper reflect -from NGS-Trex perspective - 1757 events. With our analy-sis we identified 1641 un-annotated introns (1253 with canonical Donor/Acceptor site), 683 of which confirmed by at least 2 reads (542 with canonical D/A site). All the experimentally validated splicing events have also been identified by our analysis (Table 2).
It is beyond the scope of this discussion to make a detailed comparison between the results obtained from the two methods. The differences can be explained by different parameters and software used. The goal of this comparison was simply to demonstrate that results obtained with our system with a very simple submission of sequences, without requiring a deep knowledge of underlying analysis proce-dures, are qualitatively comparable to those obtained from a manually curated analysis that involves the combination of custom procedures with the usage of external tools. Comparison with other tools
Several tools are already available for the analysis of NGS data (for a detailed comparison table see supplementary
Figure 3 Data-mining forms. Upon the completion of the analysis it is possible to mine information about single genes (Query Gene) or obtain lists of most represented genes in the samples (Advanced Search). DE Genes and DE Introns panels allow a simple exploration of putative differentially expressed genes or splicing events. It is also possible to identify un-annotated introns (New Introns) and to investigate reads assigned to RefSeq mRNAs (Transcripts).
note in [1]). Most of them require complex installation procedures and have specific hardware requirements or need a strong user interaction to perform the analysis. The only available tool comparable to NGS-Trex is - to our knowledge - GeneProf [1]. Nonetheless, this tool seems more focused on the early stage of the analysis: it offers automatic tools to import sequences from SRA database and shows many plots about sequence quality, base composition and read alignment statistics. On the other hand we were not able to find information about splicing or about annotation at transcript level. Finally, we did not find any method to download specific sequences set (i.e. reads assigned to a specific gene). This is quite important from a“wet biologist” perspective as it allows to carefully inspect sequences to identify muta-tions or to design primers for experimental validation of observed data.
We do not exclude that it is possible to extract these information by using GeneProf as a more experienced user but to this respect NGS-Trex seems more user-friendly.
Discussion
NGS-Trex is a user-friendly system to analyse RNA-Seq data. Indeed, to our knowledge any such web tool to visualize and download data mining results as well as
specific subset of sequence reads (i.e. those assigned to a specific gene, supporting a splice site, etc.) is not cur-rently available. These read subsets can be used for further analyses by using third part software. For exam-ple, the current NGS-Trex version does not allow the direct identification of SNPs, nonetheless, while is not possible to obtain a genome wide identification of SNPs, using the exploration and extraction tools currently pro-vided it is very easy to download sequences assigned to a specific gene and - by using external resources - process only the relevant sequences to obtain the required result.
The reliability of results provided by NSG-Trex has been supported by the benchmark assessment taking into account that observed discrepancies may be explained as the result of different tools and parameters as well as by difference in the genome feature annota-tion considered. However, our benchmark assessment has shown that results obtained by our system are quite comparable to those obtained from a manually curated analysis that involves the combination of custom proce-dures with the usage of external tools.
Methods Implementation
The analysis workflow has been implemented as a com-bination of custom perl and php scripts. Data are stored Table 1 Benchmark.
Label given in Carraro et al. Carraro et al. NGS-Trex Corresponding label in NGS-Trex
Total reads 802214 802214 Total reads (1, 2)
Processed reads 731628 796352 Processed reads (2)
Partly aligning to Human Genome 80570 84593 Mapped low similarity (2) Completely aligning to Human Genome 651058 691530 Mapped reads (1, 2)
Mapped at one genome position 614434 563190 Mapped with low frequency (2)
Mapped against Known Gene DB 597565 539492 Genic (2)
Mapped against RefSeq 476337 466524 Classified as“T” (2)
Represented mRNAs 17887 20500 Identified transcripts (2)
Represented genes 11366 13415 Identified genes (1, 2)
Summary of the comparison between the results shown by Carraro et al. [8] and the results obtained from NGS-Trex analysis. Data shown in the table are available from the summary table of the project in NGS-Trex website (1) or in the statistical report linked to the dataset (2). Differences can be mainly explained by different programs used, annotation releases and sources (UCSC genome browser data were used by Carraro, while NGS-Trex mainly relies on annotation data available from NCBI).
Table 2 Splicing variants.
Novel AS Events Carraro et al. Carraro et al. (*) NGS-Trex (N > 1) NGS-Trex (N > 2)
Total 2865 1757 (**) 1641 683
Canonical na na 1245 539
RT-PCR validation 18 36 36
qRT-PCR 8 16 16
As described more in detail in the text, NGS-Trex treats splicing events from the“intron point of view” while in Carraro work splicing are classified from the exon perspective. This implies that one cassette-exon event is identified by NGS-Trex as two splicing sites. To compare data we corrected data to take into account this difference. Column marked with (*) shows the corrected values. (**) 1757 events derive from 530 AS donor/acceptor site usage + 487 exon skipping + 562 exon inclusion + 89×2 exon inclusion (each exon inclusion needs 2 introns). See also Figure 4 in Carraro paper for details.
Boriaet al. BMC Bioinformatics 2013, 14(Suppl 7):S10 http://www.biomedcentral.com/1471-2105/14/S7/S10
as a combination of flat files and relational databases using Mysql RDBMS. As part of the analysis several tools have been included in the pipeline, namely 1) NGS QC Toolkit [9] for the processing of fastq sequences, 2) gmap (v. 2011-10-04) and 3) TopHat (v. 2.0.6) for align-ment step. All programs are used with default values.
Comparison with annotation is performed using a cus-tom database which is mainly populated with several sources obtained from NCBI ftp site. Genes mapping information is derived from NCBI while RefSeq and Genbank sequences (assigned to genes as part of Uni-gene clusters) are mapped onto the reference genome by using gmap software. Sequences are updated every 6 months.
In NGS-Trex are currently available Homo sapiens (Hg18, Hg19), Mus musculus (mm9) and few bacteria. More genomes will be added also upon request. As pre-viously described a critical step in the analysis procedure is the read assignment in the case of ambiguities. The user can define whether to discard ambiguously assigned reads or to assign those reads to all competing genes. Moreover it is possible to trigger a procedure to try to solve ambigu-ities. This procedure adopts several strategies: the first cri-terion is the confidence level of read assignment, being the order from higher to lower“T”, “G”, “P” (see text and Figure 2 for details). Whenever a read is assigned to more than one gene with the same confidence the procedure can still solve ambiguities for spliced reads if 1) the read supports an annotated splicing site, 2) the read is not oriented but the correct strand can be guessed using donor acceptor sites (in this case the read is treated as oriented and it is assigned to the gene on the same strand). If - after this procedure - it is still not possible to assign a read to a single gene it can be either assigned to all com-peting genes or discarded.
Differential expression (both at gene and splice site level) is evaluated applying Fisher’s exact test. Read counts from different samples are normalized by the total number of reads mapped onto the genome.
Concerning input data, NGS-Trex can handle long reads (454-Roche) and short reads (Illumina), with fixed or different lengths. Files in fasta or fastq formats are accepted. Currently paired-end reads are not supported (although they can be analysed as single end). Multi-plexed run can be processed.
Additional material
Additional File 1: Differentially expressed genes. List of differentially expressed genes validated in Carraro et al. [8]. Reads count of data obtained from Carraro are expressed as reads per million (RPM) and when no reads were identified in the RNA-Seq from one of the cell lines “0” was replaced by “1”. Reads counts obtained from NGS-Trex analysis are absolute (a scaling factor of 3.88 for Hb4a and 2.80 for C5.2 can be
applied to transform counts into RPM). When no reads were identified from one of the cell lines the fold change is“nd”.
Additional File 2: Correlation of fold change values. The plot shows the correlation between Carraro and NGS-Trex fold changes for the 88 genes listed in Additional File 1.
Authors’ contributions
IB participated in the design of the study and worked at the
implementation of the analysis workflow and of the website. LB carried out the validation benchmark. GP participated in the design of the study and helped to draft the manuscript. FM conceived the study, worked at the implementation of the analysis workflow and drafted the manuscript. All authors read and approved the final manuscript.
Competing interests
The authors declare that they have no competing interests. Acknowledgements
This work was supported by“Ministero dell’Istruzione, Università e Ricerca” (MIUR, Italy):“PRIN 2009- Large-scale identification and characterization of alternative splicing in the human transcriptome through computational and experimental approaches"; Consiglio Nazionale delle Ricerche: Flagship Project“Epigen”, PNR-CNR Aging Program 2012-2014, Italian Research Foundation for amyotrophic lateral sclerosis (AriSLA) and by Italian Ministry for Foreign Affairs (Italy-Israel actions).
This article has been published as part of BMC Bioinformatics Volume 14 Supplement 7, 2013: Italian Society of Bioinformatics (BITS): Annual Meeting 2012. The full contents of the supplement are available online at http://www.biomedcentral.com/bmcbioinformatics/supplements/14/S7 Declarations
This article was supported by Ministero dell’Istruzione, dell’Università e della Ricerca: FIRB“Futuro in ricerca” code RBFR08PWXIF.
Author details
1
Dipartimento di Chimica, Università degli Studi di Milano, Milano, Italy.
2Dipartimento di Scienze e Innovazione Tecnologica, Università del Piemonte
Orientale, Alessandria, Italy.3Dipartimento di Bioscienze, Biotecnologie e
Scienze Farmacologiche, Università degli Studi di Bari“A. Moro”, Bari, Italy.
4Istituto di Biomembrane e Bioenergetica, Consiglio Nazionale delle Ricerche,
Bari, Italy.
Published: 22 April 2013 References
1. Halbritter F, Vaidya HJ, Tomlinson SR: GeneProf: analysis of high-throughput sequencing experiments. Nature Methods 2011, 9:7-8. 2. Goecks J, Nekrutenko A, Taylor J, The Galaxy Team: Galaxy: a
comprehensive approach for supporting accessible, reproducible, and transparent computational research in the life sciences. Genome Biol 2010, 11(8):R86.
3. Wu TD, Watanabe CK: GMAP: a genomic mapping and alignment program for mRNA and EST sequences. Bioinformatics 2005, 21:1859-1875. 4. Trapnell C, Pachter L, Salzberg SL: TopHat: discovering splice junctions
with RNA-Seq. Bioinformatics 2009, 25:1105-1111.
5. Costa V, Angelini C, De Feis I, Ciccodicola A: Uncovering the Complexity of Transcriptomes with RNA-Seq. Journal of Biomedicine and Biotechnology 2010, 2010:1-20.
6. Kvam VM, Liu P, Si Y: A comparison of statistical methods for detecting differentially expressed genes from RNA-seq data. Am J Bot 2012, 99:248-256. 7. Auer PL, Doerge RW: Statistical design and analysis of RNA sequencing
data. Genetics 2010, 185:405-416.
8. Carraro DM, Ferreira EN, de Campos Molina G, Puga RD, Abrantes EF, Trapé AP, Eckhardt BL, Ekhardt BL, Nunes DN, Brentani MM, Arap W, Pasqualini R, Brentani H, Dias-Neto E, Brentani RR: Poly (A)+ transcriptome assessment of ERBB2-induced alterations in breast cell lines. PLoS ONE 2011, 6:e21022.
9. Patel RK, Jain M: NGS QC Toolkit: A Toolkit for Quality Control of Next Generation Sequencing Data. PLoS ONE 2012, 7:e30619.
doi:10.1186/1471-2105-14-S7-S10
Cite this article as: Boria et al.: NGS-Trex: Next Generation Sequencing Transcriptome profile explorer. BMC Bioinformatics 2013 14(Suppl 7):S10.
Submit your next manuscript to BioMed Central and take full advantage of:
• Convenient online submission
• Thorough peer review
• No space constraints or color figure charges
• Immediate publication on acceptance
• Inclusion in PubMed, CAS, Scopus and Google Scholar
• Research which is freely available for redistribution
Submit your manuscript at www.biomedcentral.com/submit
Boriaet al. BMC Bioinformatics 2013, 14(Suppl 7):S10 http://www.biomedcentral.com/1471-2105/14/S7/S10

![Table 1 summarizes the comparison between the results shown by Carraro et al. [8] and the results obtained with NGS-Trex analysis](https://thumb-eu.123doks.com/thumbv2/123dokorg/4812808.49962/5.892.75.810.140.411/table-summarizes-comparison-results-carraro-results-obtained-analysis.webp)