Dopaminergic Receptors on CD4
+
T Naive and Memory Lymphocytes
Correlate with Motor Impairment in
Patients with Parkinson’s Disease
Natasa Kustrimovic
1, Emanuela Rasini
1, Massimiliano Legnaro
1, Raffaella Bombelli
1,
Iva Aleksic
1, Fabio Blandini
2, Cristoforo Comi
3, Marco Mauri
4, Brigida Minafra
2,
Giulio Riboldazzi
4, Vanesa Sanchez-Guajardo
5, Franca Marino
1& Marco Cosentino
1Parkinson’s disease (PD) is characterized by loss of dopaminergic neurons in substantia nigra pars compacta, α-synuclein (α-syn)-rich intraneuronal inclusions (Lewy bodies), and microglial activation. Emerging evidence suggests that CD4+ T lymphocytes contribute to neuroinflammation in PD. Since the mainstay of PD treatment is dopaminergic substitution therapy and dopamine is an established transmitter connecting nervous and immune systems, we examined CD4+ T naive and memory lymphocytes in PD patients and in healthy subjects (HS), with specific regard to dopaminergic receptor (DR) expression. In addition, the in vitro effects of α-syn were assessed on CD4+ T naive and memory cells. Results showed extensive association between DR expression in T lymphocytes and motor dysfunction, as assessed by UPDRS Part III score. In total and CD4+ T naive cells expression of D1 -like DR decrease, while in T memory cells D2-like DR increase with increasing score. In vitro, α-syn increased CD4+ T memory cells, possibly to a different extent in PD patients and in HS, and affected DR expression with cell subset-specific patterns. The present results support the involvement of peripheral adaptive immunity in PD, and may contribute to develop novel immunotherapies for PD, as well as to better use of current dopaminergic antiparkinson drugs.
Parkinson’s disease (PD) is the second most common neurodegenerative disorder, affecting an estimated 7 to 10 million people worldwide and resulting in both motor and cognitive disturbances1–3. The main
neuropatho-logical features of PD are the progressive loss of dopaminergic neurons in the substantia nigra pars compacta, the appearance of intraneuronal inclusions called Lewy bodies, and the occurrence of microglial activation. Microglial cells in particular are key players in neuroinflammation and neurodegeneration, and peripheral adap-tive immunity has been recently proposed as a major determinant in the regulation of microglial function during neurodegenerative disease4–7.
Over the last 15 years, several studies described the occurrence of peculiar modifications of peripheral immu-nity in PD, such as decreased CD4+ /CD8+ T-cell ratios, fewer CD4+ CD25+ T cells and increased ratios of interferon (IFN)-γ -producing to interleukin (IL)-4-producing T cells8, as well as decreased CD4+ T
lympho-cytes and CD19+ B cells9,10. Both CD8+ and CD4+ T cells (but not B cells) were identified in the brain in both
postmortem human PD specimens and in the 1-methyl-4-phenyl-1,2,3,6-tetrahydropyridine (MPTP) mouse model of PD, and evidence obtained in the animal model pointed to CD4+ T cells as main determinants of T cell-mediated dopaminergic cell death11. Remarkably, Saunders et al.12 recently reported that PD patients have
increased effector/memory CD4+ T cells and decreased CD31+ and α 4β 7+ CD4+ T cells, which are associated with progressive motor dysfunction, suggesting a direct relationship between chronic immune stimulation and
1Center of Research in Medical Pharmacology, University of Insubria, Varese, Italy. 2Center for Research in
Neurodegenerative Diseases, “C. Mondino”, National Neurological Institute, Pavia, Italy. 3Movement Disorders
Centre, Neurology Unit, Department of Translational Medicine, University of Piemonte Orientale, Novara, Italy.
4Department of Biotechnology and Life Sciences, University of Insubria, Varese, Italy. 5Neuroimmunology of
Degenerative Diseases group and AUidias pilot-center NEURODIN, department of Biomedicine, HEALTH, Aarhus University, Aarhus, Denmark. Correspondence and requests for materials should be addressed to M.C. (email: marco. [email protected])
Received: 30 January 2016 Accepted: 02 September 2016 Published: 22 September 2016
PD neuropathology and disease severity, as well as strengthening the idea that in PD the lead actors among adap-tive immune system cells are CD4+ T lymphocytes.
No therapies are currently available for the neurodegenerative processes underlying PD, and symptomatic treatments rely on the dopamine (DA) precursor l-DOPA as well on dopaminergic agonists and on other indi-rect dopaminergic agents. Dopaminergic drugs relieve to some extent the loss of brain dopaminergic neurons occurring in PD, although, as disease progresses, both nonmotor and motor symptoms emerge that are resistant to dopaminergic medications13. Interestingly DA, besides its role as brain neurotransmitter, is also an established
transmitter connecting the nervous and the immune system, as well as immune cells and peripheral tissues14–16.
DA affects both innate and adaptive immune system cells, and immune cells produce DA, which may act as autocrine/paracrine mediator on immune cells themselves and on neighboring cells17–22. Among T lymphocytes,
CD4+ T cells may represent a major target for DA. DA subserves an (auto)inhibitory loop in human CD4+ CD25high regulatory T lymphocytes, a specialized T cell subset playing a key role in the control of immune
home-ostasis23, and dendritic cells-derived DA affects the differentiation of naive CD4+ T cells24. The effects of DA are
exerted through 5 different dopaminergic receptors (DR) grouped into the D1-like (D1 and D5) and the D2-like
(D2, D3 and D4)25,26. Immune cells express all DR and in particular CD4+ T cells express both D1-like and D2-like
DR23,27, with CD4+ naive T cells expressing more D
1-like than D2-like DR, which on the contrary are increased
in memory T cells28. Despite extensive evidence supporting the involvement of CD4+ T cells (and in particular
of memory T cells) in PD pathogenesis and progression8,10–12, no information exists on DR expression on CD4+
T cells in PD patients. Nonetheless, a recent investigation in the MPTP mouse model of PD suggested that DR D3 expressed on CD4+ T cells are critical for T cell-dependent microglial activation, which finally results in
neurodegeneration29.
The present study, examined CD4+ T cells, as well as naive and memory CD4+ T cell subsets, in PD patients and in healthy subjects, with specific regard to DR expression. Correlations of CD4+ T cell and cell subsets, as well as their respective expression of DR, were investigated with demographic and clinical features of the subjects. Patients on dopaminergic agents were compared with recently diagnosed patients who never received dopa-minergic medications. In addition, in preliminary experiments the in vitro effects of α -synuclein (α -syn) were assessed on CD4+ T naive and memory cells. α -syn is a protein expressed in brain and in peripheral tissues. It is the main component of Lewy bodies and it may contribute to the pathogenesis of PD through different concur-rent mechanisms, including direct activation of microglial cells as well as possibly by acting as an antigen itself, triggering the adaptive immune response in the periphery30–32. For these reasons, the effects of α -syn on CD4+
T naive and memory cells were also compared with those of a common recall antigen like tetanus toxoid (TTd).
Results
Subjects.
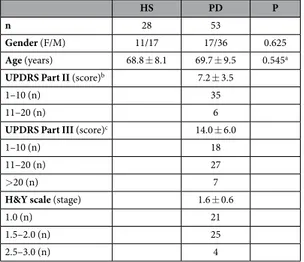
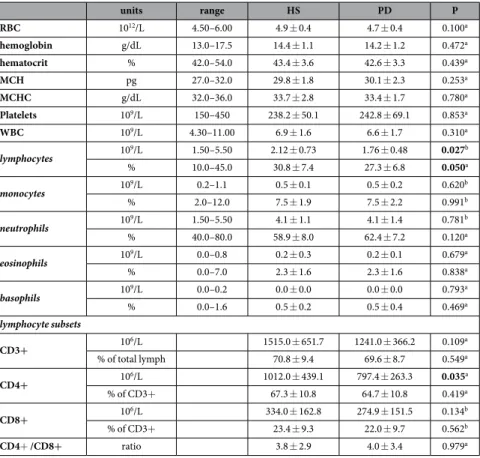
We enrolled 53 PD patients and 28 HS (Table 1). Patients comprised 16 subjects who had been never treated with antiparkinson drugs before enrollment, and were therefore drug naive (PD-dn). In compar-ison to patients on antiparkinson drugs (PD-dt), PD-dn were younger and had on average lower H&Y stage, as well as UPDRS Part III score (Table 2). Plasma dopamine was 3.2 ± 5.7 nM in HS, 2.7 ± 3.3 nM in PD-dn patients (P = 0.779 vs. HS), and 8.0 ± 9.8 nM in PD-dt patients (P = 0.003 vs. HS).Complete blood counts of PD patients and HS were all within normal limits (Table 3), however PD patients had less total lymphocytes, both in terms of absolute number (on average, about 17% less) and as percentage of white blood cells (− 3.5%).
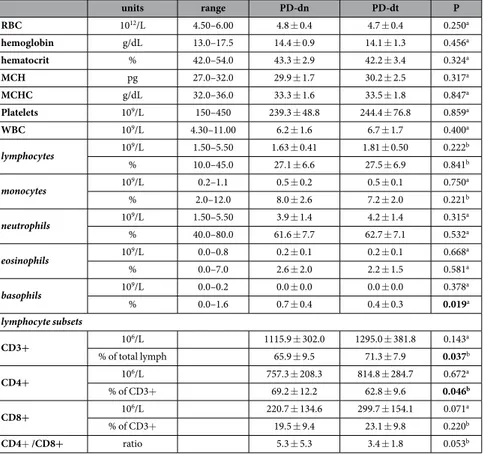
Complete blood count did not differ between PD-dn and PD-dt patients (Table 4), with the only exception of percentage of basophils, which were slightly lower in PD-dt.
T lymphocytes and CD4+ T naive and memory subsets.
Reduction of lymphocytes in PD patients was accounted for essentially by T cells (Table 3). In particular, CD4+ T cells were about 21% less in PD patientsHS PD P
n 28 53
Gender (F/M) 11/17 17/36 0.625
Age (years) 68.8 ± 8.1 69.7 ± 9.5 0.545a
UPDRS Part II (score)b 7.2 ± 3.5
1–10 (n) 35
11–20 (n) 6
UPDRS Part III (score)c 14.0 ± 6.0
1–10 (n) 18
11–20 (n) 27
> 20 (n) 7
H&Y scale (stage) 1.6 ± 0.6
1.0 (n) 21
1.5–2.0 (n) 25
2.5–3.0 (n) 4
Table 1. Comparison between HS and PD patients. Data are means ± SD unless otherwise indicated. Notes: a = by Mann-Whitney U test; b = data missing for 1 PD-dn and 11 PD-dt; c = data missing for 1 PD-dn patient.
in comparison to HS, even if the CD4+ /CD8+ ratio did not change in patients, likely due the overall reduction of T lymphocytes. T lymphocyte subsets did not differ in PD-dn and PD-dt patients in terms of absolute counts, even if in PD-dn patients CD3+ T cells as percentage of total lymphocytes were less (− 5.4%) and CD4+ T cells as percentage of CD3+ T cells were more (+6.4%) (Table 4).
To identify CD4+ T cell subsets, the gating strategy included the use of a biparametric dot plot CD45RA vs. CCR7, that allowed the identification of T naive (CD3+ CD4+ CD45RA+ CCR7+ ), TCM (CD3+ CD4+
PD-dn PD-dt P
n 16 37
Gender (F/M) 7/9 10/27 0.337
Age (years) 65.6 ± 10.8 71.4 ± 8.4 0.041a
UPDRS Part II (score) 6.9 ± 4.7b 7.5 ± 2.6b 0.606d
UPDRS Part III (score) 9.9 ± 5.9d 15.6 ± 5.3 0.002a
H&Y scale (stage) 1.2 ± 0.4 1.8 ± 0.5 <0.001a
LED (mg/day) 459.4 ± 247.4 Drugs l-DOPA (n) 27e DA agonists (n) 27f pramipexole (n) 19 ropinirole (n) 4 rotigotine (n) 4 Rasagiline (n) 19
Table 2. Comparison between PD-dn and PD-dt. Data are means ± SD unless otherwise indicated. Notes: a = by Student’s t test; b = data missing for 1 PD-dn and 11 PD-dt; c = data missing for 1 PD-dn patient; d = by Mann–Whitney U test; e = 8 taking l-DOPA alone, and 19 taking l-DOPA+ DA agents; f = 10 taking DA agonists alone (4) or with rasagiline (6), and 17 taking DA agonists+ l-DOPA, without (6) or with rasagiline (11).
units range HS PD P RBC 1012/L 4.50–6.00 4.9 ± 0.4 4.7 ± 0.4 0.100a hemoglobin g/dL 13.0–17.5 14.4 ± 1.1 14.2 ± 1.2 0.472a hematocrit % 42.0–54.0 43.4 ± 3.6 42.6 ± 3.3 0.439a MCH pg 27.0–32.0 29.8 ± 1.8 30.1 ± 2.3 0.253a MCHC g/dL 32.0–36.0 33.7 ± 2.8 33.4 ± 1.7 0.780a Platelets 109/L 150–450 238.2 ± 50.1 242.8 ± 69.1 0.853a WBC 109/L 4.30–11.00 6.9 ± 1.6 6.6 ± 1.7 0.310a lymphocytes 109/L 1.50–5.50 2.12 ± 0.73 1.76 ± 0.48 0.027b % 10.0–45.0 30.8 ± 7.4 27.3 ± 6.8 0.050a monocytes 109/L 0.2–1.1 0.5 ± 0.1 0.5 ± 0.2 0.620b % 2.0–12.0 7.5 ± 1.9 7.5 ± 2.2 0.991b neutrophils 109/L 1.50–5.50 4.1 ± 1.1 4.1 ± 1.4 0.781b % 40.0–80.0 58.9 ± 8.0 62.4 ± 7.2 0.120a eosinophils 109/L 0.0–0.8 0.2 ± 0.3 0.2 ± 0.1 0.679a % 0.0–7.0 2.3 ± 1.6 2.3 ± 1.6 0.838a basophils 109/L 0.0–0.2 0.0 ± 0.0 0.0 ± 0.0 0.793a % 0.0–1.6 0.5 ± 0.2 0.5 ± 0.4 0.469a lymphocyte subsets CD3+ 106/L 1515.0 ± 651.7 1241.0 ± 366.2 0.109a % of total lymph 70.8 ± 9.4 69.6 ± 8.7 0.549a CD4+ 106/L 1012.0 ± 439.1 797.4 ± 263.3 0.035a % of CD3+ 67.3 ± 10.8 64.7 ± 10.8 0.419a CD8+ 106/L 334.0 ± 162.8 274.9 ± 151.5 0.134b % of CD3+ 23.4 ± 9.3 22.0 ± 9.7 0.562b CD4+ /CD8+ ratio 3.8 ± 2.9 4.0 ± 3.4 0.979a
Table 3. Complete blood count, comparison between HS and PD patients. Data are means ± SD unless otherwise indicated. Notes: Abbreviations: RBC, red blood cells; MCH, mean corpuscular hemoglobin; MCHC, mean corpuscular hemoglobin concentration; WBC, white blood cells. a = by Mann–Whitney U test; b = by Student’s t test.
CD45RA-CCR7+ ), and TEM (CD3+ CD4+ CD45RA-CCR7-)28. Among CD4+ T cells, PD patients showed
decreased number of T naive cells (Fig. 1a). CD4+ TCM and TEM absolute numbers were not different in PD
patients and in HS, however TEM as percentage of total CD4+ T cells were increased in PD patients (+3.3% on
average) (Fig. 1c). PD-dn and PD-dt patients did not differ in either absolute number or percentage of T naive, TCM and TEM (Fig. 1b,d).
DR expression on CD4+ T cells.
DR expression was assessed at both mRNA level (in total CD4+ T cells) and membrane protein level (in total CD4+ T cells and in T naive and memory subsets). In comparison to cells from HS, CD4+ T cells from PD patients had lower mRNA levels of the D1-like DR D5 and of the D2-like DRD3 and D4, and higher mRNA levels of the D2-like DR D3, while D1-like DR D1 mRNA levels were not different
between cells from PD patients and HS (Fig. 2a). Interestingly, both the D1-like DR D5 and the D2-like DR D2
mRNA levels were lower in cells from PD-dn patients compared to cells from PD-dt patients (Fig. 2b).
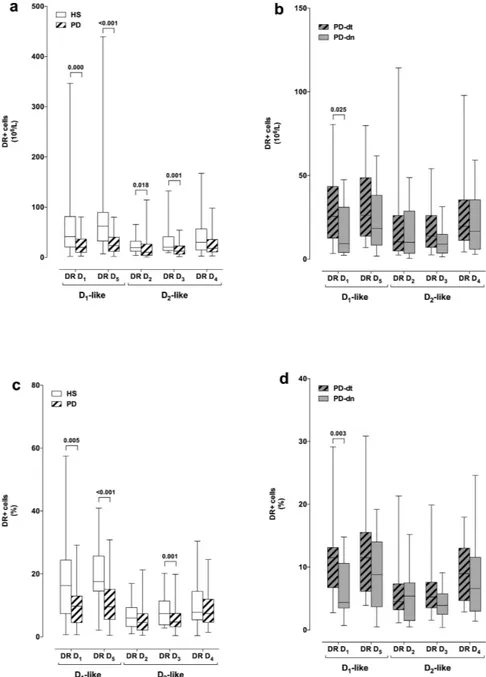
Flow cytometric analysis of DR expression on CD4+ T cells revealed that in PD patients DR D5+ CD4+
T cells were decreased in terms of both absolute number and percentage of total CD4+ T cells (Fig. 2c,e), and that PD-dn patients had lower number and percentage of DR D1+ and D3+ CD4+ T cells in comparison to PD-dt
subjects (Fig. 2d,f).
DR expression on CD4+ T naive and memory cells.
In comparison to HS, PD patients had less D1-likeDR D1+ and D5+ , as well as less D2-like DR D2+ and D3+ T naive cells, both in terms of absolute numbers and,
for DR D3+ cells, also of percentage of total CD4+ T cells (Fig. 3a,c). PD-dn patients had less DR D1+ T naive
cells in comparison to PD-dt patients, in terms of both absolute numbers and percentage of total CD4+ T cells (Fig. 3b,d).
No difference was found in DR expression in TCM and TEM between PD patients and HS, except for DR
D3+ TCM which were higher in PD patients in terms of percentage of total CD4+ T cells, and for DR D4+ TEM
which were higher in PD patients in terms of both absolute numbers and percentage of total CD4+ T cells (see Supplementary Fig. S1 and S2). DR expression on TCM or TEM did not differ between PD-dn and PD-dt patients
(see Supplementary Fig. S1 and S2).
Correlations between CD4+ T cells and demographic and clinical features of HS and PD
patients.
Age exerts major effects on lymphocyte function33, and in particular T naive cells may be reducedin elderly subjects34. In agreement with these findings, in HS both the absolute number as well as the percentage
units range PD-dn PD-dt P RBC 1012/L 4.50–6.00 4.8 ± 0.4 4.7 ± 0.4 0.250a hemoglobin g/dL 13.0–17.5 14.4 ± 0.9 14.1 ± 1.3 0.456a hematocrit % 42.0–54.0 43.3 ± 2.9 42.2 ± 3.4 0.324a MCH pg 27.0–32.0 29.9 ± 1.7 30.2 ± 2.5 0.317a MCHC g/dL 32.0–36.0 33.3 ± 1.6 33.5 ± 1.8 0.847a Platelets 109/L 150–450 239.3 ± 48.8 244.4 ± 76.8 0.859a WBC 109/L 4.30–11.00 6.2 ± 1.6 6.7 ± 1.7 0.400a lymphocytes 109/L 1.50–5.50 1.63 ± 0.41 1.81 ± 0.50 0.222b % 10.0–45.0 27.1 ± 6.6 27.5 ± 6.9 0.841b monocytes 109/L 0.2–1.1 0.5 ± 0.2 0.5 ± 0.1 0.750a % 2.0–12.0 8.0 ± 2.6 7.2 ± 2.0 0.221b neutrophils 109/L 1.50–5.50 3.9 ± 1.4 4.2 ± 1.4 0.315a % 40.0–80.0 61.6 ± 7.7 62.7 ± 7.1 0.532a eosinophils 109/L 0.0–0.8 0.2 ± 0.1 0.2 ± 0.1 0.668a % 0.0–7.0 2.6 ± 2.0 2.2 ± 1.5 0.581a basophils 109/L 0.0–0.2 0.0 ± 0.0 0.0 ± 0.0 0.378a % 0.0–1.6 0.7 ± 0.4 0.4 ± 0.3 0.019a lymphocyte subsets CD3+ 106/L 1115.9 ± 302.0 1295.0 ± 381.8 0.143a % of total lymph 65.9 ± 9.5 71.3 ± 7.9 0.037b CD4+ 106/L 757.3 ± 208.3 814.8 ± 284.7 0.672a % of CD3+ 69.2 ± 12.2 62.8 ± 9.6 0.046b CD8+ 106/L 220.7 ± 134.6 299.7 ± 154.1 0.071a % of CD3+ 19.5 ± 9.4 23.1 ± 9.8 0.220b CD4+ /CD8+ ratio 5.3 ± 5.3 3.4 ± 1.8 0.053b
Table 4. Complete blood count, comparison between PD-dn and PD-dt. Data are means ± SD unless otherwise indicated. Notes: Abbreviations: RBC, red blood cells; MCH, mean corpuscular hemoglobin; MCHC, mean corpuscular hemoglobin concentration; WBC, white blood cells. a = by Mann–Whitney U test; b = by Student’s t test.
of CD4+ T naive cells negatively correlated with age (− 0.395 (− 0.026 to − 0.670), P = 0.037, and − 0.472 (− 0.120 to − 0.718), P = 0.011). No correlation on the contrary was found between age and the immune profile in PD patients, either as a whole or in PD-dn and PD-dt patients.
The relationship between disease severity and CD4+ T cells was assessed by dividing PD patients into 3 groups according either to the UPDRS Part III score or the H&Y stage (Table 1), thereafter comparing each group with HS and analyzing the linear trend throughout the groups by means of ANOVA. No relationship was found between CD4+ T naive or memory cells and the UPDRS Part III score or the H&Y stage, with the only exception of a positive linear trend in the percentage of TCM cells and UPDRS Part III (see Supplementary Fig. S3).
Figure 1. CD4+ T naive and memory cells in HS and PD patients. Cells are shown as absolute numbers (panels a,b) and as percentage of total CD4+ T cells (c,d). Data are shown as medians with 25°–75° percentiles (boxes) and min-max values (whiskers). Comparisons are shown between HS and PD patients as a whole (a,c) and between drug naive (PD-dn) and drug treated (PD-dt) patients (b,d). Differences were analyzed by means of two-tailed Student’s t test or by Mann-Whitney test, as appropriate. P values less than 0.05 are indicated in the graphs.
Figure 2. DR expression on CD4+ T cells from HS and from PD patients. DR expression is shown as mRNA levels (panels a,b) and as protein expression on the membranes of CD4+ T cells, expressed as absolute numbers of DR+ cells (c,d) and as percentage of total CD4+ T cells (e,f). Comparisons are shown between HS and PD patients as a whole (a,c,e) and between drug naive (PD-dn) and drug treated (PD-dt) patients (b,d,f). Data are shown as medians with 25°–75° percentiles (boxes) and min-max values (whiskers). Differences were analyzed by means of two-tailed Student’s t test or by Mann-Whitney test, as appropriate. P values less than 0.05 are indicated in the graphs.
In PD-dt patients, no relationship was found between either CD4+ T cells as a whole or CD4+ T naive or memory cells and disease duration or LED (data not shown).
Correlations between DR expression on CD4+ T cells and demographic and clinical features
of HS and PD patients.
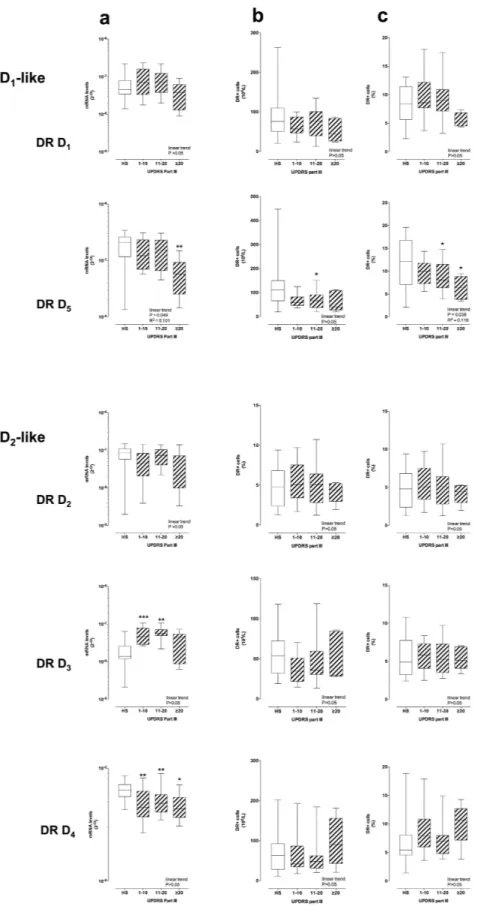
DR mRNA levels in CD4+ T cells showed extensive correlations with the UPDRS Part III score (Fig. 4a). The D1-like DR D5 mRNA levels decreased with increasing UPDRS Part III scores. Incomparison to CD4+ T cells from HS, in cells from PD patients DR D5 mRNA levels were lower in the > 20
UPDRS Part III score group. The D1-like DR D1 and the D2-like DR D2, D3 and D4 mRNA levels did not show
linear trends over the UPDRS Part III score, however DR D3 mRNA levels were higher than those in HS in the
1–10 and 11–20 UPDRS Part III score groups, while DR D4 mRNA levels were lower in all the UPDRS Part III
score groups (Fig. 4a). Some correlations were also observed between DR mRNA levels and H&Y stage, as DR D3 mRNA levels were higher than those in HS in the H&Y 1 and 2 stage groups, while DR D4 was lower in H&Y
stage 2 (see Supplementary Fig. S4).
Figure 3. DR expression on CD4+ T naive cells from HS and from PD patients. DR+ cells are shown as absolute numbers (panels a,b) and as percentage of total CD4+ cells (c,d). Data are shown as medians with 25°–75° percentiles (boxes) and min-max values (whiskers). Comparisons are shown between HS and PD patients as a whole (a,c) and between drug naive (PD-dn) and drug treated (PD-dt) patients (b,d). Differences were analyzed by means of two-tailed Student’s t test or by Mann-Whitney test, as appropriate. P values less than 0.05 are indicated in the graphs.
Figure 4. DR expression on CD4+ T cells and UPDRS-III score. DR expression is shown as mRNA levels (panel a) and as protein expression on the membranes of CD4+ T cells, expressed as absolute numbers of DR+ cells (b) and as percentage of total CD4+ T cells (c) Data are medians with 25°–75° percentiles (boxes) and min-max values (whiskers). Differences in DR expression between HS and PD patients were analyzed by parametric ANOVA or Kruskal-Wallis nonparametric ANOVA, as appropriate, with either Holm-Sidak’s or Dunn’s adjustments for multiple comparisons, where * = P < 0.05 and ** = P < 0.01. Trend analysis in PD patients was performed by ANOVA post test for linear trend.
Similar correlations with the UPDRS Part III score were observed for DR expression on CD4+ T cell mem-branes, in the case of DR D5 (Fig. 4b,c). Correlations with the H&Y stage included DR D5 expression lower than
that in HS in the H&Y 2 and 3 stage groups, and DR D3 expression lower than that in HS in the H&Y 3 stage
groups (see Supplementary Fig. S5).
D1-like DR D1 and D5 expression on cell membranes negatively correlated with the UPDRS Part III score
in CD4+ T naive cells, while D2-like DR D2, D3 and D4 didn’t show any major change (Fig. 5). On the
con-trary, D2-like DR D2 and D4 increased with the UPDRS Part III score in both CD4+ TCM and TEM cells, while
D1-like DR did not change either in TCM or TEM (Fig. 5 and Supplementary Fig. S6). Only minor correlations
were observed between DR expression and H&Y stage: D1-like DR D1 and D5 and D2-like DR D3 were reduced
in T naive from PD patients in comparison to cells from HS, and D2-like DR D2 were increased in TCM (see
Supplementary Fig. S7-S9).
No correlations were observed between DR mRNA levels and protein expression on CD4+ T cells or DR protein expression in CD4+ T naive and memory cells and age of HS or PD patients, or LED in PD-dt patients. However, in comparison to PD-dt patients treated with l-DOPA and dopamine agonists, those treated with l-DOPA alone had lower mRNA levels of DR D1 (6.0 ± 4.1 × 10⁻⁸ vs. 10.8 ± 5.4 × 10⁻⁸, P = 0.035),
D5 (9.7 ± 6.9 × 10⁻⁸ vs. 20.6 ± 7.5 × 10⁻⁸, P = 0.003), and D2 (6.0 ± 4.4 × 10⁻⁸ vs. 9.4 ± 3.3 × 10⁻⁸, P = 0.050),
as well as less percentage of CD4+ T cells which were DR D1+ (7.2 ± 2.5% vs. 10.3 ± 3.5%, P = 0.025) or DR D3+
(4.5 ± 1.5% vs. 6.4 ± 1.9%, P = 0.017), and of CD4+ T naive cells which were DR D3+ (3.5 ± 1.2% vs. 7.9 ± 4.6 &,
P = 0.009). Patients treated with l-DOPA alone had also higher UPDRS Part III score (19.0 ± 4.3 vs. 14.8 ± 5.0, P = 0.028) but similar H&Y stage (1.8 ± 0.7 vs. 1.8 ± 0.5, P = 0.933).
In vitro responses of CD4
+ T naive and memory cells to TTd and to α-syn.
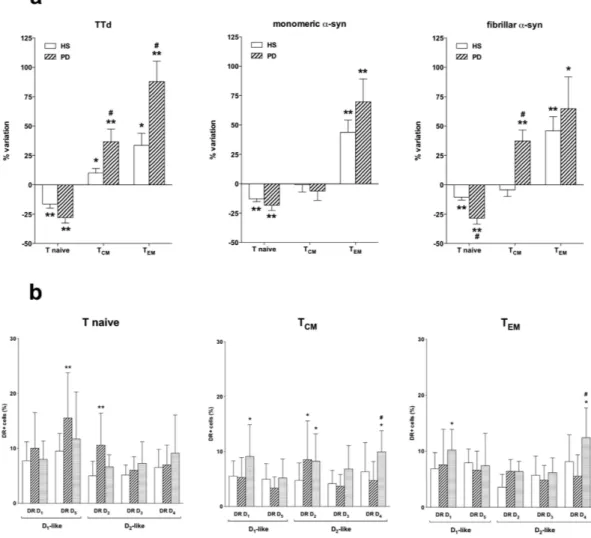
The effect of α -syn on the frequency of CD4+ T naive and memory cells was tested on PBMC obtained from a group of 8 HS (F/M = 4/4, age = 58.1 ± 14.5 years) and 6 PD patients (F/M = 2/4, age = 76.7 ± 7.0 years, UPDRS Part III = 20.5 ± 3.1, H&Y = 1.8 ± 0.8) all treated with l-DOPA without (n = 4) and with DA agents (n = 2, in both cases rasagiline, in one case also ropinirole), with LED = 551.7 ± 140.1 mg/day.Incubation of PBMC for 48 h with TTd resulted in reduced CD4+ T naive and increased TCM and TEM in both
HS and PD patients, however the increase in TCM and TEM was higher in PD patients (Fig. 6a, left). Incubation of
PBMC for 48 h with either monomeric or fibrillar α -syn resulted in reduced CD4+ T naive cells and increased TEM cells in both HS and PD, however in PD patients fibrillar α -syn also increased TCM and induced a more
pro-nounced reduction of T naive cells than in HS (Fig. 6a).
Both monomeric and fibrillar α -syn induced several changes in the expression of DR on CD4+ T naive and memory cells (Fig. 6b). In particular, monomeric α -syn increased DR D5 and D2 in T naive cells, and DR D2 in
TCM, while fibrillar α -syn increased DR D1, D2 and D4 in TCM and DR D1 and D4 in TEM.
Co-incubation of PBMC with either DA, the D1-like DR agonist SKF-38393, or the D2-like DR agonists
7-OH-DPAT and PD-168,077 did not affect the frequency of CD4+ T naive and memory cells (see Supplementary Table S3,). SKF-38393 (1 μ M) or the D2-like DR agonist pramipexole (1 μ M) did not modify the effects of
mono-meric and fibrillar α -syn in PBMC of either HS and of PD patients (data not shown).
Discussion
The main result of our study is the evidence supporting an extensive association between DR expression in T lymphocytes and motor dysfunction, as assessed by the UPDRS Part III score, which is commonly used to measure disease severity in the clinical setting35. Specifically, in total CD4+ T cells as well as in CD4+ T naive
cells the expression of D1-like DR D1 and D5 decrease with increasing UPDRS Part III score. On the contrary,
D2-like DR show changes only at the mRNA level in total CD4+ T cells, do not exhibit major changes in CD4+
T naive cells, but show a clear trend to increased expression with increasing UPDRS Part III score in TCM and
in TEM. This is the first study showing a connection between PD severity and DR expression on CD4+ T cells,
suggesting that dopaminergic pathways in peripheral immune cells are actively involved in PD. In addition, we provided preliminary evidence that α -syn might affect CD4+ T memory cells, possibly to a different extent in PD patients in comparison to HS.
Our results are in line with previous studies showing decreased CD4+ T lymphocytes in PD patients9,10, and
in particular with Saunders et al.12, who recently reported that in PD patients increased effector/memory CD4+
T cells correlated with increased motor dysfunction. In our study PD patients had decreased absolute count of CD4+ T naive cells, increased percentage of TEM cells, and TCM not different from those in HS. Indeed, our flow
cytometric strategy28 allowed to distinguish between T
CM, which mediate reactive memory by homing to T cell
areas of secondary lymphoid organs, and TEM, which afford protective memory, by migrating to inflamed
periph-eral tissues and displaying immediate effector function36,37. At apparent variance with the study by Saunders
et al.12, who reported that in PD patients effector/memory CD4+ T cells increased with the UPDRS Part III score,
we did not identify any clear correlation between T naive/memory cells and the UPDRS Part III score. Saunders et al.12 however identified T memory cells by using CD45RO expression, and found increased CD4+ T memory
cells only in PD patients with UPDRS Part III score ≥ 31, while in our study we enrolled only 7 patients with a score above 20, the highest score being 24, and nonetheless we identified increased TEM in PD patients, possibly
also thanks to the specific flow cytometry staining strategy which included the expression of CD45RA and CCR7, and allowed to distinguish between TEM and TCM28. It remains however to be established whether the enhanced
peripheral T memory function occurring in PD patients is mainly TEM, in line with the possibility that peripheral
immune activation in PD has at least in part a protective role.
Concerning the general peripheral immune profile, we also observed reduced CD4+ T naive cells with increasing age in HS but not in PD patients. Reduction of T naive cells in elderly subjects is well described and is believed to result from thymic involution in combination with ongoing differentiation of T naive cells into
Figure 5. DR expression in CD4+ T naïve, TCM and TEM and UPDRS-III score. DR expression is shown as protein expression on the membranes of CD4+ T naïve (left), TCM (center) and TEM (right) cells, expressed
as absolute numbers of DR+ cells. Data are medians with 25°–75° percentiles (boxes) and min-max values (whiskers). Differences between DR levels in HS and in PD patients were analyzed by parametric ANOVA or Kruskal-Wallis nonparametric ANOVA, with either Holm-Sidak’s or Dunn’s adjustments for multiple comparisons, where * = P < 0.05 and ** = P < 0.01. Trend analysis in PD patients was performed by ANOVA post test for linear trend.
antigen-experienced memory/effector cells34. In PD patients, the absence of correlations between T naive cell
count and age, together with the reduced number of T naive cells in comparison to HS, is indeed in agreement with the hypothesis that PD is associated with increased peripheral immune exposure to antigens. A contribution by dysregulated thymic T cells development cannot be discarded, however, also in view of the lack of studies on thymic function during PD.
Although many immune cell subsets are dysregulated in PD, the key role of CD4+ T cells in the pathogen-esis of the disease is supported by their presence, together with CD8+ T cells, in the brain in both postmortem human PD specimens and in the MPTP mouse model of PD, and evidence obtained in the animal model indicate that CD4+ T cells are determinants of T cell-mediated dopaminergic cell death11. Moreover, a recent study in
MPTP-treated mice showed that CD4+ T cells are necessary for MPTP-induced neurodegeneration and that D2-like DR D3 expressed on T cells favor their activation and acquisition of the Th1 inflammatory phenotype29.
Our results show that mRNA expression of several DR are dysregulated in CD4+ T cells from PD patients: in particular, in comparison to cells from HS, in cells from PD patients mRNA for the D1-like DR D5 and for
the D2-like DR D3 and D4 are decreased, and mRNA for the D2-like DR D3 is increased (Fig. 2a,b). Flow
cytom-etry analysis of DR expression on CD4+ T cell membranes provides however a more homogeneous picture (Fig. 2c–f), with D1-like DR D5 clearly reduced by 30–49% in cells from PD patients. Interestingly, reduction of
D1-like DR was evident for both DR D1 and D5 in CD4+ T naive cells (Fig. 3), while no difference occurred in TCM
or TEM cells (see Supplementary Fig. S1 and S2).
Little information is available on the physiopharmacology of D1-like DR-operated pathways in T cells. D1-like
DR D5 likely mediate the inhibitory effects of dopamine on proliferation and cytotoxycity of human CD4+ and
Figure 6. Effect of TTd, monomeric, and fibrillar α-syn on the frequency of CD4+ T naive and memory subsets. Panel (a) Effects of TTd (left), monomeric (middle), and fibrillar α -syn (right) in cells from HS (open columns) and PD patients (hatched columns). Data are expressed as percentage variation with respect to control conditions (without TTd or α -syn), and are means ± SEM of n = 6–8 separate experiments each performed in duplicate. * = P < 0.05 and ** = P < 0.01 vs. control conditions, and # = P < 0.01 vs. HS. Panel (b) monomeric (hatched columns), and fibrillar α -syn (shaded columns) on DR expression in T naive (left), TCM (center) and
TEM cells (right) from 5 HS. Data are means ± SEM. * = P < 0.05 and ** = P < 0.01 vs control (open columns);
CD8+ T cells38, however they also play a role in the inhibition of human CD4+ CD25high regulatory T cells, thus
resulting in a “suppression of the suppressors”23. Interestingly, in vitro in human naive CD4+ T cells, dopamine
via D1-like DR shifted T-cell differentiation towards Th2, in response to stimulation with anti-CD3 and anti-CD28
mAb24. Reduced D
1-like DR on CD4+ T cells in PD patients might thus lead to several effects, such as increased
CD4+ CD25high regulatory T cell function and increased Th1/Th2 balance. Saunders et al.12 however, reported
impaired function of CD4+ CD25high regulatory T cells from PD patients, thus suggesting that reduced D 1-like
DR may have no direct effects on this specialized cell subset. Indeed, our preliminary unpublished data from another protocol, included in this same research program and aimed at investigating DR expression on CD4+ T helper subsets, likely suggest that PD patients have a Th1-biased peripheral immune profile. This observation is in agreement with the previously reported increased ratios of IFN-γ -producing to IL-4-producing T cells in PD patients8, as well as with the role of D
1-like DR on human CD4+ T naive cells which, according to Nakano et al.24,
shift T-cell differentiation towards Th2. It can thus be suggested that reduced D1-like DR on CD4+ T naive cells
in PD patients impair their ability to differentiate towards Th2, promoting a Th1-biased proinflammatory profile. D1-like DR on CD4+ T lymphocytes, which are generally reduced in PD, also display a close correlation with
PD patients motor dysfunction, as assessed by the UPDRS Part III score. Indeed, DR D5 expression diminishes
with increased UPDRS Part III score, both at the mRNA level as well as in terms of percentage of CD4+ T cells which express the specific receptors (Fig. 4), a behavior which is evident also in CD4+ T naive cells, for both DR D1 and D5, but not in TCM of TEM (Fig. 5). By contrast, CD4+ TCM and TEM cells generally display a linear trend
towards increased D2-like DR (Fig. 5 and Supplementary Fig. S6). Such close association with the UPDRS Part III
score was not always parallel with the H&Y stage. In particular, in CD4+ T naive cells DR D1 and D5 decreased, and
in TCM and TEM DR D2 and D4 increased with increasing UPDRS Part III score (Fig. 5 and Supplementary Fig. S6)
but not with increasing H&Y scale stage (Supplementary Fig. S7–9). A likely explanation is that only one of the 7 subjects with UPDRS Part III > 20 is included among the 4 subjects with H&Y 2.5–3.0 (Table 2). Whether UPDRS Part III scale profiles the underlying immune dysfunction occurring in PD patients better than the H&Y scale remains to be established. Unfortunately, the only other study correlating CD4+ T cells and motor dysfunc-tion in PD considered just the UPDRS Part III score12.
PD patients with more severe motor dysfunction (score > 20) have TCM cells expressing 131–134% more DR
D2 and 112–126% more DR D4 than cells from HS, and 64–100% more DR D2 64–105% more DR D4 in
com-parison to cells from PD patients with score 1–10. The picture is similar with TEM, as PD patients with score > 20
have TEM cells expressing 93–112% more DR D2 and 48–71% more DR D4 than cells from HS, and 71–111% more
DR D2 and 22–38% more DR D4 in comparison to cells from PD patients with score 1–10. As a whole, it appears
therefore that, with increasing motor dysfunction, D1-like DR decrease on CD4+ T lymphocytes and in
particu-lar on CD4+ T naive cells, while D2-like DR, increase specifically on CD4+ TCM and also on TEM cells.
As discussed above, reduced D1-like DR on CD4+ T naive cells may promote a Th1-biased proinflammatory
profile, and the present results suggest that such trend increases with increasing motor dysfunction. There is on the contrary paucity of data regarding the role of D2-like DR on T lymphocytes, even if Levite et al.39 showed
that activation of either DR D2 or D3 might induce T cell proliferation and adhesion. Of potential relevance for
the present results, it was recently reported that, in the MPTP mouse model of PD, D2-like DR D3 expressed on
CD4+ T cells are critical for T cell-dependent microglial activation29. If the same applied to PD patients and to
D2-like DR-operated pathways as whole (as in PD patients DR D2 and D4, but not DR D3, correlated with motor
impairment), increased D2-like DR in the more advanced stages of the disease might imply increased activation of
the peripheral immune system, in turn triggering central neuroinflammation leading to neurodegeneration and disease progression. Nonetheless, such findings should be interpreted cautiously since studies also exist showing that at least stimulation of the D2-like DR D4 may result in quiescence of human T cells40. It is therefore necessary
to clarify the role of individual DR in the modulation of memory T lymphocytes and in their relationship with microglia in PD. In addition, the eventual role of antiparkinson treatments on DR expression on T lymphocytes needs careful consideration, as discussed hereafter.
Comparison between PD-dn and PD-dt patients did not reveal any major differences in the peripheral immune profile. In particular, absolute numbers of CD3+ and CD4+ T cells were not different, although per-centage CD3+ T cells were slightly higher in PD-dt patients while perper-centage CD4+ T cells were slightly higher in PD-dn patients (Table 4), and T naive, TCM and TEM were similar in the two patient populations (Fig. 1b,d). A
remarkable difference was however found in D1-like DR D1 expression in CD4+ T cells and in particular in T
naive cells (Figs 2,3), as PD-dt patients had higher expression of DR D1 in comparison to PD-dn. This difference
might be of interest as PD-dn patients have on their T naive cells only 22–35% DR D1 in comparison to HS T
naive cells, while PD-dt patients have on their T naive cells 41–63% DR D1 in comparison to HS T naive cells.
Whether this is an effect of dopaminergic antiparkinson treatments cannot be established on the basis of the present results, also taking into account that no relationship was found between PD duration and/or LED and the immune profile or DR expession in CD4+ T cells and cell subsets. The hypothesis should be nonetheless taken into account, since - as above discussed - D1-like DR on human CD4+ T naive cells may shift T-cell
differenti-ation towards Th224. Provided that this role of D
1-like DR on T naive cells has any clinical relevance, it might be
predicted that in the study which we are presently performing, aimed at investigating DR expression on CD4+ T helper subsets in PD patients, we will find less Th1 cells in PD-dt patients in comparison to PD-dn patients.
α -Syn is the major component of Lewy bodies and a key factor in PD pathogenesis. Pathological α -syn released by degenerating neurons activates microglia to a proinflammatory profile32, and directs cell migration41.
Efflux of α -syn from the brain to peripheral blood has been reported in mice and possibly in PD patients42, and
it has been hypothesized that it might prime T cells that, in turn, would enter the brain and sustain microglia activation and neurodegeneration43. It has also been suggested that the presence of aberrant forms of α -syn in the
periphery may represent a possible means for exposure as a neoantigen and subsequent activation of the adaptive immune system44.
In our study, we performed preliminary experiments aimed at assessing the effects of different forms of α -syn on CD4+ T naive and memory cells, in comparison to a well established recall antigen like TTd. We tested both monomeric and fibrillar α -syn since accelerated fibril formation by certain variants of α -syn are associated to PD pathogenesis45,46. As expected, TTd reduced the frequency of T naive cells while increasing T
CM and TEM. The
effect on TCM and TEM was however more pronounced in cells from PD patients, possibly in line with the activated
profile of peripheral immune system in PD. Interestingly, both monomeric and fibrillar α -syn induced a response which was qualitatively similar to the one evoked by TTd. Both PD patients and HS responded to the same extent to α -syn, with the only exception of fibrillar α -syn, which increased TCM cells in PD patients but not in HS.
Available evidence of course does not allow to conclude that the responses to α -syn are actually due to rec-ognition of the protein by T memory cells, although the response pattern is similar to that induced by TTd, and the ability of the peripheral immune system to recognize α -syn is also supported by the occurrence of specific antibodies in the serum of PD patients and HS47–49. Nonetheless, the ability of fibrillar α -syn to increase T
CM is
suggestive, as these cells mediate reactive memory, by homing to T cell areas of secondary lymphoid organs and readily proliferating and differentiating to effector cells upon antigenic stimulation36,37.
It is also remarkable that incubation with α -syn affected DR expression on CD4+ T cells, and that in par-ticular fibrillar α -syn induced increased expression of DR D4 in both TCM and TEM, a finding which resembles
increased D2-like DR in TCM and TEM of PD patients with more severe motor dysfunction. Whether increased
expression of DR corresponds to increased responsiveness, and which consequences might be implied for the pro/antiinflammatory balance of peripheral (and possibly also central) immunity need to be carefully considered.
Concluding remarks and perspectives.
It is noteworthy that in the present study we were unable to find any association between dopaminergic substitution treatments and the peripheral immune profile. Possible expla-nations include that l-DOPA may undergo conversion to dopamine only in the brain, and that dopaminergic receptor agonists are usually D2-like DR selective (pramipexole, ropinirole). Rotigotine is the only dopaminergicagonist currently used in PD that has comparable affinity for D2-like DR and at least for the D1-like D5, however
our study enrolled only four subjects on rotigotine (out of a total of 53). Our study included also a group of newly diagnosed PD patients who never received dopaminergic treatments. The main difference between newly diag-nosed and antiparkinson-treated subjects consisted in an even lower expression of D1-like DR D1 on total CD4+
T cells as well as in T naive cells in newly diagnosed patients, however it remains to be established whether the increased D1-like DR D1 expression in antiparkinson-treated patients is actually due to antiparkinson drugs and/
or to other factors. In order to clarify this issue, we have already started a longitudinal study on a larger sample of drug naïve PD patients, who will be tested before and after pharmacological treatment.
Anyway, from a general point of view it is possible to conclude that dopaminergic substitution treatments have only minor, if any, impact on the peripheral immune system of PD patients, which on the other side shows profound differences in comparison to that of HS. In particular, specific differences related to dopaminergic pathways in immune cells definitely support the notion of a chronic peripheral immune activation in PD patients, which may affect disease severity. Immunotherapy is being increasingly regarded as an attractive strategy even in PD44, and it is therefore a priority to unravel the peripheral immune dysregulation occurring in PD patients, to
plan adequate immunotherapeutic interventions. In addition, since antiparkinson therapy still lies mainly (if not only) on dopaminergic substitution therapy, detailed understanding of the role of dopaminergic pathways in the immune system might possibly allow a more appropriate use of available drugs, simply by better exploitation of their immunomodulating potential14–16,50.
Materials and Methods
Subjects.
Peripheral venous blood samples were collected from patients with idiopathic PD51, either drugnaive (PD-dn, i.e. PD patients who never received l-DOPA, DA agonists and/or other antiparkinson drugs) or on antiparkinson drug treatment (PD-dt), and from age- and sex-matched healthy subjects (HS). PD was diagnosed according to the United Kingdom Parkinson’s Disease Society Brain Bank Criteria. Patients and controls with a history of autoimmune or inflammatory disorders and those receiving chronic immunosuppressive treatment were excluded.
Participants were recruited through the Centre for Parkinson’s Disease and Movement Disorders of the Neurological Service at the Ospedale di Circolo of Varese, the Interdepartmental Research Center for Parkinson’s Disease of the Neurological Institute “C. Mondino” of Pavia, and the Movement Disorders Center of the University of Piemonte Orientale, Divisione di Neurologia, Ospedale Maggiore of Novara, Italy. Healthy subjects were spouses and caregivers of enrolled PD patients. The Ethics Committees of Ospedale di Circolo of Varese and Neurological Institute “C. Mondino” of Pavia approved the protocol and all the participants signed a written informed consent before enrollment. The study was performed according to the Declaration of Helsinki and to the relevant ethical guidelines for research on humans.
After enrollment, subjects were submitted to a complete examination. PD patients were staged according to the criteria of Hoehn and Yahr (H&Y)52 and evaluated by means of the Unified Parkinson’s Disease Rating Scale
(UPDRS) Part III53. UPDRS Part II score was also assessed whenever possible. Data on patients and healthy
con-trols were collected using standard data forms, which included demographics, diagnostic features, family history, primary diagnosis, PD features, UPDRS Part III score, and Hoehn and Yahr (H&Y) stage. Antiparkinson drug doses were recorded at the time of enrollment and l-DOPA equivalent doses (LED) were calculated according to established guidelines54.
Withdrawal of 30 ml venous blood was performed after a fasting night, between 8:00 a.m. and 10:00 a.m., in EDTA-coated tubes (BD Vacutainer). Tubes were subsequently coded and stored at room temperature until processing, which occurred within 24 hours after collection. Complete blood cell count with differential analysis was conducted on separate blood samples collected in EDTA-coated tubes (BD Vacutainer). Serum levels of
dopamine were assayed by high-performance liquid chromatography with multielectrode electrochemical detec-tion (HPLC-ED) according to a previously described method23.
Reagents.
Bovine serum albumin (BSA) and 4-(2-hydroxyethyl)-1-piperazineethanesulfonic acid (HEPES) were purchased from Sigma, Italy. RPMI 1640, heat-inactivated fetal bovine serum (FBS), glutamine, and penicillin/streptomycin were obtained from Euroclone, Italy. Ficoll-Paque Plus was from Pharmacia Biotech (Uppsala, Sweden). Purified mouse ab anti-human CD3 (code 555330, clone UCHT1, Mouse IgG1, κ ) and purified mouse ab anti-human CD28 (code 555726, clone CD28.2, Mouse IgG1, κ ) were obtained from Becton Dickinson, Italy. (± )SKF-38,393 hydrochloride (cod. D047), R(+)7-OH-DPAT hydrobromide (code H168), PD-168,077 maleate (code P233), pramipexol dihydrochloride (code A1237), and dopamine hydrochloride (code H8502) were all from Sigma, Italy. Human recombinant α -synuclein and its fibrillar form were a kind gift from Dr. Lars Kjær and Dr. Daniel Otzen (iNANO - Interdisciplinary Nanoscience Center, Aarhus University, Aarhus, Denmark), and were prepared as published before55.Flow cytometric analysis of naive and memory subsets of CD4+ T cells and of DR expression in
whole blood.
Analysis of CD4+ T naive and memory subsets and of DR expression was performed accord-ing to previously established method28. Briefly, 100 μ l aliquots of whole blood were prepared and erythrocyteswere removed by means of a lysis buffer ((g/L) NH4Cl 8.248, KHCO3 1.0, EDTA 0.0368). Samples were then centrifuged, supernatants were removed and cells were washed in PBS (pH 7.4) supplemented with 1% BSA (PBS/BSA) and resuspended in PBS/BSA. Total leukocytes were counted by means of a hemocytometer and cell viability, determined by the Trypan blue exclusion test, was always > 99%.
From each subject 7 aliquots of 100 μ L were prepared: 5 were used for DR staining, 1 was used as control for the secondary PE-goat anti-rabbit (PEGAR) ab, and 1 was used as negative control (no ab). The staining protocol consisted of two steps. During the first step each aliquot was stained for one of the five DR by an indirect labeling procedure (primary ab + secondary ab labeled with PE). During the second step all the aliquots were incubated with a cocktail of anti-human CD3, CD4, CD45RA and CCR7 ab for the identification of T lymphocytes, CD4+ T lymphocytes and the following CD4+ T lymphocyte subsets: naive (CD3+ CD4+ CD45RA+ CCR7+ ), central memory (TCM, CD3+ CD4+ CD45RA-CCR7+ ), and effector memory (TEM, CD3+ CD4+ CD45RA-CCR7-).
The complete list of ab used in the study is shown in Supplementary Table S1.
Acquisition was then performed on a BD FACSCanto II flow cytometer (Becton Dickinson, Milan, Italy) with BD FACSDiva software (version 6.1.3). Lymphocytes were identified by means of their classical forward scatter (FSC) and side scatter (SSC) signals and a minimum of 20,000 lymphocytes from each sample was collected in the gate. Data were analyzed with the FlowJo software (version 8.3.2). The results were finally expressed as absolute numbers (106/ml) as well as percentage of positive cells (%).
Isolation of peripheral blood mononuclear cells (PBMC).
PBMC were isolated from whole blood by using Ficoll-Paque Plus density gradient centrifugation. Cells were resuspended and, if necessary, any residual contaminating erythrocytes were lysed by addition of 5 mL of lysis buffer, followed by incubation for 5 min, dur-ing which samples were gently vortexed, and centrifugation at 100 g for 10 min at RT. Cells were washed twice in PBS by addition of 15 ml of PBS and centrifugation at 300 g and 10 min at RT, and resuspended at the final concentration of 10 × 106 cells in 10 ml of RPMI/10% FBS for subsequent culture. Typical PBMC preparationscontained at least 80% lymphocytes, as assessed by flow cytometry. Cell viability, assessed by the Trypan blue exclusion test was always > 99%.
Real-time PCR assay of DR mRNA in CD4+ T cells.
CD4+ T cells were isolated from PBMC by immu-nomagnetic sorting using Dynalbeads CD4 Positive Isolation kit (Life Technologies, code 11145D). Real-time PCR of DR mRNA was performed according to a previously reported method with modifications56. Briefly, toisolate RNA, at least 50000 CD4+ T cells were resuspended in PerfectPure RNA lysis buffer (5 Prime Gmbh, Hamburg, Germany), total RNA was extracted by PerfectPure RNA Cell KitTM (5 Prime Gmbh), and the amount
of extracted RNA was estimated by spectrophotometry at λ = 260 nm. Total mRNA obtained from CD4+ T cells was reverse-transcribed using a random primer, high-capacity cDNA RT kit (Applied Biosystems). cDNA was then amplified with SsoAdvanced
™
Universal Probes Supermix (BIORAD) for the analysis of DR D2, DR D3, andDR D5 gene expression, and with SsoAdvanced
™
Universal SYBR®
Green Supermix (BIORAD) for analysis of DRD1, and DR D4 gene expression. cDNA was assayed on StepOne
®
System (Applied Biosystems). Real-time PCRconditions are shown in Supplementary Table S2.
Linearity of real-time PCR assays were tested by constructing standard curves by use of serial 10-fold dilutions of a standard calibrator cDNA for each gene, and regression coefficients (r2) were always > 0.999; a melting curve
was also performed to check for specificity of DR D1 (melting temperature = 83.5 °C) and DR D4 (melting
temper-ature = 90 °C). Gene expression level in a given sample was represented as 2−ΔCt where Δ Ct = [Ct (sample) - Ct
(housekeeping gene)]. Relative expression was determined by normalization to 18 S cDNA. Analysis of the data were performed by StepOne software
™
2.2.2- Applied Biosystems).Frequency of CD4+ T naive and memory subsets in cultured PBMC.
Isolated PBMC were cultured in RPMI/10% FBS for 48 h at 37 °C in a moist atmosphere of 5% CO2, without or with anti-CD3/anti-CD28 ab(0.1 μ g/ml). Tetanus toxoid (TTd, 3 μ g/ml), monomeric or fibrillar α -syn (both 500 nM) were added at the begin-ning of cell culture. Cells were finally harvested and stained for flow cytometric analysis of naive and memory subsets of CD4+ T cells, as described in section regarding flow cytometric analysis of naive and memory subsets of CD4+ T cells.
Statistical analysis.
Distribution of the values was assessed by the D’Agostino & Pearson normality test. Statistical significance of the differences between HS and PD patients and between PD-dn and PD-dt patients was then analyzed by means of two-tailed Student’s t test or by the Mann-Whitney test, as appropriate, for con-tinuous variables, and by the Fisher’s exact test for categorical variables. Correlations among concon-tinuous variables were assessed by Pearson or Spearman correlation analysis. Differences between HS and PD patients categorized for UPDRS Part III score or H&Y stage were analyzed by ordinary one-way ANOVA or by the Kruskal-Wallis test, with either Holm-Sidak’s or Dunn’s adjustments for multiple comparisons, and trend analysis in PD patients was performed by ANOVA post test for linear trend. Calculations were performed using commercial software (GraphPad Prism version 5.00 for Windows, GraphPad Software, San Diego California USA, www.graphpad.com).References
1. Berg, D. et al. Time to redefine PD? Introductory statement of the MDS task force on the definition of Parkinson’s disease. Mov. Disord. 29, 454–462 (2014).
2. Obeso, J. A., Rodriguez-Oroz, M. C., Stamelou, M., Bhatia, K. P. & Burn, D. J. The expanding universe of disorders of the basal ganglia. Lancet. 384, 523–531 (2014).
3. Pringsheim, T., Jette, N., Frolkis, A. & Steeves, T. D. The prevalence of Parkinson’s disease: a systematic review and meta-analysis. Mov. Disord. 29, 1583–1590 (2014).
4. Cappellano, G. et al. Immunity and inflammation in neurodegenerative diseases. Am. J. Neurodegener. Dis. 2, 89–107 (2013) 5. Przedborski, S. Inflammation and Parkinson’s disease pathogenesis. Mov. Disord. 25, S55–57 (2010).
6. Mosley, R. L., Hutter-Saunders, J. A., Stone, D. K. & Gendelman, H. E. Inflammation and adaptive immunity in Parkinson’s disease. Cold. Spring. Harb. Perspect. Med. 2, a009381 (2012).
7. González, H., Elgueta, D., Montoya, A. & Pacheco, R. Neuroimmune regulation of microglial activity involved in neuroinflammation and neurodegenerative diseases. J. Neuroimmunol. 274, 1–13 (2014).
8. Baba, Y., Kuroiwa, A., Uitti, R. J., Wszolek, Z. K. & Yamada, T. Alterations of T-lymphocyte populations in Parkinson disease. Parkinsonism Relat. Disord. 11, 493–498 (2005).
9. Bas, J. et al. Lymphocyte populations in Parkinson’s disease and in rat models of parkinsonism. J Neuroimmunol. 113, 146–152 (2001).
10. Stevens, C. H. et al. Reduced T helper and B lymphocytes in Parkinson’s disease. J. Neuroimmunol. 252, 95–99 (2012).
11. Brochard, V. et al. Infiltration of CD4+ lymphocytes into the brain contributes to neurodegeneration in a mouse model of Parkinson disease. J. Clin. Invest. 119, 182–192 (2009).
12. Saunders, J. A. et al. CD4+ regulatory and effector/memory T cell subsets profile motor dysfunction in Parkinson’s disease. J. Neuroimmune Pharmacol. 7, 927–938 (2012).
13. Connolly, B.S. & Lang, A.E. Pharmacological treatment of Parkinson disease: a review. JAMA 311, 1670–1683 (2014). 14. Basu, S. & Dasgupta, P. S. Dopamine, a neurotransmitter, influences the immune system. J Neuroimmunol. 102, 113–124 (2000). 15. Sarkar, C., Basu, B., Chakroborty, D., Dasgupta, P. S. & Basu, S. The immunoregulatory role of dopamine: an update. Brain Behav.
Immun. 24, 525–528 (2010).
16. Levite, M. Dopamine in the immune system: dopamine receptors in immune cells, potent effects, endogenous production and involvement in immune and neuropsychiatric diseases. (ed. Levite, M.) In Nerve-driven-immunity – Neurotransmitters and neuropeptides in the immune system 1–45 (Springer-Verlag, 2012).
17. Cosentino, M. et al. Endogenous catecholamine synthesis, metabolism, storage and uptake in human neutrophils. Life Sci. 64, 975–981 (1999).
18. Marino, F. et al. Endogenous catecholamine synthesis, metabolism storage, and uptake in human peripheral blood mononuclear cells. Exp. Hematol. 27, 489–495 (1999).
19. Cosentino, M. et al. HPLC-ED measurement of endogenous catecholamines in human immune cells and hematopoietic cell lines. Life Sci. 68, 283–295 (2000).
20. Cosentino, M. et al. Stimulation with phytohaemagglutinin induces the synthesis of catecholamines in human peripheral blood mononuclear cells:role of protein kinase C and contribution of intracellular calcium. J. Neuroimmunol. 125, 125–133 (2002a). 21. Cosentino, M. et al. Catecholamine production and tyrosine hydroxylase expression in peripheral blood mononuclear cells from
multiple sclerosis patients: effect of cell stimulation and possible relevance for activation-induced apoptosis. J. Neuroimmunol. 133, 233–240 (2002b).
22. Cosentino, M. et al. Interferon-gamma and interferon-beta affect endogenous catecholamines in human peripheral blood mononuclear cells: implications for multiple sclerosis. J. Neuroimmunol. 162, 112–121 (2005).
23. Cosentino, M. et al. Human CD4+ CD25+ regulatory T cells selectively express tyrosine hydroxylase and contain endogenous catecholamines subserving an autocrine/paracrine inhibitory functional loop. Blood. 109, 632–642 (2007).
24. Nakano, K. et al. Dopamine released by dendritic cells polarizes Th2 differentiation. Int. Immunol. 21, 645–654 (2009).
25. Schetz, J. A. Dopamine receptors, introduction. IUPHAR/BPS Guide to PHARMACOLOGY Aviable at: http://www. guidetopharmacology.org/GRAC/FamilyIntroductionForward? familyId= 20. (Accessed on 31/01/2014) (2009).
26. Beaulieu, J. M. & Gainetdinov, R. R. The physiology, signalling, and pharmacology of dopamine receptors. Pharmacol. Rev. 63, 182–217 (2011).
27. Brito-Melo, G. E. et al. Increase in dopaminergic, but not serotoninergic, receptors in T-cells as a marker for schizophrenia severity. J. Psychiatr. Res. 46, 738–742 (2012).
28. Kustrimovic, N., Rasini, E., Legnaro, M., Marino, F. & Cosentino, M. Expression of dopaminergic receptors on human CD4+ T lymphocytes: flow cytometric analysis of naive and memory subsets and relevance for the neuroimmunology of neurodegenerative disease. J. Neuroimmune Pharmacol. 9, 302–312 (2014).
29. González, H. et al. Dopamine receptor D3 expressed on CD4+ T cells favors neurodegeneration of dopaminergic neurons during Parkinson’s disease. J. Immunol. 190, 5048–5056 (2013).
30. Harms, A. S. et al. MHCII is required for α -synuclein-induced activation of microglia, CD4 T cell proliferation, and dopaminergic neurodegeneration. J. Neurosci. 33, 9592–9600 (2013).
31. Reynolds, A. D., Stone, D. K., Mosley, R. L. & Gendelman, H. E. Nitrated {alpha}-synuclein-induced alterations in microglial immunity are regulated by CD4+ T cell subsets. J. Immunol. 182, 4137–4149 (2009).
32. Sanchez-Guajardo, V., Tentillier, N. & Romero-Ramos, M. The relation between α -synuclein and microglia in Parkinson’s disease: Recent developments. Neuroscience. 302, 47–58 (2015).
33. Linton, P. J. & Dorshkind, K. Age-related changes in lymphocyte development and function. Nat. Immunol. 5, 133–139 (2004). 34. Lazuardi, L. et al. Age-related loss of naïve T cells and dysregulation of T-cell/B-cell interactions in human lymph nodes.
Immunology. 114, 37–43 (2005).
35. Leddy, A. L., Crowner, B. E. & Earhart, G. M. Functional gait assessment and balance evaluation system test: reliability, validity, sensitivity, and specificity for identifying individuals with Parkinson disease who fall. Phys. Ther. 91, 102–113 (2011).
36. Lanzavecchia, A. & Sallusto, F. Dynamics of T lymphocyte responses: intermediates, effectors, and memory cells. Science. 290, 92–97 (2000).
37. Sallusto, F., Geginat, J. & Lanzavecchia, A. Central memory and effector memory T cell subsets: function, generation, and maintenance. Annu. Rev. Immunol. 22, 745–763 (2004).
38. Saha, B., Mondal, A. C., Basu, S. & Dasgupta, P. S. Circulating dopamine level, in lung carcinoma patients, inhibits proliferation and cytotoxicity of CD4+ and CD8+ T cells by D1 dopamine receptors: an in vitro analysis. Int. Immunopharmacol. 1, 1363–1374 (2001).
39. Levite, M. et al. Dopamine interacts directly with its D3 and D2 receptors on normal human T cells, and activates β -integrin function. Eur. J. Immunol. 31, 3504–3512 (2001).
40. Sarkar, C. et al. Cutting Edge: Stimulation of dopamine D4 receptors induce T cell quiescence by up-regulating Kruppel-like factor-2 expression through inhibition of ERK1/ERK2 phosphorylation. J. Immunol. 177, 7525–7529 (2006).
41. Wang, S. et al. α -Synuclein, a chemoattractant, directs microglial migration via H2O2-dependent Lyn phosphorylation. Proc. Natl. Acad. Sci. USA 112, E1926–1935 (2015).
42. Shi, M. et al. Plasma exosomal α -synuclein is likely CNS-derived and increased in Parkinson’s disease. Acta Neuropathol. 128, 639–650 (2014).
43. Appel. S. H., Beers, D. R. & Henkel, J. S. T cell-microglial dialogue in Parkinson’s disease and amyotrophic lateral sclerosis: are we listening? Trends Immunol. 31, 7–17 (2010).
44. Hutter-Saunders, J. A., Mosley, R. L. & Gendelman, H. E. Pathways towards an effective immunotherapy for Parkinson’s disease. Expert. Rev. Neurother. 11, 1703–1715 (2011).
45. Conway, K. A., Harper, J. D. & Lansbury, P. T. Accelerated in vitro fibril formation by a mutant α -synuclein linked to early-onset Parkinson disease. Nat. Med. 4, 1318–1320 (1998).
46. Narhi, L. et al. Both familial Parkinson’s disease mutations accelerate α -synuclein aggregation. J. Biol. Chem. 274, 9843–9846 (1999). 47. Yanamandra, K. et al. α -Synuclein Reactive Antibodies as Diagnostic Biomarkers in Blood Sera of Parkinson’s Disease Patients.
PLOS. 6, 18513 (2011).
48. Smith, L. M., Schiess, M. C., Coffey, M. P., Klaver, A. C. & Loeffler, D. A. α -Synuclein and anti-α -synuclein antibodies in Parkinson’s disease, atypical Parkinson syndromes, REM sleep behavior disorder, and healthy controls. PLoS One. 7, e52285 (2012).
49. Besong-Agbo, D. et al. Naturally occurring α -synuclein autoantibody levels are lower in patients with Parkinson disease. Neurology.
80, 169–75 (2013).
50. Cosentino, M. & Marino, F. Adrenergic and dopaminergic modulation of immunity in multiple sclerosis: teaching old drugs new tricks? J. Neuroimmune Pharmacol. 8, 163–179 (2013).
51. Gelb, D. J., Oliver, E. & Gilman, S. Diagnostic criteria for Parkinson disease. Arch. Neurol. 56, 33–39 (1999).
52. Goetz, C. G. et al. Movement Disorder Society Task Force on Rating Scales for Parkinson’s Disease. Movement Disorder Society Task Force report on the Hoehn and Yahr staging scale: status and recommendations. Mov. Disord. 19, 1020–1028 (2004).
53. Goetz, C. G. et al. Movement Disorder Society-Sponsored Revision of the Unifed Parkinson’s Disease Rating Scale (MDS-UPDRS): Scale Presentation and Clinimetric Testing Results. Mov. Disord. 23, 2129–2170 (2008).
54. Tomlinson, C. L. et al. Systematic review of levodopa dose equivalency reporting in Parkinson’s disease. Mov. Disord. 25, 2649–2653 (2010).
55. Nielsen, S. B. et al. Wild type and A30P mutant alpha-synuclein form different fibril structures. PloS one. 8, e67713 (2013). 56. Cosentino, M. et al. Dopaminergic modulation of CD4+ CD25(high) regulatory T lymphocytes in multiple sclerosis patients during
interferon-β therapy. Neuroimmunomodulation. 19, 283–292 (2012).
Acknowledgements
This study was supported by a grant from Fondazione CARIPLO to Marco Cosentino (Project 2011-0504: Dopaminergic modulation of CD4+ T lymphocytes: relevance for neurodegeneration and neuroprotection in Parkinson’s disease - The dopaminergic neuro-immune connection). Natasa Kustrimovic has a postdoc fellow appointment supported by the grant. Iva Aleksic is developing a research program on the dopaminergic modulation of CD4+ T lymphocytes as part of her work for the PhD Course in Clinical and Experimental Medicine and Medical Humanities, University of Insubria (XXX Cycle). Human recombinant α -synuclein and its fibrillar form were a kind gift from Dr. Lars Kjær and Dr. Daniel Otzen (Interdisciplinary Nanoscience Center (iNANO), Aarhus University (DK). The collaboration of Dr. Fabiola DeMarchi, Dr. Luca Magistrelli, Dr. Gaia Oggioni (Movement Disorders Centre, Neurology Unit, Department of Translational Medicine, University of Piemonte Orientale, Novara), Dr. Francesca Siani, Dr. Claudio Pacchetti, Dr. Roberta Zangaglia, Ms. Cristina Ghezzi, Ms. Luciana Gracardi (Center for Research in Neurodegenerative Diseases, “C. Mondino”, National Neurological Institute, Pavia), Dr. Giulio Riboldazzi, Dr. Gaia Oggioni (Department of Biotechnology and Life Sciences, University of Insubria, Varese) in the selection and recruitment of patients and healthy subjects and in blood sampling and processing is gratefully acknowledged. The authors wish to express their gratefulness to Dr. Alessandra Luini (Center for Research in Medical Pharmacology, University of Insubria) for her skillful technical collaboration, and to Ms. Paola Gervasini (Center for Research in Medical Pharmacology, University of Insubria) for her valuable collaboration in the administrative management and reporting of the grant.
Author Contributions
Study conception and design: M.C., F.M. and F.B. Acquisition of data: N.K., E.R., M.L., R.B., I.A., B.M. and G.R. Analysis and interpretation of data: N.K., M.C., F.B., C.C., M.M., V.S.-G. and F.M. All authors were involved in drafting the article or revising it critically for important intellectual content, and all authors approved the final version to be published. All authors agree to be accountable for all aspects of the work in ensuring that questions related to the accuracy or integrity of any part of the work are appropriately investigated and resolved, and declare to have confidence in the integrity of the contributions of their co-authors.
Additional Information
Supplementary information accompanies this paper at http://www.nature.com/srep Competing financial interests: The authors declare no competing financial interests.
How to cite this article: Kustrimovic, N. et al. Dopaminergic Receptors on CD4+ T Naive and Memory Lymphocytes Correlate with Motor Impairment in Patients with Parkinson's Disease. Sci. Rep. 6, 33738; doi: 10.1038/srep33738 (2016).
This work is licensed under a Creative Commons Attribution 4.0 International License. The images or other third party material in this article are included in the article’s Creative Commons license, unless indicated otherwise in the credit line; if the material is not included under the Creative Commons license, users will need to obtain permission from the license holder to reproduce the material. To view a copy of this license, visit http://creativecommons.org/licenses/by/4.0/