Received May 11, 2019, accepted May 22, 2019, date of publication May 27, 2019, date of current version June 11, 2019.
Digital Object Identifier 10.1109/ACCESS.2019.2919000
Full-SAW Microfluidics-Based
Lab-on-a-Chip for Biosensing
MATTEO AGOSTINI, GINA GRECO, AND MARCO CECCHINILaboratorio NEST, Istituto Nanoscienze-CNR and Scuola Normale Superiore, 56127 Pisa, Italy Corresponding author: Marco Cecchini ([email protected])
This work was supported by the PAR FAS 2007-2013 ‘‘GLIOMICS’’ of ‘‘Regione Toscana.’’ Proteomics/genomics/metabolomics for the biomarkers identification and the development of an ultrasensitive sensing platform to be used with peripheral fluids for glioblastoma multiforme cancer.
ABSTRACT Many approaches to diagnostic testing remain decades old. Well-established biosensing
technologies (e.g., enzyme-linked immunosorbent assays and radio-immunoassays) typically cannot fulfill the requirements of portability and ease of use necessary for point-of-care purposes. Several alternatives have been proposed (e.g., quartz-crystal-microbalances, electrochemical sensors, cantilevers, and surface-plasmon-resonance sensors) but often lack high performance or still necessitate bulk ancillary instruments to operate. Here we present a highly sensitive, versatile, and easily integrable microfluidic lab-on-a-chip (LoC) for biosensing, fully based on surface acoustic waves (SAWs). By using ultra-high-frequency resonator-biosensors, we show that it is possible to perform highly sensitive assays in complex media. This all-electrical readout platform is benchmarked with the biotin-streptavidin binding in presence of non-specific binding proteins (serum albumin) at physiological concentration. The benchmark experiments were performed with the idea of mimicking a biological fluid, in which other molecular species at high concentration are present together with the analytes. We demonstrate that this LoC can detect sub-nanomolar concentrations of analytes in complex media. As a comparison with similar acoustic-wave-based systems, this full-SAW platform outperforms the standard commercial gravimetric sensors (i.e., quartz-crystal-microbalances) and the more common Love-SAW biosensors. This full-SAW LoC could be further developed for the detection of biomarkers in biological fluids.
INDEX TERMS Biosensors, lab-on-a-chip (LoC), microfluidics, surface acoustic wave (SAW).
I. INTRODUCTION
In 2016 over half of the total deaths worldwide were due to the top ten causes of mortality, as stated by the World Health Organization [1]. Ischemic heart disease, cancer, neurodegen-erative diseases and diabetes are particularly prominent, also in developing countries. Effective diagnosis is hindered by the slow turnaround of current diagnostic techniques. Further-more, poor sensitivity allows for disease detection only at the advanced stages of the pathologies, where they are difficult to treat [2]. In the last decades, portable biosensing systems have been proposed for the detection of biomarkers related to these pathologies [3]. Automated, cheap, and portable devices that can help in diagnostic testing would be a breakthrough in the biomedical field, particularly for point-of-care (PoC) pur-poses. These devices are the so-called lab-on-a-chips (LoCs).
The associate editor coordinating the review of this manuscript and approving it for publication was Sanket Goel.
LoCs are chips with a small surface (mm2–cm2) that embed many operations that are usually performed by trained personnel in a centralized laboratory facility. These opera-tions include centrifugation, reagent mixing, heating, par-ticle separation, cell counting, analyte detection, amongst many others, as described in Sackmann’s review [4] and references within. The reduced area where these operations take place combined with a high automation, often pro-vided by microfluidic networks, makes the LoCs potentially scalable, cheap, portable, robust, and easy to operate by non-specialized personnel [5], [6]. One of the preferential imple-mentations of LoCs, which benefits from all the mentioned advantages, is the biosensing analysis (i.e., detection of spe-cific analytes in biological media). The analytes (e.g., pro-teins, carbohydrates, nucleic acids, also referred to as targets or biomarkers) are selectively bound by a probe molecule, which, in turn, is generally immobilized on the biosensor surface. The analytes found in body fluids (e.g., blood, urine, 2169-3536 2019 IEEE. Translations and content mining are permitted for academic research only.
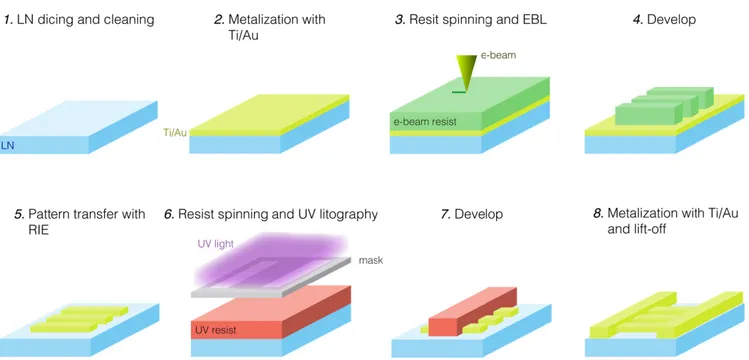
FIGURE 1. Fabrication process of the LoC. Steps 1 to 5 are the resonators and IDTs fabrication, while steps 6 to 8 are the WG fabrication. The last removal of the Ti adhesion layer with diluted HF is not here shown for clarity of visualization.
saliva) coexist with other species in solution that can mask the biomarkers. For example, human serum albumin (HSA) is present in concentrations millions to billions time higher than cancer or stroke biomarkers in blood, plasma or serum [7], and can act as bionoise. Bionoise can raise the positive false rate and decrease the diagnostic tests reliability [8]. Thus, an ideal biosensor should be sensitive and specific enough to detect small amounts of the target molecule in a ‘‘sea’’ of non-specific binding molecules. The capability of a device to detect fM–nM levels of analytes associated with a particular pathology is a key factor for early-detection and PoC strategies. With the aim of integrating such a sen-sitive and specific biosensor in a LoC, several techniques have been proposed. Surface plasmon resonance (SPR), bulk acoustic wave (BAW), surface acoustic wave (SAW), among all [9]. Typically, optics-based techniques, such as SPR, are characterized by high detection performance but necessitate the use of bulky ancillary instruments (e.g., lasers, optical devices) [10], [11]. On the other hand, BAW devices like quartz-crystal-microbalances (QCMs) can be more portable, owing to their all-electrical readout, but suffer from lower performance [12], [13]. In our previous work [14], we demon-strated an ultrasensitive SAW-resonator biosensor, fully-electrical, small and easily integrable with other systems. In fact, amongst the demonstrated techniques, SAWs are the only technology able to efficiently perform both biosensing and fluid-manipulation tasks. Fluid motion, mixing, droplet displacement, and atomization are all feasible with this tech-nology [15]–[18], down to the nanoliter-scale [19], [20]. The compatibility of SAWs with cells has also been stud-ied [21]–[23], as well as their enhancement of molecules binding to surfaces [24]–[26]. These SAW-based devices
are fabricated by standard micro- and nano-fabrication tech-niques. Microchannels are made of plastic or elastomeric materials by replica molding, while the SAWs are gener-ated by a comb-like metal structure called interdigital trans-ducer (IDT), which is patterned onto a piezoelectric substrate. In this light, SAW-based devices are a promising solution for LoC development, being capable of performing both biosens-ing and microfluidics operations on a sbiosens-ingle chip which can also be battery-operated and wirelessly-addressable [27].
Here, we show a full-SAW LoC for biosensing applica-tions with an all-electrical readout. Owing to the presence of four SAW-resonator biosensors, and a microfluidic net-work, this device is suitable for multiplexed measurements. We show the capability of this fully-electrical LoC to detect sub-nanomolar levels of biomolecules in presence of bionoise at physiological level.
II. MATERIALS AND METHODS
All the materials were purchased from Sigma-Aldrich if not otherwise stated.
A. LAB-ON-A-CHIP FABRICATION
The LoC fabrication process is depicted in Fig. 1. The process consists of SAW-resonator (steps 1–5) and waveg-uide (WG) (steps 6–8) fabrication. Step 1 is 128◦X-rotated Y-cut lithium niobate (LN) wafers (Roditi International Ltd.) dicing in single substrates (2 cm × 2 cm), and cleaning in acetone (ACE), isopropanol (IPA) and O2 plasma (Diener
Femto, Germany) at 100 W for 5 min. For the fabrication of resonators and alignment markers, the substrates were metallized in a thermal evaporator (Kurt J. Lesker, Nano 32) with 15 nm of Ti as an adhesion layer and 150 nm of Au.
M. Agostini et al.: Full-SAW Microfluidics-Based LoC for Biosensing
AR-300-80 (ALLRESIST GmbH) adhesion promoter was spun onto the metallized substrates at 4000 rpm for 1 min, and baked at 110 ◦C for 5.5 min. Negative electron-beam resist (ma-N 2403, MicroChem GmbH) was then spun at
3000 rpm for 1 min and baked at 90 ◦C for 1 min. The
coated substrates subsequently underwent to electron beam lithography (EBL) in a modified scanning electron micro-scope (SEM) (UltraPlus, Zeiss, with Raith GmbH lithography system), step 3, with an average area dose of 20 µC/cm2. The resonators geometry is described in details in [14]: the designed resonance frequency of the device was ∼1.2 GHz,
corresponding to a SAW wavelength of 3.2µm. The IDTs
for recirculation were conventional 15 finger-pairs, single-fingers, 50% metallization ratio, generating a ∼50 MHz
SAW (80 µm wavelength). The substrates were developed
(ma-D 525 MicroChem GmbH) for 1 min and stopped in deionized (DI) water. Next, Au was etched–the e-beam resist acted as mask–with Ar sputtering for 9 min at 3.96 mBar, using a reactive ion etching (RIE) machine (RIE Sistec, Perugia, Italy). The resist was then stripped by ACE, IPA
and O2 plasma cleaning (100 W, 5 min). Next, the WG
was realized by ultraviolet (UV) lithography and lift-off process: positive optical resist with lift-off resist under-neath (S1813 and LOR3A MicroChem GmbH) were spun at 4000 rpm and baked at 90 ◦C for 1 min and 110◦C for 5 min, respectively, step 6. The resist bilayer was exposed in a UV lithography machine (MJB4 Suss Microtech) with a dose of 66 mJ/cm2, then developed for 1 min (MF319 Microposit) and stopped in DI-water. The substrates were metalized with Ti/Au 15/150 nm and put in ACE at 50 ◦C
for 1.5 h for the lift-off process. After having carefully removed the resist and metal residuals by gently fluxing ACE with a syringe, the remaining Ti layer was finally etched in HF:H2O (1:80) solution for 40 s. The fabricated LoC was then
mounted on a printed circuit board (PCB), wire bonded, and finally the polydimethyl siloxane (PDMS) (Sylgard R 184) microchannel was attached on its surface. Microchannels were fabricated in PDMS by standard soft-lithography and then covalently bonded on the chip. Molds were made in UV-exposed negative photoresist (SU8-2100, MicroChem), 350 µm thick, on silicon wafers. The LN substrate and the PDMS surface were attached by activating the surfaces with O2plasma (40 W for 1 min), aligned using an optical
micro-scope, and finally baked for at least 1.5 h at 60 ◦C in a convection oven.
B. MOLECULES AND PROTOCOLS
The proteins used were streptavidin (SA) (NANOCS) 290 pM, close to the limit-of-detection (LoD) of [14] and bovine serum albumin (BSA) 0.56 mM, close to the HSA con-centration in physiological condition. Both were dissolved in phosphate buffer saline (PBS 1x). For the functionaliza-tion, a biotin-PEG2k-SH (bPEG) (NANOCS) probe molecule
at 2 mg/mL in H2O:ETOH (10:1) was used. The solution
used for the biosensing experiments were SA (290 pM) and BSA (0.56 mM) in PBS, called SA + BSA solution;
BSA (0.56 mM) in PBS, called BSA; and the bPEG probe. During the biosensing experiments the reference resonator was never exposed to any solution, since it was used for correcting frequency oscillations stemming from environ-mental variations. Incubation times were 18 h for bPEG, and >1.5 h for the SA and BSA solutions. After the biomolecule incubation, DI-water was allowed to thoroughly wash the resonators, which was then let dry in nitrogen-saturated air. For the biosensing experiment the IDTs for mixing were not used. The error on the frequency shift was evaluated by calculating the standard deviation of several (>3) subsequent washings with DI-water. Statistical tests were performed in the form of multiple t-tests with Welch’s correction for non-equal standard deviations (SDs). The significance threshold was the standard P< 0.05. In order to inject the fluids inside the LoC, a microfluidic pump (MFCS, Fluigent) was used. The pump was connected to the LoC by PEEK R tubing and operated at ∼60 mbar.
III. RESULTS AND DISCUSSION A. FULL-SAW LAB-ON-A-CHIP DESIGN
Microfluidics, multiplexing and automation are the paradigms of our design. Fig. 2 shows the LoC layout and a photo of a fabricated device. As schematized in Fig. 2A and 2B, the LoC can be described by the combination of four levels (bottom-up): substrate, waveguide, resonators and mixing IDTs, microfluidic layer. The substrate and the single res-onator design were the same as the ones presented in our previous work [14], where we demonstrated the capability of these resonator-biosensors to detect sub-nanomolar (104 pM LoD) concentration of biomolecules. Including this work, the molecules successfully detected with these resonator-biosensors are: bPEG, SA and BSA. The resonance frequency of these resonator-biosensors depends on the surface mass-density. Thus, upon molecules binding on the resonator surface, a resonance frequency red-shift is observed which correlates with the number of bound molecules. Starting from the bottom layer of Fig. 2A, the substrate was an LN crystal, on top of which a coplanar WG was designed to have 50 resistance for impedance matching. The third layer contained the resonators and IDTs for mixing. Four 2-port SAW resonators with positive and negative reflec-tors (PNRs) (∼1.2 GHz) and two bidirectional single-finger IDTs (∼50 MHz) were patterned and individually con-nected to the WG. Lastly, the topmost layer was the PDMS microchannel: it comprised four independent microcham-bers with inlets-outlets for liquid sample handling and two air-filled microchambers on top of the IDTs for avoiding SAW damping. The device was finally mounted and wire-bonded on a PCB. This LoC was designed such that four multiplexed measurements were feasible–one for each sensor and microchamber–while liquid mixing could be realized by activating the two low-frequency IDTs. Referring to Fig. 2B, the IDT-W/E could launch a 50 MHz travelling SAW for mix-ing towards the NW/SW and NE/SE resonator-biosensors. These resonators were individually connected to the WG
FIGURE 2. Full-SAW LoC. A) Exploded illustration of the biochip. From the bottom to the top layer: LN substrate, 50 matched WG, resonator-sensors and mixing IDTs, PDMS microfluidic channel. The PDMS microchannel is sealed at the top side; the sealing is here removed for clarity of visualization. B) The four resonators (green rectangles) are identified by NW-NE-SE-SW labels, and connected to the electric signal (red) and ground (white). The two IDTs (W and E) send a 50 MHz SAW towards two microchambers respectively (black arrows). The liquid-filled and air-filled microchambers contours are represented by the blue dashed lines. Scale bar is 2.5 mm. C) Photo of a mounted LoC.
and functionalized by means of the non-communicating microchambers.
B. ACQUISITION AND DATA-ANALYSIS ALGORITHMS Multiplexed measurements can lead to important advantages in terms of noise reduction, drift correction and molecular detection accuracy. A large dataset, obtained with fast auto-matic acquisition, provides more information with respect to what is achievable by manual operations. With this aim, the spectra were collected and further processed by means of a custom-made LabView R software. Fig. 3 reports the exper-imental setup and software algorithms. The device under test (DUT) was connected to a 2-port vectorial network ana-lyzer (VNA) (Agilent Technologies, E5071C); each port was used for collecting the reflected radiofrequency (RF) power spectrum of one sensor. Therefore, two sensors were mea-sured at a time. The VNA communicated with the LabView R
custom software through Ethernet, for acquisition timing and further data processing. The acquisition started with the user input by means of a graphic user interface (GUI) (here not shown) for setting the acquisition parameters. For every resonator the most important parameters were: time interval between every acquisition (1t), number of points in frequency, spectrum intermediate frequency band-width (IF-BW), frequency center and span, resonator name, saving folder. Next, once the acquisition was started, the soft-ware looped with a1t interval (3–5 s, if not otherwise stated), repeating spectrum collection and saving (with timestamp). This loop ended if a preset stop-time was selected, or if the stop button was manually pressed on the GUI. The acqui-sitions were performed upon drying after the biomolecule incubation and DI-water washings. Contemporary to the acquisition, the user could analyze the acquired data. First, a spectrum was chosen as representative of every other spec-trum of the resonator (‘‘zero specspec-trum’’) to tune the smooth-ing and peak findsmooth-ing procedures. Here, the smoothsmooth-ing was
TABLE 1.Parameters for acquisition and data processing.
performed with a build-in Savitzky-Golay (S-G) method, with ‘‘side points’’ and ‘‘polynomial order’’ as parameters to be set. Second, the user was required to insert other experimental parameters as the reference correction factor (kR, explained below) and frequency span. Finally, all the
acquired spectra were processed with the same parameters (i.e., smoothing and peak finding were performed) and the sensorgrams were produced. Table 1 reports the fundamental parameters for the acquisition and data processing that were used for the biosensing experiments here reported.
The experiments were carried out using two resonators in parallel: one used as reference and the other as sensor. The resonance frequency shift (1f) of paired reference-sensor resonators, upon the same stimulus, must be proportional in order to correctly reduce noise and drift. With this purpose, 1f of two resonators was monitored in two cases: upon device heating with an external heat source and during long-lasting measurements. The measurements were performed in air. The temperature reached by heating was approximately 10 ◦C above the environmental temperature, and was measured with an infrared camera (FLIR). The most sensitive resonator–the
M. Agostini et al.: Full-SAW Microfluidics-Based LoC for Biosensing
FIGURE 3. Experimental setup and algorithms. A) Scheme of the experimental setup: The DUT is measured by a VNA acquiring two RF reflected power spectra (S11 and S22), one per sensor. The VNA communicates with a LabView Rcustom-made software for spectra acquisition and data analysis (i.e., smoothing, peak finding, error evaluation). B) LabView custom software workflow. The acquisition starts with the user input of the initial parameters. Next, the software loops with 1t interval, repeating spectra collection and saving. The data analysis is comprised of three steps. First, a spectrum is chosen as the representative of every other spectrum of the resonator (‘‘zero spectrum’’), in order to tune the smoothing and peak finding procedures. Second, the user is required to insert other experimental parameters and lastly the spectra are processed and the sensorgrams produced.
one that showed the largest1f–was chosen as the reference and the other resonator as the sensor to be functionalized. This choice was made for being as much conservative as possible in estimating the LoC detection capabilities. Then, the reference1f was multiplied by a correction factor (kR) in
order to match the sensor shift. More precisely, let S(t) and R(t) be the1f(t) of the sensor and the reference, respectively. The differential signal of the sensor-reference pair [D(t)] is expressed as:
D(t) = S(t) − R∗(t). (1)
In (1), R∗is the corrected value of R, given by:
R∗= ˆkRR, (2)
where ˆkRis the optimum correction-factor of the reference.
As previously stated, the reference resonator was the most sensitive of the pair, therefore 0< ˆkR ≤ 1. ˆkR was
calcu-lated by minimizing the standard deviation of D (SDD) as a
function of kRin the two cases mentioned above (i.e., heating
and long-lasting measurements), as shown in Fig. 4. The SDD
FIGURE 4. Reference and sensor pairing. A1) Shows the resonance shifts of the sensor, reference, and differential for long-time measurements. A2) Reports the SDDas a function of kR. The curve has an absolute minimum at the optimum kR. Similarly, B1) and B2) report the same analysis for the heating case. More precisely, only the cooling down portion of the curve was used for the shift correction, in order to avoid fast signal shifts. Remarkably, in both cases optimum kRis ∼0.5, which reflects the stability of the device and the analysis reproducibility. The value for the optimum kRlays in the 0–1 window (light-blue areas), owing to the conservative choice of using the most sensitive resonator as reference.
C. BIOSENSING EXPERIMENTS
With the aim of evaluating the LoC performance while mim-icking a biological sample, we performed a set of experiments in presence of bionoise. Bionoise was provided by adding a physiological concentration of BSA to the clean buffer. The BSA-containing solutions were used as simplified models for different patient cases in the context of a medical diag-nostic tests. SA + BSA represented serum with biomarkers dissolved, while BSA represented serum without biomarkers. After the sensor-reference coupling previously described, the first biosensing experiment was performed with the aim to evaluate the shift caused by the BSA non-specific binding. BSA is a widely-used molecule for passivation, indeed it is known to non-specifically bind to available binding sites on surfaces or to other molecules [28]. In the following
experiments, incubation times were 18 h for bPEG, and >1.5 h for both the SA and BSA solutions. All the experi-ments hereafter described were performed at room temper-ature. As shown in Fig. 5A BSA was significantly detected by a non-functionalized sensor, and caused a differential shift of ∼400 kHz. Owing to its weak non-specific binding, BSA was slightly removed by consecutive DI-water washings vis-ible at the end of the sensorgram in Fig. 5A-2. Next, the BSA shift measured with a bPEG-functionalized sensor was eval-uated. In this case we expected to obtain a lower1f with respect to the previous experiment, owing to the antifouling properties of PEG [8]. Results are reported in Fig. 5B. The LoC, upon bPEG functionalization, was not sensitive to the presence of BSA in the fluid. Indeed, no significant differ-ential1f was observed after BSA incubation, demonstrating
M. Agostini et al.: Full-SAW Microfluidics-Based LoC for Biosensing
FIGURE 5. Biosensing experiments. A) BSA detection with a non-functionalized sensor. A1) Is the sensorgram (S is the sensor shift, R is the reference shift and D is the differential shift): The gray area highlights the BSA incubation. Measured data points are squares connected by lines as guides. No data was acquired during the incubation times. DI-water washings at the end of the biosensing process slightly removed weakly bound BSA. A2) Differential shifts, BSA is significantly detected by the non-functionalized sensor. B) BSA and SA + BSA detection with
bPEG-functionalized sensor. B1) Is the sensorgram and B2) shows the differential shifts. Exposure to BSA did not cause a significant differential1f on a bPEG-functionalized sensor, thus PEG acted as an anti-fouling coating as expected. BSA + SA solution caused a significant1f. Significance is (∗) for P< 0.05 (∗∗) for P < 0.01 and (∗ ∗ ∗) for P < 0.001.
the effective antifouling action of our PEG-based function-alization method. In this case, the LoC did not detect any bound molecule and therefore did not return a false-positive result. Finally, the bPEG-functionalized sensor was exposed to the SA + BSA solution. In this last case, a significant 1f with respect to both the bPEG and BSA cases were successfully recorded. The LoC thus correctly showed a true-positive result. Thanks to the antifouling effect of the PEG coating, the device could correctly detect a concentration of SA 6-orders of magnitude lower than the BSA background concentration.
From these data a picture of the molecule-molecule and molecule-surface interaction can be hypothesized.
An illustration is reported in Fig. 6. Here the resonator fingers with BSA, bPEG, and SA are depicted. The bPEG covalently binds on the gold fingers of the IDT, as it is usual for thiolated molecules, further preventing the BSA adsorption. This leads the BSA to be present only in the finger gaps, which is the least sensitive area of the resonator (as explained in [14]) and thus BSA cannot be detected by the bPEG-functionalized sensor (true-negative). Indeed, a non-specific binding of BSA does not generate a significant 1f, as in Fig. 5B. On the contrary, the LoC exposure to SA + BSA solution results in mass loading directly on top of the resonator fingers (i.e., the most sensitive area), leading to a significant1f, as in a true-positive case.
FIGURE 6. Molecule-molecule and molecule-surface interaction on the resonator. The purple molecule is BSA, the blue is biotin with black zig-zag PEG tail, the green is streptavidin with four binding sites for biotin. The PEG has an anti-fouling effect, as highlighted in the two lower panels: BSA in these cases is present only in the finger gaps, the least sensitive area of the biosensor. On the contrary, SA binds to the biotin on the resonator fingers which is the most sensitive area, and it is therefore detected.
IV. CONCLUSION
We presented a full-SAW LoC comprising of four nanos-tructured SAW resonators with PNR reflectors as biosensors, and two IDTs for fluid mixing. The aim of this work was to perform multiplexed biosensing experiments in presence of bionoise and evaluate the device performance in this condi-tion. As a result, the LoC could correctly detect 290 pM of SA in 0.56 mM BSA-containing solution. The device did not provide false positives in absence of SA in solution. In the light of this biosensing performance and the advantages of an all-electrical readout, this LoC has the potential to be further developed for, but not limited to, biomedical applications. REFERENCES
[1] World Health Organization, The Top 10 Causes of Death. (Accessed: Mar. 20, 2019). [Online]. Available: www.who.int/news-room/fact-sheets/ detail/the-top-10-causes-of-death
[2] S. O. Kelley, C. A. Mirkin, D. R. Walt, R. F. Ismagilov, M. Toner, and E. H. Sargent, ‘‘Advancing the speed, sensitivity and accuracy of biomolec-ular detection using multi-length-scale engineering,’’ Nature Nanotech-nol., vol. 9, no. 12, pp. 969–980, Dec. 2014.
[3] P. Yager, T. Edwards, E. Fu, K. Helton, K. Nelson, M. R. Tam, and B. H. Weigl, ‘‘Microfluidic diagnostic technologies for global public health,’’ Nature, vol. 442, no. 7101, pp. 412–418, Jul. 2006.
[4] E. K. Sackmann, A. L. Fulton, and D. J. Beebe, ‘‘The present and future role of microfluidics in biomedical research,’’ Nature, vol. 507, no. 7491, pp. 181–189, 2014.
[5] M.-I. Mohammed and M. P. Desmulliez, ‘‘Lab-on-a-chip based immunosensor principles and technologies for the detection of cardiac biomarkers: A review,’’ Lab Chip, vol. 11, no. 4, pp. 569–595, Feb. 2011.
[6] Y. Temiz, R. D. Lovchik, G. V. Kaigala, and E. Delamarche, ‘‘Lab-on-a-chip devices: How to close and plug the lab?’’ Microelectron. Eng., vol. 132, pp. 156–175, Jan. 2015.
[7] J. Barth, J. K. Rae, and D. Freedman. (2011). Harmonisation of Reference Intervals. Pathology Harmony Group. [Online]. Available: http:// www.acb.org.uk/docs/default-source/committees/scientific/guidelines/acb/ pathology-harmony-ii-biochemistry.pdf?sfvrsn=2
[8] H. Zhang and M. Chiao, ‘‘Anti-fouling coatings of poly(dimethylsiloxane) devices for biological and biomedical applications,’’ J. Med. Biol. Eng., vol. 35, no. 2, pp. 143–155, Apr. 2015.
[9] S. Wang, F. Inci, G. De Libero, A. Singhal, and U. Demirci, ‘‘Point-of-care assays for tuberculosis: Role of nanotechnology/microfluidics,’’ Biotechnol. Adv., vol. 31, no. 4, pp. 438–449, Jul./Aug. 2013.
[10] J. Homola, ‘‘Surface plasmon resonance sensors for detection of chem-ical and biologchem-ical species,’’ Chem. Rev., vol. 108, no. 2, pp. 93–462, Feb. 2008.
[11] L. He, Q. Pagneux, I. Larroulet, A. Y. Serrano, A. Pesquera, A. Zurutuza, D. Mandler, R. Boukherroub, and S. Szunerits, ‘‘Label-free femtomolar cancer biomarker detection in human serum using graphene-coated surface plasmon resonance chips,’’ Biosensors Bioelectron., vol. 89, pp. 606–611, Mar. 2017.
[12] M. Piliarik and J. Homola, ‘‘Surface plasmon resonance (SPR) sensors: Approaching their limits?’’ Opt. Express, vol. 17, no. 19, pp. 16505–16517, Sep. 2009.
[13] D. Matatagui, D. Moynet, M. J. Fernández, J. Fontecha, J. P. Esquivel, I. Gràcia, C. Canéc, C. Déjous, D. RebiÃĺre, J. P. Santos, and M. C. Horrillo, ‘‘Detection of bacteriophages in dynamic mode using a Love-wave immunosensor with microfluidics technology,’’ Sens. Actua-tors, B, Chem., vol. 185, pp. 218–224, Aug. 2013.
[14] M. Agostini, G. Greco, and M. Cecchini, ‘‘A Rayleigh surface acous-tic wave (R-SAW) resonator biosensor based on positive and negative reflectors with sub-nanomolar limit of detection,’’ Sens. Actuat. B, Chem., vol. 254, pp. 1–7, Jan. 2018.
[15] J. Friend and L. Y. Yeo, ‘‘Microscale acoustofluidics: Microfluidics driven via acoustics and ultrasonics,’’ Rev. Mod. Phys., vol. 83, pp. 647–704, Jun. 2011.
M. Agostini et al.: Full-SAW Microfluidics-Based LoC for Biosensing
[16] T. Frommelt, M. Kostur, M. Wenzel-Schäfer, P. Talkner, P. Hänggi, and A. Wixforth, ‘‘Microfluidic mixing via acoustically driven chaotic advec-tion,’’ Phys. Rev. Lett., vol. 100, Jan. 2008, Art. no. 034502.
[17] M. Cecchini, S. Girardo, D. Pisignano, R. Cingolani, and F. Beltram, ‘‘Acoustic-counterflow microfluidics by surface acoustic waves,’’ Appl. Phys. Lett., vol. 92, no. 10, 2008, Art. no. 104103.
[18] M. Travagliati, R. J. Shilton, M. Pagliazzi, I. Tonazzini, F. Beltram, and M. Cecchini, ‘‘Acoustofluidics and whole-blood manipulation in sur-face acoustic wave counterflow devices,’’ Anal. Chem., vol. 86, no. 21, pp. 10633–10638, Nov. 2014.
[19] R. J. Shilton, M. Travagliati, F. Beltram, and M. Cecchini, ‘‘Nanoliter-droplet acoustic streaming via ultra high frequency surface acoustic waves,’’ Adv. Mater., vol. 26, no. 29, pp. 4941–4946, Aug. 2014.
[20] R. J. Shilton, M. Travagliati, F. Beltram, and M. Cecchini, ‘‘Microfluidic pumping through miniaturized channels driven by ultra-high frequency surface acoustic waves,’’ Appl. Phys. Lett., vol. 105, no. 7, Aug. 2014, Art. no. 074106.
[21] D. J. Collins, B. Morahan, J. Garcia-Bustos, C. Doerig, M. Plebanski, and A. Neild, ‘‘Two-dimensional single-cell patterning with one cell per well driven by surface acoustic waves.,’’ Nature Commun., vol. 6, Nov. 2015, Art. no. 8686.
[22] G. Greco, M. Agostini, I. Tonazzini, D. Sallemi, S. Barone, and M. Cecchini, ‘‘Surface-acoustic-wave (SAW)-driven device for dynamic cell cultures,’’ Anal. Chem., vol. 90, no. 12, pp. 7450–7457, May 2018.
[23] G. Greco, M. Agostini, S. Barone, and M. Cecchini, ‘‘Embryo develop-ment in dynamic microfluidic systems,’’ Sens. Actuat. B, Chem., vol. 250, pp. 525–532, Oct. 2017.
[24] A. Sonato, M. Agostini, G. Ruffato, E. Gazzola, D. Liuni, G. Greco, M. Travagliati, M. Cecchini, and F. Romanato, ‘‘A surface acoustic wave (SAW)-enhanced grating-coupling phase-interrogation surface plas-mon resonance (SPR) microfluidic biosensor,’’ Lab Chip, vol. 16, no. 7, pp. 1224–1233, Apr. 2016.
[25] G. Greco, M. Agostini, R. Shilton, M. Travagliati, G. Signore, and M. Cecchini, ‘‘Surface acoustic wave (SAW)-enhanced chemical func-tionalization of gold films,’’ Sensors, vol. 17, no. 11, Oct. 2017, Art. no. E2452.
[26] A. Renaudin, V. Chabot, E. Grondin, V. Aimez, and P. G. Charette, ‘‘Inte-grated active mixing and biosensing using surface acoustic waves (SAW) and surface plasmon resonance (SPR) on a common substrate,’’ Lab Chip, vol. 10, pp. 111–115, Jan. 2010.
[27] F. Lurz, T. Ostertag, B. Scheiner, R. Weigel, and A. Koelpin, ‘‘Reader architectures for wireless surface acoustic wave sensors,’’ Sensors, vol. 18, no. 6, May 2018, Art. no. E1734.
[28] B. Sweryda-Krawiec, H. Devaraj, G. Jacob, and J. J. Hickman, ‘‘A new interpretation of serum albumin surface passivation,’’ Langmuir, vol. 20, no. 6, pp. 2054–2056, Mar. 2004.
MATTEO AGOSTINI was born in Latina, Italy, in 1988. He received the B.S. degree in electronics engineering and the M.S. degree in nanotechnol-ogy engineering from ‘‘La Sapienza–University of Rome,’’ and the Ph.D. degree in molecular biophysics with a thesis on SAW-Biosensors and Microfluidic Devices for Life Science Applica-tions from Scuola Normale Superiore, Pisa, Italy.
Since 2017, he has been a Research Fellow with Scuola Normale Superiore. His activities are based on the National Enterprise for Nanoscience and Nanotechnology (NEST) Laboratory, Pisa, where he studies and develops SAW-based nano-devices for sensing and microfluidics applications. His research interests include micro-and nano-fabrication techniques, sensors development micro-and characterization, and biosensing systems. He also explores chemical functionalization of surfaces for several applications, sensing, and hydrophobization among all.
GINA GRECO was born in Italy, in 1990. She received the M.S. degree in physics (medical physics curriculum) from the University of Pisa, Italy, in 2015. She is currently pursuing the Ph.D. degree in biophysical sciences with NEST Labo-ratories, Scuola Normale Superiore, Pisa.
Her current research interests include surface acoustic wave (SAW) biosensors, SAW-driven microfluidic systems, development of new devices for early-detection of diseases, and cell cultures. MARCO CECCHINI was born in Italy, in 1975. He received the master’s degree in physics from Physics Department, University of Pisa, Italy, in 1999, and the Ph.D. degree in condensed mat-ter physics from Scuola Normale Superiore, Italy, in 2006. He is currently a Researcher with the Nanoscience Institute, Pisa, Italy, of the Italian National Research Council (CNR), and a Lecturer of biomaterial science with the Biology Depart-ment, University of Pisa (Laurea degree course in biotechnology).
His main research interests include the development of nanostructured biomaterials for brain pathologies and nerve regeneration; designing, pro-duction, and testing of surface-acoustic-wave-driven microfluidic devices for advanced cell cultures and biosensing.