1
ALMA MATER STUDIORUM
UNIVERSITÀ DEGLI STUDI DI BOLOGNA
SCUOLA DI INGEGNERIA E ARCHITETTURA
-Sede di Forlì-
CORSO DI LAUREA
IN INGEGNERIA AEROSPAZIALE
Classe: LM-20
TESI DI LAUREA
In ATMOSPHERIC FLIGHT DYNAMICS
Design and prototyping of electronic PCBs for the study of the
atmosphere in harsh environmental conditions.
CANDIDATO
RELATORE
Abramo Ditaranto
Prof. Fabrizio Giulietti
CONTRORELATORE
CORRELATRICE
Prof. Paolo Tortora
Ing. Nani Serrano Castillo
A.A. 2013/2014
Sessione II
3
INDEX
1. Aim of the thesis
5
2. Introduction
5
2.1 The general project
5
2.1.1 Processing unit
8
2.1.2 Data acquisition system
10
2.1.3 Actuators
18
2.1.4 Power requirements
22
2.1.5 Robustness
23
2.2 Design parameters
24
2.3 Design deadline
25
3. Study of different configurations
26
3.1 Redundancy of the power lines
26
3.2 Protection of the power lines
27
4. Analytical explanation of the PCBs
29
4.1 Stacked Board 1 [SB1]
30
4.2 Stacked Board 2 [SB2]
38
4.3 Heater Board [H-Board]
43
4.4 Power Control Unit [PCU]
46
5. External shields
51
5.1 Arduino Shield
51
5.2 Ethernet Shield
52
5.3 GPS Adafruit
53
5.4 Motion Mind Motor Controller
54
6. Possible changes and improvements
55
7. Conclusion
55
8. Thanks
55
9. Figures Index
56
10. Table Index
58
11. Acronyms Index
58
5
1. Aim of the thesis
The aim of the present thesis is to create a series of electronic printed circuit boards (PCBs) for the BEXUS 18 experiment.
“The BEXUS is a programme realised under a bilateral Agency
Agreement between the German Aerospace Center (DLR) and the Swedish National Space Board (SNSB). The Swedish share of the payload has been made available to students from other European countries through a collaboration with the European Space Agency (ESA)” [ref. 1].
In this document will be shown all the electronic system, the problems that have been faced and overcome, the tests and we’ll also talk about the real launch occurred in the day of October 10 2014.
2. Introduction
Let’s give a panoramic view of the project, how it’s been made and which requirements were involved.
2.1
The general project
In the project “Bexus 18”, sponsored by ESA, we’ve created an experiment able to acquire important atmosphere data at high altitude (about 27Km) and latitude (about 68°North). The present experiment has been loaded onto a gondola that was attached to a big aerostatic balloon. It flew for about two hours and half in extreme
climatic conditions due to the location and the altitude.
At the end of the flight the gondola has been detached from the Figure 2.1-1: Kiruna base - north of Sweden
6
balloon and a parachute opened.
In order to acquire atmosphere data we’ve used a significant amount of: Sensors Actuators Plus Processing unit External shields
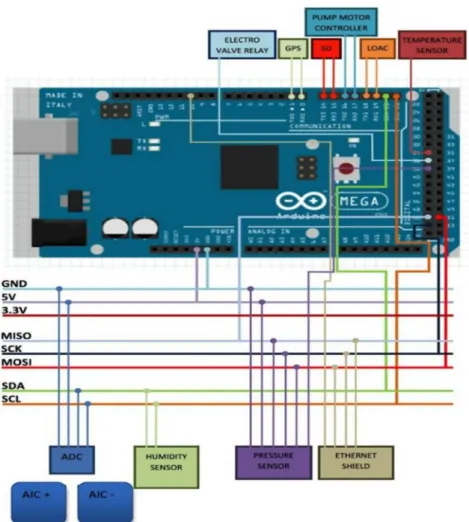
In the figure below you can see the entire electronic system scheme with those components [fig. 2.1-2].
We can see the whole electronics interfaces with the power supply (red lines), the communications between the different sensors and instruments with the microcontroller (blue arrows), and switches for heater boards and relays (green lines).
7
The sensors and instruments used to achieve the goals of the experiment, use different ways to send data to the microcontroller. The communication protocols that Arduino Mega 2560 uses are: SPI
I²C
ONE WIRE UART
Table 2.1-1 Sensors communications protocol
Sensors Protocol
Pressure Sensor I2C
AIC I(+)(analogic)-->ADC I²C AIC I(-)(analogic)-->ADC I²C
Humidity Sensor I²C
Temperature Sensor One Wire
LOAC UART
Table 2.1-2 Other devices communications protocol
Other Devices Protocol Pin
Electro-valves-->Relay Digital Pin 36
SD UART 3 TX3/RX3
Pump motor controller Motion Mind UART 2 TX2/RX2
GPS UART 0 TX0/RX0
Ethernet Shield SPI MOSI/MISO/SS
All of the sensors, instruments and actuators give a digital output except for the two AIC’s whose analogic output needs to be converted into digital thanks to a customized printed board and the Arduino ADC.
8
The entire electronics interfaces with sensors and instruments will be designed in order to exactly fit with Arduino MEGA 2560 Board. The PCU
Power Control Unit instead does not have very strict geometry requirements.
All of them are placed together in the electronics box.
Let’s better analyse every component just mentioned above.
2.1.1 Processing unit
The processing work will be done by an “Arduino Mega 2560” .
Figure 2.1.1-1 : Arduino Mega 2560 [ref. 3]
It mounts an ATMega 2560 of the Atmel Corporation which equips the board with:
9
USB peripheral:
for interfacing/communication with personal computer. SPI peripheral
I2C peripheral USART peripheral
Analog to Digital Converter (ADC)
A logical scheme could be represented in the figure below [fig. 2.1.1-2].
We can see how sensors, instruments and actuators are interfaced with the central logic.
Of course that’s only a logical scheme. So it’s been necessary to create printed circuit boards to let everything work properly.
10
2.1.2 Data acquisition system
The following is a list of the acquisition objects divided in two categories:
1. Sensors 2. Instruments
In addition will be made a related analysis:
11
1. Sensors
In general they are really small, with various number of pins in order to be soldered on the printed circuit boards.
Let’s take a view.
Temperature sensors:
o
One of them is positioned on board electronic directly interfaced with the processing unit.It measure atmosphere temperature.
For this job has been chosen the IC “DS18B20” temperature sensor. In the figure below [fig. 2.1.2-1] is reported the configuration circuit.
Figure 2.1.2-1: DS18B20 Hardware Configuration [ref. 4]
It can be used from -55°C to 125°C with a accuracy of ±0.5°C.
It works with a “one wire protocol” and communicates with Arduino in a really convenient way due to the simple installation and the simple interfacing via Arduino libraries programming.
It is powered with 5V and for the present project it’s been chosen a TO92 package.
o
Three other temperature sensors are positioned onto the three most sensitive instrumentsUnlike the previous case, these are used only to activate heating systems in order to not allow the temperature to descend below the 0°C on the respective instrument.
12
For this job was chosen the thermistor “NTCLE100E3103” that changes the value of its resistance with the change of the temperature.
At 25°C it presents 10KΩ of resistance. With the rise of the temperature, the resistance value decreases.
In the figure below [fig. 2.1.2-2] are shown the main parameters of the series.
Figure 2.1.2-2: NTCLE100E3 series main parameters [ref. 5]
Pressure Sensor
For the purpose it’s been chosen the integrated circuit “MS5607”. See figure below [fig. 2.1.2-3].
13
Figure 2.1.2-3: MS5607 pressure sensor main parameters [ref. 6]
Positioned on board the electronic it has got a QFN package and communicate with the processing unit via I2C peripheral.
Due to its small package it’s been soldered by a specific company with a furnace.
Humidity sensor
For the present purpose we’ve used the IC Sensor “HIH9120” by Honeywell [fig. 2.1.2-4].
The package is a SIP4 and the communication protocol used is I2C.
14
It works with a voltage range supply of 2.3V÷5.5V
GPS
For the detection of the instant position and altitude above m.s.l. of the experiment during the flight.
This device will be really important during the descent step, before the parachute opening.
A better explanation will be done in the section 5.
2. Instruments
Below a list of instruments used in the experiments.
For everyone was necessary to interface it with the electronic system.
Air Ion Counters
It has got the function to detect ions in the air. They respectively detect positive and negative ions. The following to know how they work.
These devices use a fan to create an airflow and draw air from outside to the gondola. All the ions present in the surrounding air are diverted from the flow, with a rate of 24 l/min, and collected on a plate which gives a voltage output proportional to the number of ions collected (n/cm3) thanks to its 10 GΩ resistance. The air is then expelled downwards through the bottom plate. These instruments stayed on for the whole flight, allowing the creation of a vertical profile of the atmosphere.
In the following figure we can see the two Air Ion counters [fig. 2.1.2-5]
15
Now let’s take a view about the instruments specifications
Table 2.1.2-1: AIC specifications
Unfortunately these instruments are very sensitive, so we’ve to take much care of theme and we need to avoid:
The presence of static charges:
The presence of static charges, since an excess of charges near the top slot would cause a lower reading since ions would be deflected away (same charge) or attracted towards the inlet instead of the collector plate (opposite charge). In order to avoid this effect, the AIC case, which is coated by
Air Ion counter AlphaLab
Range 0 to 200K ions/cm3 (0 to ± 2 V output)
Offset ± 1 to 100 mV
Noise 10 ions/cc (2s averaging)
Operating Range -50 to +50 C
Power 10 to 14 VDC
Fan On 45 mA (typical) Fan Off 4 mA (typical)
Weight 305 g
Size 160 x 100 x 55 mm
16
a conductive material, has to be connected to ground (with the supplied long cord) [ref. ].
The presence of dust:
The presence of dust inside the meter. In fact that could create a slightly electrically-conducting bridge between the internal collector plate and the metal chamber which surrounds the collector plate, causing an increase in the offset value of the output voltage [ref. ].
That’s the reason why is really important to give a protected position for these instruments in the experiments.
Particle counter
Its job is to analyse the particle quantities and dimension.
In this way we can create a Gaussian function in which the abscissa is the particle diameter dimension.
The choice of the particle counter was very hard.
It’s really important to buy an instrument that is as much as possible reliable, small and cheap.
The range of products, that perform this task, on the market is very limited and expensive.
In these instruments in fact are present mechanics and optics very sensitive that make the price to rise dramatically.
Finally we chose, the LOAC (Light Optical Aerosol Counter) from Meteo-Modem, which is already involved in several research programs of atmospheric studies and has proved to work in high altitude balloons.
This device is capable of measuring aerosols’ distributions in 20 size classes between 0.2 and 50 µm and, thanks to measurements of light scattering at two different angles it is capable of accurately determining the size of aerosols [ref. ].
17
In the figure below [fig. 2.1.6-6] a picture of the LOAC instrument.
In the table below [table 2.1.2-2] has been scheduled all the fundamental properties of the LOAC device.
Table 2.1.2-2: LOAC properties LOAC (Meteo-Modem)
Particles’ size 0.2 to 50 µm (19 channel bins) Measurement range 0 to 2000 particles/ cm3
Integration time 10 s
Light source Laser diode 25 mW @ 635 nm Sampling flow rate 1,6 l/min (typical)
Operating Range -20° to 25° C Power 7,2 VDC 450 mA ± 30 mA Weight 250 g Size 250 x 180 x 100 mm Communication RS 232 or I2C
Sioutas (Sampling Unit)
For the detection of the particles present in the atmosphere in function of the matter in which they are made.
Figure 2.1.2-6: LOAC[ref. 9]
Figure 2.1.2-7: Sioutas Impactor [ref. 10]
18
It uses an “aerodynamic filter” that differentiates the substances in base of their and weight and composition.
The SIOUTAS sampler [fig. 2.1.2-7] is optimized for a flow rate of 9 l/min, which is in principle achievable with the BOXER pump through an active control of the magnet brushed motor. This pump will be explained in the next paragraph.
2.1.3 Actuators
Pinch Valves
Two pinch valves are used for Sioutas pipe suction with the diaphragm pump.
In the figure below [fig. 2.1.3-1] is shown an example.
19
It works with a power of 12V and need a current of 0.33A.
They has been activated simultaneously with only a relay [section 4.1].
Diaphragm Pump
It’s necessary for the suction of the air flow in the pipe of the Sioutas. Thanks to it there were an air flow of about 9 l/min that determined the correct operation of the instrument even if it can create a flow up to 32 l/min.
Let’s see the pump properties in the table below [Table 2.1.3-1].
Table 2.1.3-1: Diaphragm Pump Properties
Pump 7500 Boxer Pump
Performance Flow rate up to 32 l/min
Type Diaphragm pump, magnet brushed DC motor
Operating Range -50 to +50 C
Power 12 V DC
Max current 3 A
Weight 1.1 Kg
Size 168*86*83 mm
20
Power Lines Relays
The on board electronic has also got the function to turn on/off the two power lines parallel with itself via remote.
This is done via relays positioned in the three lines of supply.
Shortly before the end of the flight and before the experiment touched the ground, the power of the electronic switched off itself without the need to return on.
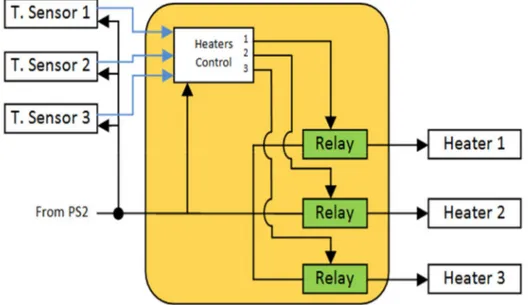
Heaters
Their functionality is to heat portions of instruments particularly sensitive to the coldness with the help of temperature sensors explained in the section 2.1.2.
Figure 2.1.3-3: Heater-Board scheme
In the figure below [fig. 2.1.3-4] is represented an example of heater at 220Ω with a rectangular shape.
The most important parameter in addition to the resistance is the maximum functionality power value.
21
Figure 2.1.3-4: Rectangular 220Ω Heater [ref. 13]
Simple to calculate is the maximum voltage to which they can be subjected:
=
where:
R = resistance in ohm P = power in Watt
Air Ion Counters Offset Control Relays
The Air Ion Counters instruments are equipped with an offset control that is used before every measurement.
It then is subtracted from all successive data.
In order to be measured we need to short two pins (pin 5,6) output from the instruments.
Thus is necessary to use control relays.
In the figure below [fig. 2.1.3-5] we can see the cable schematic via an extrapolation of the instrument datasheet.
22
Figure 2.1.3-5: Air Ion Counters Cable Jack [ref. 14]
2.1.4 Power requirements
With the total sum of the: Actuators
Sensors
Processing unit consumption
Efficiency of the voltages converters in the PCU
we got a value of power of about 100 Watt in the worst case with an average current consumption of about 7 Amperes.
So it’s necessary to pay much attention to the trace on the PCBs; We in fact calculated their best thickness as the best compromise between encumbrance and energy dissipation.
The elements on which we paid more attention on the PCBs creation are the pump traces.
23
2.1.5 Robustness
The robustness is one of the most important objective in the project to reach.
The operating conditions of the experiment was really harsh [see section 2.2].
We’ve got to keep into account the following variables:
Temperature Pressure Humidity
Electromagnetic field interference Vibrations
Therefore it’s important to create something:
that doesn’t allow the creation of condensation, feasible through heaters and insulating cover.
that allows a good air flow from outside to inside in order to not to create relevant difference in pressure between the atmosphere and the internal part of the experiment, that can be dangerous.
that doesn’t allow to be interfered from the electromagnetic field of the other experiments on board the gondola and vice versa.
that resists to the flight vibrations but most of all that resists at the vibration shock that is generated from the touch between the gondola and the ground.
These factors are really important in order to make all the electronic to work properly and to make the entire experiment to reach a success.
24
2.2
Design parameters
As told in the preceding paragraph, during the design phase we’ve kept in consideration five important/critical parameters:
1. The temperature:
The temperature is maybe the most important parameter to take into account.
The aerostatic balloon that carried the experiment reached an altitude of about 27.5 Km in a latitude of about 68° North in October month.
It means that the experiment must have thermal cover and the electronic on board must mount components and integrated circuits that resists at a temperature of at least -50°C.
Also the electronic has been heated by thermal heaters [section 2.1.3 and section 4.3]
2. The humidity:
The humidity could be a very dangerous factor if related with the low temperature.
The risk of freezing is not so high, due to the dryness of the air in that area, but is present anyway. The risk rises when the gondola gets in the clouds. To prevent this problem, defined sensitive electronic circuit area, was isolated.
3. The pressure:
During the flight the experiment reaches altitudes in which there’s extremely low pressure.
Therefore also the pressure sensor has got a measurability spectrum that includes pressures of few units of millibars.
In addition, as told, the outside must communicate with the inside, penalty of explosion of the experiment.
25 4. The e.m. field cover:
For the electromagnetic field and ionized particles cover has been used customized filter LC used by ESA and polyurethane cover.
In addition every portion of circuit has got proper LC filter and finally we’ve used to divide the grounding scheme in order to avoid ground loops [see section 4].
5. The vibrations:
We’ve take in consideration the possible vibrations during the transport phase and of course during the flight.
In fact during the rise of the balloon could happen turbulences and most of all we considered the shock verified in the fall phase, when the gondola touched the ground.
We’ve designed the electronic in order to resists to all of these vibrations.
2.3
Design deadline
The timing design was strict due to the many stringent deadlines communicated by ESA.
For all the design phase were performed:
Creation of stand-alone boards for laboratory proof
Simultaneous collaboration and comparison with software engineers
Design of electronic printed circuit boards Boards testing
26
3. Study of different configurations
In the preliminary phase of the project was fundamental the choice of the configurations that we could give to it.
Here, below, two of the most important choice.
3.1
Redundancy of the power lines
The initial project was expected the use of more than one “power selector” for redundancy in case of failure of one or more power lines.
As shown in the figure below [fig. 3.1-1], the IC “LTC4412” needs of few external components like:
P Channel Mosfet FDN306P (max current 2.6A) Schottky Diode (max current 1A)
Resistor Capacitor
27
The maximum manageable current is nothing more than the maximum current that can pass through the mosfet and the Schottky diode.
In fact the LTC4412 has the only function to go high or low the gate pin (pin 5) according to the input value of the sense pin (pin6).
Therefore in some power lines, especially the pump and pinch valves one, were provided two mosfet and four diodes respectively in parallel.
In a similar way in the other two power lines.
The idea was rejected due to the very high reliability of the batteries. The batteries risk of failure is really low and the redundancy circuit contrarily to what is wanted could prove harmful.
In fact a good point of view of any engineer is to avoid project complication that is not justified because in these cases the probability of failure could rise.
3.2
Protection of the power lines
The power line protection was another very important item to reach. In fact in the event that short circuit had occurred, in any of the electronic boards, the batteries providing the power line related would be quickly and inevitably consumed.
Also we had to consider the probability of little fire or little burns in that part of the board surrounding the short circuit.
So we examined two possible solutions. The use of fuses:
their use is safe, they are not subject to risk but when they fuse they cannot be restored via remote.
or
The use of current limiter integrated circuit:
their use is of course less safe comparing with the fuses mentioned above, but they permit a precise control of the maximum current permissible and most of all they permit to be controlled via remote.
In fact could happen momentary picks of current not due to the presence of short circuit but due to other reasons.
In that cases is necessary to restore the line and in our case via remote.
28
After an accurate analyses on pro e con of the two possible alternatives, on which there were a participation of the ESA experts engineers, we arrived at the conclusion that is more robust to use limiter current integrated circuit.
The IC kept in consideration is the “MIC2545A” with a maximum adjustable current of 3 Amperes.
For a greater clarity circuit see figure below [fig. 3.2-1].
29
4. Analytical explanation of the PCBs
Now let’s analyse all the printed circuit boards of the experiment. In the figure below [fig. 4.1-1] the software used for the creation of the circuit boards.
Figure 4-1: Eagle Cad Professional [ref. 17]
The software is Eagle Cad Version 6.3.0 Professional both for circuit design and for boards routing.
30
4.1
Stacked board 1 [SB1]
The figure below [fig. 4.5-2] shows the stacked board SB1 routed and ready to be printed.
Regarding the geometry, the board is expressly done in order to exactly fits with Arduino MEGA 2560 pin schematics.
In this way it can overlap the Arduino Board and optimize the space and volume used for the electronics subsystem reducing as much as possible noisy flying cables and failures due to bad contacts.
31
In the table below [table 4.1-1] are shown and briefly descripted the sensors and instruments connected in the SB1.
Table 4.1-1: SB1 Sensors and Instruments connected.
Component Voltag e Comm . Information Humidity sensor “HIH9120”
5V I2C SCL, SDA, are pulled up with 2.2KOhm resistor.
Pressure sensor “MS5607”
3.3V I2C Connected to Arduino 3.3 V power line. In order to change the voltage levels, from 3.3 to 5V, a level shifter TXB0101 has been included for sensor input pins and a level translator IC for the output.
Temperature sensor
5V One
wire
Pulled up with 4.7KOhm resistor. Optical particle counter “OPC” LOAC
7,2V UART 7,2V powered directly from CPU
Converting RX and TX for UART using a RS232 to TTL converter.
GPS 3,3V UART 8 pin connector
Motor Controller (for PUMP)
14,4V UART 8 pin connector
The PCB has four layers in order to reduce the space needed by the circuit and to facilitate the separation of the different grounds. To make the system more reliable in terms of failure detection, some
32
test points have been included in the PCB. In the following figures the general circuit schematics are shown.
Figure 4.1-2: SB1 schematic – first part
In the figure above [fig. 4.1-2] is shown the eagle circuit schematic of the first part of SB1.
This step is important to create the part of the board that will let it fit with Arduino board.
33
34
In the second part [fig. 4.1-3] is shown the circuit of all the sensors. Let’s see every singular circuit sensor.
Figure 4.1-4: Humidity sensor schematics
The figure above [fig. 4.1-4] represents the circuit for the humidity sensor. We can see the two pull-up resistor for SCL and SDA used for I2C communication protocol.
35
Figure Errore. Nel documento non esiste testo dello stile specificato.-5 Pressure sensor schematics
It communicates via I2C interface.
Since it works at 3.3V, we’ve put tension divider for the input pin (SCL) and level shifter TXB0101 for the sensor output pin (SDA).
36
In the figure below [fig. 4.1-6] is shown the typical application of the level shifter “TXB0101”.
Figure 4.1-6: TXB0101 level shifter [ref. 18]
Now let’s see the temperature sensor.
It’s maybe the simplest circuit sensor. It communicates with arduino via “one wire” protocol and need only of a 4.7KΩ pull-up resistor.
37
Figure 4.1-8: AIC offset control
The circuit above [fig. 4.1-8] shows the relays circuit for the Air Ion Counters offset control.
In this way we could decide when activate the fans for the offsets or deactivate them.
Note that in this case is not present an antiparallel diode for the relay because it’s a solid state relay and naturally doesn’t include a coil.
38
4.2
Stacked board 2 [SB2]
Table 4.2-1 Stacked board 2
Component V Comm. Information
Data-logger “open-log”
5V UART Voltage level shifting for the TXO from 3.3V to 5V using level translator IC TXB0101
OPAMP “LM358N” for AICs
12V
/
Presents two inside operational amplifiers. The configuration adopted is made of two differential amplifiers with a gain of 2.097. Solid state Relays AQY211EH paralleled 1.5V max digital: high-lowAverage 5mA each. A NPN BJT (bipolar junction transistor) “BC337” used for driving the relay load. The output pins of the relays will be connected to the tips of the pinch valves cable.
GPS level translator
5V - A voltage divider is used in order to change voltage from 5V to 3.3V for the signal
LOAC level translator
5V - A voltage divider is used in order to change voltage from 5V to 3.3V for the signal
Figure Errore. Nel documento non esiste testo dello stile specificato.-2 Stacked Sensor Board 2 (SB2)
39 Figure 4.2-2: SB2 schematics - first part
In this case [fig. 4.2-2], like in the SB1 [section 4.1], the first part is characterized from the Arduino shield compatible pin in order to exactly fit with it.
40 Figure 4.2-3: SB2 schematics – second part
In the figure above [fig. 4.2-3] is shown the sensor and actuator circuit. Let’s better analyse every portion.
41
Below [fig. 4.2-4] the data logger schematic. It was really important for storing data acquired during the experiment in case of trouble with radio communication with ground station on the ground.
Figure 4.2-4: Data Logger schematics
Below is represented the conditioning circuit for the AICs output voltage signal. The integrated circuit used is the LM358N that includes two operational amplifiers thanks to which we created two differential amplifiers with a gain of 2.096. One is for positive Ion Counter and the other one for the negative Ion Counter.
Then the signals (A0 and A1) rich the Arduino ADCs in order to be read.
42
Figure 4.2-7: GPS and LOAC levels translator Figure 4.2-6: Paralleled solid-state relays’ schematics
43
4.3
Heater Board [H-Board]
The heater board is fundamental to prevent the problems derived from the extremely low temperature of the experiment [see section 2.2].
It has to turn on heaters [see section 2.1.3 - heaters] whenever the temperature drops below 0°C on the portion of the experiment where’s positioned the thermistor temperature sensor.
In the figure below [fig. 4.3-1] the heater board routed.
The experiment thermal subsystem requires an electronic control of the heaters. The H-Board is divided in two different parts: logical and control.
Regarding the logical part, two fundamental ICs have to be distinguished:
OPA4180 quad operational amplifier: it is used as a buffer for voltage tracking. Its inputs are represented by the voltages coming from voltage dividers where each first resistor is made by a 47KOhm resistor and each second one is made by the thermistor "NTCLE100E3" [see fig. 4.3-2].
44
LM139 quad comparator: it compares the voltage coming from the output of OPA4180 with a reference voltage for 0°C. If the measured temperature gets below 0°C the signal goes up and becomes higher than the reference voltage. Thus the output of LM139 goes up to VCC and the control block [fig. 4.3-3] is activated. The parallel resistors in the right-high corner are pull-up resistors for the output of LM139.
Regarding the control block:
The figure below [fig. 4.3-3] shows how the signal coming from the LM139 output (Ox: O1, O2, O3) is powered. For this purpose a BJT BC337, is used. When the signal “Ox” goes up, the three BJTs activate three MOSFETs and in the meanwhile charge three 147uF polarized capacitors. Their function is to maintain the control block activated for about 7 minutes after 0°C is reached that is after Ox is grounded from LM139.
The three solid-state relays "AQY211EH" are used to switch on the heaters that need few mA each.
45 Figure 4.3-3: Control block of H-Board
46
4.4
Power Control Unit [PCU]
47
Fig 4.5-21 shows a schematic of the converting section of the PCU board.
Three categories of voltage converter ICs are shown:
The first one is the variable switching voltage regulator DE-SWADJ that can give an output up to 25Watt.
The second one is represented by fixed 5Volts switching regulator DE-SW005 that gives an output of 5V with a ripple lower than 2%, which is perfect for the electronic powering. The third one is represented by the variable linear voltage
regulator LT3080 that has the potential to be paralleled. Due to the different requirements for performing of the different instruments, the PCU has different power outputs:
Air ion counters: 12V and 45mA provided by a switching voltage regulator DE-SWADJ
Electronic boards: 5V and 500mA. For this purpose we have used the switching voltage regulator “DE-SW005”. Pinch Valves: 12 V needed and 0.33A of current each. Thus,
two linear variable voltage regulators have been placed in parallel (“LT3080”) and three diodes in parallel in order to provide high output current.
Heater Board: It will be powered by the 28V gondola battery without any voltage regulator.
LOAC: It works at 7.2V and 450mA of current. For this purpose we have used the adjustable switching voltage regulator DE-SWADJ that regulates the voltage at 7.2V.
Figure 4.4-2 shows the schematic regarding the switching and current-limiting section of the PCU board.
For the switching of the three main power lines we used two different types of relays. For PL1 we used a "G5LA" relay that can quietly afford 4A of current. For PL2 & PL3 we've used a solid-state relay "AQY211EH" that allows the passage of 1A maximum of current. So in the 28V line two of them have been paralleled.
48 Figure 4.4-2: PCU Switch and Current-limiting block
49
For the current-limiting an IC of the type MIC2545A has been used due to its flexibility, since it has a wide choice of current limiting up to 3A [see section 3.2].
Because of its supply voltage, which is between 2.7V and 5.5V, a voltage divider has been added considering possible current flows inside the IC. For these reason functionality tests were done.
Finally some photo-transistor optical couplers "FOD817 series" have been used in order to exchange signals from voltage referred to 'GROUND IN' and voltage referred to 'GROUND DIGITAL'.
50
Grounding strategy
The grounding strategy that was implemented employs a star topology, in which each different category of instruments has its own line, and all the separate lines gather into a single point junction. In fact, 4 different kinds of ground are used:
• Power ground • Analogic ground • Digital ground • H-Board ground
This strategy is used in order to control the reference grounding levels for each instrument and avoid ground loops and reference fluctuations that could degrade output signals from the most precise instruments.
Figure 4.4-4: Grounding and Powering topology scheme
51
5. External shields
In addition to the PCBs made by ourselves there’s others shields just bought.
Let’s see something of them.
5.1
Arduino Shield
The following picture is the Arduino board published by Arduino™
Figure 5.1-1: Arduino Shield by Arduino™ [ref. 19]
Note in the middle of the shield the microcontroller ATMega 2560 by Atmel Corporation.
Furthermore it’s simple to note that the shape is the same that the SB1 and SB2.
In fact they were made with a geometry in order to exactly fit over the Arduino board.
52
5.2
Ethernet Shield
The Arduino Ethernet Shield allows an Arduino board to connect to E-Link. It is based on the Wiznet W5100 Ethernet chip that provides a network (IP) stack capable of both TCP and UDP.
The Ethernet shield connects to an Arduino board using long wire-wrap headers which extend through the shield. This keeps the pin layout intact and allows other shields to be stacked on top. Although for the Experiment the Ethernet Shield will be on the top.
The Ethernet Shield has a standard RJ-45 connection, with an integrated line transformer and Power over Ethernet enabled. There is an on-board micro-SD card slot that cannot be used simultaneously with Ethernet. So we’ve decided to include another logger shield, Open-Log, as seen in section 4.2.
It fits with the Arduino MEGA 2560 pin-out and the board is shown in Fig 5.2-1
53
5.3
GPS Adafruit
After a wide research (Novatel, u-blox, etc), and due to budget reasons, we’ve selected this GPS Receiver because of its reliability and low cost and most of all because it has been tested in a HAB (High Altitude Balloon) up to 27 km high although Adafruit guaranteed up to 40 km altitude for some models.
Below the picture of the small shield [fig. 5.3-1].
Table 5.3-1: GPS features
Features
Sensitivity 165 dBm, 10 Hz updates, 66 channels
Power 5V, 20mA current draw
Maximum Altitude >25Km altitude (firmware up to 40km), tested at 27 Km
Satellites 22 tracking, 66 searching
Position Accuracy 1.8 m
Velocity Accuracy 0.1 m/s
Output NMEA 0183, 9600 baud default
54
5.4
Motion Mind Motor Controller
In order to control the voltage given to the brushed DC motor of the 7502 BOXER Pump, a motor controller has been selected.
The variation of flow and voltage of the PUMP is linear. Thus some tests were performed in order to know the precise flow at a certain pressure and the input voltage needed in order to obtain that flow.
Table 5.4-1: Motor Controller features
Features
Current Up to 9A continuous current (25A peak)
Voltage 6-24VDC brushed motors
Interface Binary or ASCII control interface, RS232 or TTL signal levels, 19.2KBPS or 9.6KBPS
Control Modes Serial PID based closed loop velocity,16 bit (requires encoder) Serial PID based closed loop velocity,32 bit (requires encoder) Analogic PID based closed-loop position,10 bit resolution analogic feedback
Built in over-temperature, over-current, over-voltage, under-voltage protection
55
6. Possible changes and improvements
As every engineering system, changes could be done and improvements could be reached.
Some improvements could be: Harnessing:
Very important factor is the harnessing. In this design was not planned the use of specific connectors and so it could be enhanced.
Circuitry:
In the electronic could be made some changes like the absence of the use of the level translator TXB0101. In fact Arduino can perfectly accept a voltage like 3.3V like a high input level.
So, for a circuit simplification, they can be avoided.
7. Conclusion
In conclusion the present project has flown in the date of 10 October 2014 from the base in Kiruna, in the north of Sweden and it works perfectly.
So we can say that the design is operable.
Anyway for a better functionality will be good to implement, in the future, changes explained in section 6 and possible improvements in the harnessing.
8. Thanks
I’d like to thank the Professor Giulietti Fabrizio for giving me the chance to attend to a wonderful project like BEXUS 18.
Furthermore I thank Nani Serrano Castillo for the availability, capacity and diligence shown till now.
Finally I thank the faculty for the capacity in managing money and for giving to the professors and undergraduates, moved by scientific spirit, the chance to join innovative projects like this one.
56
9. Figures Index
Figure 2.1-1: Kiruna base - north of Sweden
Figure 2.1-2: Electronic system scheme
Figure 2.1.1-1: Arduino Mega 2560
Figure 2.2.1-2: Arduino Mega and logical pinning scheme
Figure 2.1.2-1: DS18B20 Hardware Configuration
Figure 2.1.2-2: NTCLE100E3 series main parameters
Figure 2.1.2-3: MS5607 pressure sensor main parameters
Figure 2.1.2-4: HIH9120 Humidity sensor
Figure 2.1.2-5: Air Ion Counters
Figure 2.1.2-6: LOAC
Figure 2.1.2-7: Sioutas Impactor
Figure 2.1.3-1: Pinch Valve
Figure 2.1.3 2 Boxer 7000 Pump
Figure 2.1.3-3: Heater-Board scheme
Figure 2.1.3-4: Rectangular 220Ω Heaters
Figure 2.1.3-5: Air Ion Counters Cable Jack
Figure 3.1-1: Power Source Selector – LTC4412
Figure 3.2-1: MIC2545 current limiter
Figure 4-1: Eagle Cad Professional
Figure 4.1-1: Stacked Board 1 (SB1)
Figure 4.1-2: SB1 schematic – first part
Figure 4.1-3: SB1 schematic - second part
Figure 4.1-4: Humidity sensor schematics
57
Figure 4.5 5 Pressure sensor schematics
Figure 4.1-6: TXB0101 level shifter
Figure 4.1 7 Temperature sensor schematics
Figure 4.1-8: AIC offset control
Figure 4.5 10 Stacked Sensor Board 2 (SB2)
Figure 4.2-2: SB2 schematics - first part.
Figure 4.2-3: SB2 schematics – second part
Figure 4.2-4: Data Logger schematics
Figure 4.2-5: AICs signal conditioning circuit for Arduino
adc
Figure 4.2-6: Paralleled solid-state relays’ schematics
Figure 4.2-7: GPS and LOAC levels translator
Figure 4.3-1: Heaters Board (H-Board)
Figure 4.3-2: Logical block of H-Board
Figure 4.3-3: Control block of H-Board
Figure 4.4-1: PCU voltage converting block
Figure 4.4-2: PCU Switch and Current-limiting block
Figure 4.4-3: PCU Board
Figure 4.4-4: Grounding and Powering topology scheme
Figure 5.1-1: Arduino Shield by Arduino™
Figure 5.2-1: Ethernet Shield
Figure 5.3-1: GPS Adafruit
58
10. Table Index
Table 2.1 1 Sensors communications protocol
Table 2.1 2 Other devices communications protocol
Table 2.1.2 1: AIC specifications
Table 2.1.2-2: LOAC properties
Table 2.1.3-1: Diaphragm Pump Properties
Table 4.1-1: SB1 Sensors and Instruments connected.
Table 4.2-1 Stacked board 2
Table 5.3-1: GPS features
Table 5.4-1: Motor Controller features
11. Acronyms Index
SB1:
Stacked Board 1
SB2:
Stacked Board 2
H-Board:
Heater Board
PCU:
Power Control Unit
PCB:
Printed circuit board
UART:
Universal Asynchronous Receiver-Transmitter
SPI:
Serial Peripheral Interface
SDI:
Serial Data Input
59
MISO:
Master Input Slave Output
MOSI:
Master Output Slave Input
CC:
Chip Select
I2C:
Inter Integrated Circuit
SDA:
Serial Data
SCL/SCLK: Serial Clock
ADC:
Analog To Digital Converter
12. Bibliography and Web Links
[1]
http://www.sscspace.com/bexus-18_19
[2]
http://www.maps-store.it/svezia/immagine-mappa-svezia-stoccolma-malmo-goteborg-4823.html
[3]
http://www.arduino.cc
[4]
DS18B20 datasheet
[5]
NTCLE100E3 datasheet
[6]
MS5607 datasheet
[7]
HIH9120 datasheet
[8]
ALPHALAB Air Ion Counters Specification
datasheet
[9]
Environment S.A LOAC datasheet
[10]
SKC Sioutas Cascade Impactor datasheet
[11]
BIO-CHEM FLUIDIC pinch valves datasheet
60
![Figure 2.1.2-1: DS18B20 Hardware Configuration [ref. 4]](https://thumb-eu.123doks.com/thumbv2/123dokorg/7457314.101441/11.892.205.752.482.730/figure-ds-b-hardware-configuration-ref.webp)
![Figure 2.1.2-2: NTCLE100E3 series main parameters [ref. 5]](https://thumb-eu.123doks.com/thumbv2/123dokorg/7457314.101441/12.892.248.639.317.921/figure-ntcle-e-series-main-parameters-ref.webp)
![Figure 2.1.2-5: Air Ion Counters [ref. 8]](https://thumb-eu.123doks.com/thumbv2/123dokorg/7457314.101441/15.892.150.744.552.817/figure-air-ion-counters-ref.webp)
![Figure 2.1.2-7: Sioutas Impactor [ref. 10]](https://thumb-eu.123doks.com/thumbv2/123dokorg/7457314.101441/17.892.104.792.580.880/figure-sioutas-impactor-ref.webp)
![Figure 2.1.3-1 Boxer 7000 Pump [ref. 12]](https://thumb-eu.123doks.com/thumbv2/123dokorg/7457314.101441/19.892.117.780.771.1093/figure-boxer-pump-ref.webp)
![Figure 2.1.3-4: Rectangular 220Ω Heater [ref. 13]](https://thumb-eu.123doks.com/thumbv2/123dokorg/7457314.101441/21.892.244.649.244.467/figure-rectangular-ω-heater-ref.webp)
![Figure 3.2-1: MIC2545 current limiter [ref. 16]](https://thumb-eu.123doks.com/thumbv2/123dokorg/7457314.101441/28.892.176.751.663.949/figure-mic-current-limiter-ref.webp)
![Figure 4-1: Eagle Cad Professional [ref. 17]](https://thumb-eu.123doks.com/thumbv2/123dokorg/7457314.101441/29.892.182.713.534.873/figure-eagle-cad-professional-ref.webp)
