School of Architecture Urban Planning Construction Engineering
Master of Science in Management of Built Environment
Benchmarking in Real Estate
Performance Analysis of Italian Listed Funds
Supervisor: Prof. Liala Baiardi
Thesis by:
Alberto Gasparini - 898180
Tommaso Gualdi - 875094
Academic Year 2018 / 2019
Summary
Index of Figures ... V Index of Tables ... VII Abstract ... XI
Introduction ... 1
1. Real Estate Market Overview ... 5
1.1 Global Market Overview ... 5
1.2 European Real Estate Market Overview ... 7
1.3 Italian Real Estate Market Overview ... 8
1.3.1 Offices ... 10 1.3.2 Retail ... 12 1.3.3 Logistics ... 13 1.3.4 Residential ... 14 1.3.5 Hotel ... 16 1.3.6 Alternatives ... 18 1.3.7 NPLs ... 21
2. Real Estate Goods and Market ... 23
2.1 Characteristics of Real Estate Goods ... 23
2.2 Characteristics of Real Estate Market ... 27
3. Real Estate Direct Investment ... 33
3.1 Characteristics ... 33
3.2 Practice ... 35
3.3 Limitations ... 36
4. Real Estate Indirect Investment ... 39
4.1 Securitization Process ... 39
4.3 Significance ... 42
4.4 Indirect Investment Vehicles ... 42
4.4.1 REITs ... 42
4.4.2 SIIQs ... 57
4.4.3 Other Indirect Investment Vehicles ... 61
4.5 Listed Real Estate Companies ... 65
5. Real Estate Investment Funds ... 69
5.1 Mutual Investment Funds ... 69
5.2 Real Estate Investment Funds ... 72
5.2.1 Activities in Conflict of Interest ... 74
5.3 Legal Framework ... 76
5.4 Economic Function of Real Estate Funds ... 78
5.5 Actors Involved ... 79
5.5.1 SGR ... 80
5.5.2 Control Authorities ... 83
5.5.3 Independent Experts ... 84
5.6 Typologies of REIFs ... 87
5.6.1 Closed, Half-closed and Open Funds ... 87
5.6.2 Standard and Contribution Funds ... 88
5.6.3 Retail, Institutional and Speculative Funds ... 90
5.6.4 Core, Core Plus, Value Added, Opportunistic Funds ... 91
5.7 Real Estate Fund Value ... 92
5.7.1 Difference between NAV and Market Price ... 92
5.8 Real Estate Funds Market Overview ... 94
6. Real Estate Investment Risk ... 99
6.1 Notion of Risk ... 99
6.2 Risk-Return Relationship ... 101
6.3 Specific and Systematic Risk ... 103
6.4 Real Estate Investment Risks ... 105
6.4.2 Measurement of Risk ... 110
7. Real Estate Indices ... 111
7.1 Classification of the Indexes ... 112
7.2 Indirect Real Estate Market Indexes ... 114
7.2.1 Non-listed Indirect Real Estate Market ... 114
7.2.2 Listed Indirect Real Estate Market ... 116
7.3 Construction of an Index ... 122
7.3.1 Choice of the Sample ... 123
7.3.2 Typology ... 123
7.3.3 Introduction of the Components ... 124
7.3.4 Calculation of the Average ... 126
7.3.5 Construction and Calculation of Index Number ... 126
7.3.6 Connection Problems and Grinding Factors ... 128
8. Application of the Methodology: the Creation of New Indices ... 129
8.1 Introduction to the Case Study ... 129
8.2 Objectives and Methods of Analysis ... 131
8.3 Construction of New Indicators ... 133
8.3.1 Choice of the Sample ... 133
8.3.2 Ratios ... 147
8.3.3 Calculation of the Mean ... 154
8.3.4 Construction and Calculation of the Index Number ... 158
9. Performances of the Individual Funds ... 165
9.1 Critical Analysis of Market Performances ... 165
9.2 Further Objective ... 167
9.3 Evaluation of the Performances of Single Funds ... 170
10. Conclusions ... 181
Bibliography ... 185
Sitography ... 189
Appendix A ... 193
Fondo Immobiliare Alfa by Dea Capital Real Estate SGR: Financial Statements ... 193
Appendix B ... 197
Spread Sheets for the Calculation of the Market Indices ... 197
Appendix C ... 215
Index of Figures
Figure 1 - Geography of capitalization of worldwide REIT in 2018. Source: Scenari
Immobiliari ... 47
Figure 2 - Average asset allocation (surface percentage) of worldwide REITs (December 2018). Source: Scenari Immobiliari ... 48
Figure 3 - Capitalization trend (billion Euros) of European REITs. Source: Scenari Immobiliari ... 51
Figure 4 - Geography of European capitalization (December 2018). Source: Scenari Immobiliari ... 51
Figure 5 - Asset allocation (surface percentage) of US REITs (December 2018). Source: Nareit ... 56
Figure 6 - SIIQs tax regime. Source by the authors ... 59
Figure 7 - Real estate fund scheme. Source by the authors ... 79
Figure 8 - Trend of the NAV discount. Source: BNP Paribas REIM ... 93
Figure 9 - Wealth compartment. Source: Scenari Immobiliari ... 95
Figure 10 - Asset allocation of real estate investment (June 2018). Source: Scenari Immobiliari ... 96
Figure 11 - Trend (million Euros) of main real estate investment components in Italy. Source: Scenari Immobiliari ... 97
Figure 12 - Risk-yield relationship. Source by the authors ... 102
Figure 13 - Global Real Estate Funds Index. Source: INREV ... 115
Figure 14 - GPR 250 Index 3-year performance. Source: GPR database ... 120
Figure 15 - BNP Paribas REIM DTN Index and EPRA Index. Source: BNP Paribas REIM ... 122
Figure 16 - Trend of the Index Number of Liquidity Index. Source by the authors ... 160
Figure 17 - Trend of the Index Number of Capital Structure Index. Source by the authors ... 160
Figure 19 - Trend of the Index Number of Expense to Value Index. Source by the authors
... 161
Figure 20 - Trend of the Index Number of Profitability Index. Source by the authors . 162 Figure 21 - Trend of the Index Number of Capital Growth Index. Source by the authors ... 162
Figure 22 - Liquidity Performances. Source by the authors ... 172
Figure 23 - Capital Structure Performances. Source by the authors ... 173
Figure 24 - Operations Performances. Source by the authors ... 174
Figure 25 - Expenses to Value Performances. Source by the authors ... 175
Figure 26 - Profitability Performances. Source by the authors ... 176
Index of Tables
Table 1 - Pros and cons of direct investments. Source by the authors ... 37
Table 2 - Top 10 worldwide REITs. Source: Scenari Immobiliari ... 47
Table 3 - Top 10 European REITs in 2018. Source: Scenari Immobiliari ... 52
Table 4 - Aedes data sheet. Source by the authors ... 66
Table 5 - Brioschi data sheet. Source by the authors ... 66
Table 6 - Coima Res data sheet. Source by the authors ... 66
Table 7 - Compagnia Immobiliare Azionaria data sheet. Source by the authors ... 67
Table 8 - Gabetti data sheet. Source by the authors ... 67
Table 9 - IGD data sheet. Source by the authors ... 67
Table 10 - Nova Re data sheet. Source by the authors ... 68
Table 11 - Restart data sheet. Source by the authors ... 68
Table 12 - Risanamento data sheet. Source by the authors ... 68
Table 13 - Example of calculation of an index number. Source by the authors ... 127
Table 14 - Fondo Immobiliare Alfa data sheet. Source by the authors ... 134
Table 15 - Amundi RE Europa data sheet. Source by the authors ... 135
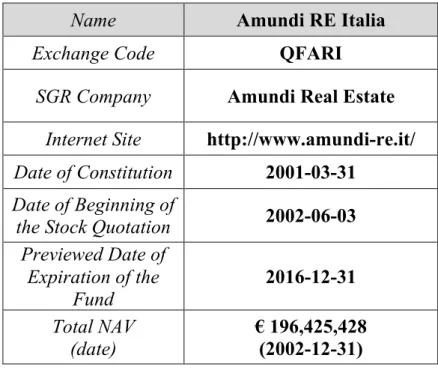
Table 16 - Amundi RE Italia data sheet. Source by the authors ... 135
Table 17 - Fondo ATLANTIC 1 data sheet. Source by the authors ... 136
Table 18 - Fondo Atlantic 2 - Berenice data sheet. Source by the authors ... 136
Table 19 - Fondo Beta Immobiliare data sheet. Source by the authors ... 137
Table 20 - BNL Portfolio Immobiliare data sheet. Source by the authors ... 137
Table 21 - Caravaggio data sheet. Source by the authors ... 138
Table 22 - Delta Immobiliare data sheet. Source by the authors ... 138
Table 23 - Estense Grande Distribuzione data sheet. Source by the authors ... 139
Table 24 - Europa Immobiliare 1 data sheet. Source by the authors ... 139
Table 25 - Immobiliare Dinamico data sheet. Source by the authors ... 140
Table 26 - Immobilium 2001 data sheet. Source by the authors ... 140
Table 27 - Investietico data sheet. Source by the authors ... 141
Table 29 - Obelisco data sheet. Source by the authors ... 142
Table 30 - Fondo Olinda data sheet. Source by the authors ... 142
Table 31 - Portfolio Immobiliare Crescita data sheet. Source by the authors ... 143
Table 32 - Piramide Globale data sheet. Source by the authors ... 143
Table 33 - Polis data sheet. Source by the authors ... 144
Table 34 - Risparmio Immobiliare Uno Energia data sheet. Source by the authors ... 144
Table 35 - Securfondo data sheet. Source by the authors ... 145
Table 36 - Fondo Tecla data sheet. Source by the authors ... 145
Table 37 - UniCredito Immobiliare Uno data sheet. Source by the authors ... 146
Table 38 - Valore Immobiliare Globale data sheet. Source by the authors ... 146
Table 39 - Example (2013) of Excel sheet with useful items from financial statements. Source by the authors ... 155
Table 40 – Spread sheet of year 2013 with ratios calculated per each fund. Source by the authors ... 157
Table 41 - Spread sheet of year 2013 with the computation of total market indicators. Source by the authors ... 158
Table 42 - Values of Indices of the Market. Source by the authors ... 159
Table 43 - Values of Index Numbers of the Market. Source by the authors ... 159
Table 44 - Funds listed in the stock exchange market (2018). Source by the authors .. 168
Table 45 - Funds still active in the market (2018). Source by the authors ... 169
Table 46 - Values of Indices of QFAL. Source by the authors ... 170
Table 47 - Values of Index Numbers of QFAL. Source by the authors ... 170
Table 48 - Fondo Immobiliare Alfa, Balance Sheet 1/2. Source: Dea Capital Real Estate SGR ... 193
Table 49 - Fondo Immobiliare Alfa, Balance Sheet 2/2. Source: Dea Capital Real Estate SGR ... 194
Table 50 - Fondo Immobiliare Alfa, Income Statement 1/2. Source: Dea Capital Real Estate SGR ... 195
Table 51 - Fondo Immobiliare Alfa, Income Statement 2/2. Source: Dea Capital Real Estate SGR ... 196
Table 53 - Spread sheet year 2002. Source by the authors ... 198
Table 54 - Spread sheet year 2003. Source by the authors ... 199
Table 55 - Spread sheet year 2004. Source by the authors ... 200
Table 56 - Spread sheet year 2005. Source by the authors ... 201
Table 57 - Spread sheet year 2006. Source by the authors ... 202
Table 58 - Spread sheet year 2007. Source by the authors ... 203
Table 59 - Spread sheet year 2008. Source by the authors ... 204
Table 60 - Spread sheet year 2009. Source by the authors ... 205
Table 61 - Spread sheet year 2010. Source by the authors ... 206
Table 62 - Spread sheet year 2011. Source by the authors ... 207
Table 63 - Spread sheet year 2012. Source by the authors ... 208
Table 64 - Spread sheet year 2013. Source by the authors ... 209
Table 65 - Spread sheet year 2014. Source by the authors ... 210
Table 66 - Spread sheet year 2015. Source by the authors ... 211
Table 67 - Spread sheet year 2016. Source by the authors ... 212
Table 68 - Spread sheet year 2017. Source by the authors ... 213
Table 69 - Spread sheet year 2018. Source by the authors ... 214
Table 70 - Values of Indices of QFARE. Source by the authors ... 215
Table 71 - Values of Index Numbers of QFARE. Source by the authors ... 215
Table 72 - Values of Indices of QFARI. Source by the authors ... 215
Table 73 - Values of Index Numbers of QFARI. Source by the authors ... 215
Table 74 - Values of Indices of QFATL. Source by the authors ... 215
Table 75 - Values of Index Numbers of QFATL. Source by the authors ... 216
Table 76 - Values of Indices of QFID. Source by the authors ... 216
Abstract
English
The real estate asset class is an important opportunity for investors. The development and specialisation of real estate financial products has seen a marked growth in recent decades, leading to the formation of new investment vehicles.
This thesis work aims to study the market of real estate funds, the most important indirect instrument in the Italian panorama. In particular, listed funds are the subject of research, as the supervisory authorities require them to publish quarterly management results. After an introduction to the economic context of reference, the thesis carries out a thorough examination of the variety of products, as traditional direct opportunities are combined with various indirect vehicles, including real estate funds and listed investment companies.
A section investigates the theory that shapes market indices and identifies the fundamental practices and concepts necessary to build effective and comprehensive indicators.
Finally, a case study analyses the performance of the listed real estate fund segment. By processing the information collected from the annual management reports of funds listed on the Milan Stock Exchange since 2002, the study theorises and constructs six indicators able to assess the market performance from six different perspectives.
Given the outputs of the market analysis, the thesis takes a further step in its research: among the listed real estate funds still active, it aims to identify those that show the best results. In this way, the performances of the individual funds are compared to those obtained from the entire market, and therefore to the indices previously calculated in a benchmarking analysis, showing profoundly negative sector performances.
This study highlights the difficulties of listed real estate funds, leading to reflect on the need to design solutions that address the critical issues encountered by the investment vehicle, to create a robust tool and able to meet the expectations of investors.
Italiano
L’asset class immobiliare costituisce un’importante opportunità per gli investitori. Lo sviluppo e la specializzazione dei prodotti finanziari immobiliari hanno visto una decisa crescita negli ultimi decenni, portando alla formazione di nuovi veicoli d'investimento. Il presente lavoro si pone come obiettivo lo studio del mercato dei fondi immobiliari, lo strumento indiretto più importante nel panorama italiano. In particolare, i fondi quotati rappresentano l’oggetto della ricerca, poiché le autorità di controllo impongono loro la pubblicazione trimestrale dei risultati di gestione.
Dopo un’introduzione al contesto economico di riferimento, la tesi svolge un esame approfondito della varietà di prodotti: le tradizionali opportunità dirette sono abbinate a diversi veicoli indiretti, tra cui i fondi immobiliari e le società d’investimento immobiliare quotate.
Segue lo studio dei principali indici di mercato, utili a valutare l’andamento del settore: questa sezione indaga la teoria che dà forma agli indici, individuando le fondamentali pratiche e i concetti necessari alla costruzione di indicatori efficaci e completi.
Infine, un caso studio analizza le performance del segmento dei fondi quotati. Grazie all’elaborazione delle informazioni raccolte dalle relazioni annuali di gestione dei fondi immobiliari quotati alla borsa di Milano dal 2002, lo studio teorizza e costruisce sei indicatori capaci di valutare le performance del mercato da sei diverse prospettive. Visti i risultati dell’analisi di mercato, la tesi compie un passo ulteriore: essa si propone di individuare, tra i fondi immobiliari quotati ancora attivi, quelli che mostrano i risultati migliori. In questo modo, le performance dei singoli fondi sono comparate a quelle ottenute dall’intero mercato, e quindi agli indici precedentemente calcolati in una vera e propria analisi di tipo benchmarking: la ricerca mostra performance di settore profondamente negative. Questo studio evidenzia le difficoltà del fondo immobiliare quotato, portando a riflettere sulla necessità di progettare soluzioni che pongano rimedio alle criticità riscontrate dal veicolo d’investimento, per creare uno strumento solido e capace di soddisfare le aspettative degli investitori.
Introduction
In recent years, the asset management sector has undergone a process of deep transformation that has allowed operators to offer their customers increasingly innovative products and services that can meet the growing demand for new financial products. The result is real estate funds that allow real estate investments, which by their nature take longer than investments in securities, to be transformed into shares in financial assets that allow the generation of cash without the investor having to buy a property directly. Present in Italy since 1998, this type of fund represents an interesting alternative to traditional investments, especially in those market phases in which the gradual reduction of interest rates makes it attractive to invest in real estate.
The present thesis work aims at investigating the Italian market of listed real estate funds, through the creation of six market indices.
Within the framework of investment management, indices are required to calculate periodic returns produced by the assets: these are necessary for several operations such as asset allocation and benchmarking analysis.
A wide number of studies has investigated the importance of the benchmarking process in the field of investment management, especially concerning shares, bonds and other traditional investment instruments. However, few of them have pinpointed the increasing importance that this methodology has progressively acquired in the real estate discipline. The present dissertation places itself right in this area of interest.
This study examines the construction of new indices for the listed real estate funds, based on significant characteristics related to the performances achieved by the funds. The analysis works with complete market coverage, taking into consideration the whole list of real estate funds that are listed on the Italian Stock Exchange.
The present work introduces some indicators with the aim of widening the perspective on the performance evaluation of real estate funds. The market indices are based on these indicators, allowing the assumption on a broader perspective on the theme of performance appraisal.
The market analysis shows evidence of negative trends that characterize the segment of listed real estate funds. This constitutes the basis for a further development of the present dissertation. This work was supposed to proceed with the elaboration of a detailed study
about the performance of a single fund, in order to compare the pattern of its indicators against the indices of the market in a pure benchmarking analysis. The empirical results obtained triggered a further objective: the analysis of the performance of the funds that are still in activity. The point of view assumed is the one of investors, who need to determine the most performing funds in which to allocate their finances.
The structure of the thesis is divided into ten chapters, each of them starting with a brief introduction that illustrates the content of the section. This guide the reader in the comprehension of the themes and helps him to keep in mind the direction of the work. The first chapter offers a wide description of the economic context, with a complete picture of the real estate sector at the end of year 2018. This overview opens with the outlook of the global trends and proceeds with the detailed description of the Italian panorama. This first chapter may be perceived as useless. However, it offers the opportunity to access the themes later discussed in a conscious, organic and coherent manner.
The second chapter describes the distinctive features that characterize real estate products and the reference market. The appraisal of real estate investments triggers the preliminary knowledge of the investment goods and the relative market on which they are traded, acknowledging their role in a more complex portfolio.
The third chapter presents the limitation of the direct real estate investment, offering the basis for the discussion of the indirect real estate investment, the object of chapter four. In this part, the most important investment vehicles are presented, depicting the instruments through which investors access the real estate market in an indirect way. Among them, Real Estate Investment Funds constitute the most important vehicle. For this reason, a full chapter is dedicated to them: chapter five.
Chapter six illustrates a fundamental aspect when dealing with investments: risk. This section decomposes the real estate investment risk in single components trying to offer a complete view of the theme.
Chapter seven represents the most important theoretical part, since it depicts the theory that shapes market indices and identifies the fundamental practices and concepts necessary to build effective and comprehensive indicators.
A case study analyses the performance of the listed real estate fund segment. By processing the information collected from the annual management reports of real estate funds listed on the Milan Stock Exchange since 2002, the study theorises and constructs six market indices, able to assess the market performance from six different points of view.
In detail, this case study starts with the complete description of the sample used for the construction of the indices. The sample is constituted by every listed fund. In the light of this, the indices have a complete market coverage. Subsequently, the indicators are illustrated, depicting their components and their significance. The source of the necessary information is constituted by the financial reports that funds, as listed entities, are supposed to publish periodically. Once the data has been extrapolated and obtained, the average is calculated, in order to obtain the trend of the performance of the sample. The construction of the index number is performed, describing their trend on the basis of the performance achieved by the sample.
In the light of this, a critical analysis of the results of the model is conducted.
The empirical evidence of the negative trends of the market performance constitutes the basis for a further development of the dissertation: among all the listed real estate funds that are still active, it aims to identify those that are characterized by the best performances. In this way, the results of the individual funds are compared to those obtained from the entire market, and therefore to the indices previously calculated in a benchmarking analysis.
1. Real Estate Market Overview
The first chapter of the dissertation aims at giving a broad picture of the real estate sector at the end of year 2018. The overview opens with an extended snapshot of the market and the current economic situation worldwide and continues with a brief insight on the status of this sector within Europe.
The second part of the chapter goes deeper in the analysis of the Italian real estate market, illustrating the general composition and giving a quick outlook of the scenario within the country. Thereafter, the work follows with the breakdown and description of the different asset classes that this sector displays, along with their peculiar features and performances in the last years, focusing on the two-year period 2017-2018.
This section, which may be seen as preliminary and useless, represents an important warm-up in order to enter the topics and themes later discussed in a conscious, organic and coherent way.
1.1 Global Market Overview
World economic activity, although holding up well, has become more uneven and shows signs of slowing down. The maturation of the world economic cycle, the disappearance of the support provided by expansionary monetary policies in the advanced economies and the impact of the tensions on tariffs between the United States and China weigh on world activity. At the same time, financial conditions remain accommodative in advanced economies, while remaining rigid for some emerging markets. Global trade growth slowed slightly and uncertainties about future trade relations increased. Looking ahead, global economic activity is expected to decelerate in 2019 and remain stable in the next two years.
Growth in the Euro Area declined further in the third quarter of 2018, mainly due to sector-specific trends. However, overall, it maintained good stability despite the slight contraction in some countries in the area. In the third quarter of the year, gross domestic product (GDP) slowed down mainly due to a temporary standstill in car production, mainly in Germany. In the United States, the growth rate continued to show good business
resilience, while in the United Kingdom GDP growth was robust, partly reflecting an increase in public spending; in the same period the Japanese economy contracted, largely due to temporary factors linked to natural disasters. Economic activity confirmed positive stability in China, but weakened significantly in emerging economies that had experienced financial turbulence in the previous part of the year.
In the third quarter of 2018, the GDP of the Euro Area grew by 0.6% in quarterly annualised terms, a slowdown compared to the growth of the previous quarter (1.7%). Within the Euro Area, Germany recorded a reversal of the trend with a change in GDP of -0.8% (1.8% in the previous quarter), again in quarterly annualised terms, while the growth of France's GDP accelerated by 1.6%.1
Core inflation measures remain generally contained, but domestic cost pressures have intensified in the face of high capacity utilisation and tighter labour market conditions. Looking ahead, core inflation is expected to increase in the medium term, supported by various factors including: the monetary policy measures of the European Central Bank (ECB), the continuing economic expansion and the more vigorous wage developments associated with this expansion.
At its monetary policy meeting on 13 December, the Governing Council decided to end net purchases of assets in December 2018, while keeping the interest rates on the main refinancing operations, marginal lending operations and overnight deposits of banks with the ECB unchanged at 0%, 0.25% and -0.4% respectively.
As regards the bond markets, on average in November the benchmark rate on the maturity of 10-year government bonds was 3.12% in the USA (3.15% in the previous month), 0.38% in Germany (0.46% in the previous month) and 3.41% in Italy (3.5% in the previous month and 1.75% twelve months before). The spread between the 10-year yield on Italian and German government bonds then rose to an average of 302 basis points in November.2
With reference to Italy, in the third quarter of 2018, GDP decreased by 0.1% compared to the previous quarter and increased by 0.7% compared to the third quarter of 2017.
1 Pwc (2019), Real Estate Market Overview
On the domestic demand side, national final consumption decreased by 0.1% compared to the previous quarter, while there was a 1.1% reduction in gross fixed capital formation. As far as foreign flows are concerned, exports of goods and services increased by 1.1% while imports increased by 0.8%.
In December 2018, the consumer confidence index, which measures the expectations of Italian households on the current state and economic forecasts, showed a negative percentage change of 3% compared to the values recorded at the beginning of the year. In the same way, the confidence index of Italian companies recorded a decrease of 8.1%, in particular the confidence climate decreased in the manufacturing sector by 6.1%, in the market services sector by 8.6% and in retail trade by 5.8%, while it increased by 2.5% only in the construction sector.
The unemployment rate in October 2018 increased slightly compared to the previous month to 10.6% (compared to 11% twelve months earlier). Youth unemployment (15-24 years old), rose compared to the previous period to 32.5% from 32.4% (34.6% a year earlier). The employment rate increased to 58.7% (58.1% a year earlier).3
1.2 European Real Estate Market Overview
In the third quarter of 2018, direct institutional investments in non-residential properties in Europe amounted to 69.2 billion Euros, for a total of 314.1 billion Euros over the last twelve months and in line with the previous twelve months.
Considering the transactions carried out in the period between the fourth quarter of 2017 and the third quarter of 2018, Germany and the United Kingdom confirm themselves as the main European markets, with 79.1 and 74.9 billion Euros respectively invested. These are followed by France with an investment volume of 34.8 billion Euros and Netherlands, which reached approximately 21.5 billion Euros in investments with an increase of 19% compared to the previous twelve months. Conversely, volumes traded in Spain and Sweden reached 16.2 and 10.7 billion Euros respectively, down 8% for the former and 28% for the latter. Italy recorded a loss of 15% compared to the twelve months preceding
the reference period with an investment volume of 9.3 billion Euros.4 As regards the type
of investments at European level, in the third quarter of 2018 approximately 27.4 billion Euros were invested in the office sector, representing approximately 40% of total transits. In the same period, the retail sector recorded 10.8 billion Euros in transactions, while the residential sector recorded 8.4 billion Euros, respectively about 16% and 12% of total transactions.5
In the industrial-logistics sector, 7.2 billion Euros were invested (about 10% of total transactions), while the tourism-reception sector accounted for 9%, with about 6.4 billion Euros transited.6
1.3 Italian Real Estate Market Overview
After three years of exceptional growth, with a record 2017, the real estate market in Italy suffered a setback last year. However, the outlook for 2019 is characterized by moderate optimism, considering a focal concept: the Italian real estate market remains well below the potentials linked to the real economy, so that, without the laces of the bureaucracy and with more appropriate financial instruments, the market could be three times larger than it currently is.
In the context of a slightly expanding European market in 2018, there are two main reasons for Italy to travel against this trend, despite a growing economy (although less than the partners of the Old Continent). The main role was played by the political uncertainty, which led to an increase of the spread and a slowdown in access to finance. Within a real estate market tied almost entirely to bank loans, the increase in the volatility of financial markets has weighted heavily, in addition to the fact that the foreign investors reduced their vivacity. Although in smaller measure, the other factor that slowed down the system was a lack of product, especially for logistics, offices and hotels.7
4 CBRE (2019), Europe Real Estate Market Outlook 2018 5 Duff and Phelps (2018), European Real Estate Market Study 6 Pwc (2019), Emerging Trends in Real Estate: Europe 2018
After a particularly performing 2017, the volume of real estate investments in 2018 reached 8,856 billion Euros, decreasing by 22%. In fact, 2017 represented an absolute record with investment for over 11 billion Euros. International investors still represent the transaction engine, not ceasing to show willingness to operate in our country, accounting for about 65%, declining from 76% in 2017.
The Logistics sector recorded investments for 1,112 billion Euros, -10% with respect to 2017, when the Logicor operation had set the industry record, weighting for about half of the total investments. Net of such distorting operation, the sector continued to perform well and the transacted volume is doubled compared to the previous year. The growth of e-commerce inexorably persists to affect the performance of the sector. The previsions for 2019 is confirmed in line with the previous year.
Looking at the Office sector, Milan confirms to be the favoured market, with invested capital of 2,077 billion Euros, while Rome confirms its position, perfectly aligned with respect to 2017 (about 1,111 billion Euros traded): these two cities persist to polarize the Italian market. The reduction in the invested volume and funding is affected by a generalized lack of development campaigns.
The Retail sector reacted in the best way to the decline of the market: it represents one of the most performing asset classes of the year, with investments of 2,243 billion Euros, although slightly decreased (-6%) compared to 2017. The transactions in this sector concerned mainly shopping malls, demonstrating the good performance of this segment in our country, due to a smaller stock (low competition and robust fundamentals). The Hotels sector collected 1,321 billion Euros of investments in 2018 (in line with 2017), promising to be the most positive asset class in 2019. In this year, solid growth concerning invested capital coming from international investors are expected, including large hotelier chains: Italy witnesses a concentration of important destinations for leisure and business, with luxury connotations: quality, performance levels and heterogeneity of segments are important characteristics of Italian tourism.
A survey by CBRE showed that the Italian political instability has negatively influenced the transactions, worrying investors in a more intense way with respect to the past, and that the limited availability of assets is seen as the first obstacle discouraging investments in Italy: a further demonstration that the country still suffers from a structural product
shortage. In addition, the perception of investors about the cost of properties represents the second main obstacle to acquisitions, while the lack of market transparency now worries fewer investors. Undoubtedly, the increase in the spread and the consequent problems of access to finance have weighted heavily on the performance of the year. The distribution of investments by sector did not show significant changes with respect to 2017. The Office sector, which maintained the primacy of capitals over the total invested during the year, reached a market share of 39%. The Retail gained market share, passing from 20% to 25%. The performance of the Hotels segment rose, from 12% to 15%. The Logistics sector increased from 11% to 14% and persists inexorably to grow, winning shares in the commercial market.8
1.3.1 Offices
In the first nine months of 2018, the Office sector reached approximately 1.6 billion Euros in investments, a decrease of about 40% compared to the volume of the previous nine months. Milan and Rome have represented, as usual, the reference markets for the sector. In Milan, the management sector continues to be the most important with a volume of investments of 1.3 billion Euros in the first nine months, corresponding to about 80% of the Italian office market.
Nevertheless, in the third quarter of 2018, the volume of investments in the Milanese market was about 520 million Euros, down 16% compared to the previous quarter. In fact, the market continues to suffer from the lack of quality product in which to invest despite more and more investors are trying to adapt to the change by reducing their target. The growing trend of domestic (mostly core) investors continues, reaching 45% of the total.
During the third quarter of 2018, the absorption in the management sector was equal to approximately 116,000 sqm, an increase of 3.9% compared to the previous quarter, reaching 307,500 square meters in the first nine months, an increase of 12.8% compared to the value recorded in the same period of 2017, equal to 272,600 sqm and in line with pre-crisis levels. The most sought-after offices for rentals are those with sizes between
1,000 and 5,000 sqm that in volume accounted for 52% of total absorption, all located in the suburbs and hinterland.
In the third quarter of 2018, the vacancy rate was 10.9%, down w.r.t. 12% in the same period of 2017.
Development activity remains dynamic: in the third quarter of 2018 approximately 16,000 sqm of new Symbiosis development offices were delivered, while the pipeline for the next two years amounts to approximately 330,000 sqm.
The prime fee in the Central Business District (CBD) of Milan, in the third quarter of the year, remained stable at 560 euro/sqm/year, as were the prime fees in the other submarkets.
Net prime and secondary yields also remained stable at 3.40% and 5.00% respectively. As regards the city of Rome, the office sector has seen a slowdown in investment, recording in the third quarter of 2018 a value of about 52 million Euros, down by about 75% compared to the previous quarter. The total volume since the beginning of the year has reached about 328 million Euros, down 65% from the 950 million euros recorded in the same period last year. Foreign capital covered 100% of the quarter, although domestic capital remains predominant throughout the year, accounting for about 71% of the total. In the third quarter of 2018, the level of absorption (30,932 sqm) was influenced for 40% by three main transactions (West Inner GRA, North Inner GRA and EUR Laurentina areas) for a total of about 12,000 sqm. The total absorption recorded in the first nine months of 2018 amounted to 113,850 sqm, down by about 12.5% compared to the same period of 2017. The Centre and the EUR remain the most dynamic areas, accounting for around 57% of total transactions in the quarter. The vacancy rate of 12.8% is slightly higher than in the same period last year. The pipeline of developments is slightly increasing, with the construction/renovation of about 130,000 sqm with delivery expected in 2019.
Raw rentals remain stable in the CBD at 420 euro/sqm/year and in the EUR at 340 Euros/sqm/year.
With regard to net prime yields, in the third quarter of 2018, the use of offices remained stable at 3.9% in Rome.
With reference to real estate values, in 2018 the average price of the thirteen main Italian cities fell by 1.5% for buildings for office use. Estimates for 2019 foresee a further reduction in the price of commercial properties of 1%, to fall by 0.3% in 2020 and increase by 0.2% in 2021.910
1.3.2 Retail
In the first nine months of 2018, the retail sector showed positive signs registering growth of 22% compared to the same period in 2017, with approximately 1.7 billion Euros in investments. In the third quarter, investment activity in the retail sector increased by 65% compared to the same period of 2017 and amounted to 532 million Euros. The demand for retailers confirms its solidity also with the opening in the Italian market of new flagship stores, not only in Milan and Rome but also in Venice. The sector that benefited from most of the volume invested in the retail sector was that of shopping centres, followed by high street, which confirms the positive trend, benefiting from high tourist flows especially in prime locations. However, demand could be more sustained if it did not take into account the negative perception by many foreign investors, especially Americans, due to experience in their domestic markets.
In terms of opening and expansion of the retail sector, 2018 confirms a good business with about 100,000 sqm opened in the first nine months of 2018 including a 19,200-sqm lifestyle sports centre in Salerno, a contemporary shopping of about 16,500 sqm and a 15,000-sqm retail park located in Olbia near the airport.
The pipeline of centres for sale is substantial, with some portfolios on the market and medium-large single assets, worth more than one billion Euros. In addition to the threat of online, in some markets, such as Milan, there is also the future competition of pipeline projects that negatively affects the perception of investors.
Milan and Rome are confirmed to be fundamental attractive poles for retailers, also thanks to the high tourist flows they benefit from. This led to a further increase in prime rents in the high street segment of both markets. In fact, as far as renting is concerned, rents are
9 GVA Redilco (2019), Italian Real Estate Market 10 CBRE (2019), Italy Real Estate Market Outlook
growing in the high street sector, with Milan reaching 7,000 Euros/sqm/year and Rome reaching 6,800 Euros/sqm/year.
In the third quarter of 2018, net prime yields remained stable at 3% for the high street sector, 4.9% for the shopping centre sector and 5.9% for the retail park sector, respectively.
With reference to real estate values, in 2018 the average price of the thirteen main Italian cities fell by 0.8% for properties for commercial use. Estimates for 2019 predict a further 0.4% drop in store prices, while for 2020 and 2021 prices are expected to rise by 0.2% and 0.6% respectively.11
1.3.3 Logistics
In the first nine months of 2018, investments in the logistical-industrial sector exceeded 600 million Euros, with a reduction of 30% compared to the same period last year where, however, the transaction of the Logicor portfolio had accounted for about half of the total invested in 2017. Investors are continuing to invest in new and innovative locations, giving space to non-prime ones as well.
The main users of logistics properties are third-party logistics companies (or 3PLs, external logistics service providers), with e-commerce operators placing themselves on the top step of the users' podium for the third quarter, followed by 3PLs.
After a start slowed down by a lack of quality products, the level of absorption in the third quarter of 2018 reached 509,601 sqm, up compared to the same period last year, bringing the total in the first nine months of the year to 1,172,373 sqm. The area of greatest interest is the Veneto that, in the Greater area, has seen the conclusion of a pre-let of an important multilevel. Milan and Bologna are confirmed as the most dynamic areas, while Rome continues to suffer from the lack of product availability. Buildings within 20,000 sqm are the preferred by users as they ensure a widespread presence in the area.
The positive trend of contraction of vacancy continues, with the rate falling to 3.3% as a result of the greater absorption of existing spaces compared to those released.
Milan's prime rent remained stable at 56 Euros/sqm/year compared to the previous quarter and in line with the values of Rome, which were also stable in the quarter. On the other hand, rents in secondary areas have risen by 46 Euros/sqm/year.
The high interest in logistics led to raw yields which, although stable over the quarter, contracted compared to the previous year, reaching 5.5% to date.1213
1.3.4 Residential
The activity recorded in 2018 confirmed what emerged in 2017: a robust interest toward Italy by investors and an increasing attractiveness of the Residential sector.
After the deep crisis that has hit this sector in the last decade, the Italian residential market is today slowly recovering. The Observatory of the Agenzia delle Entrate confirms this trend with a 6.7% increase in the number of real estate transactions with respect to the third quarter of 2017. According to the latest data released by the Italian Banking Association, the total amount of loans conferred to households also showed a positive change, with a +2.1% in the first ten months of 2018, mainly thanks to the favourable monetary policies developed by the European Central Bank.
The investment component is growing strongly, rising from 6.1% to 15.4% from 2017 to 2018. Two different paces are characterizing the Italian market: in fact, there are territories (Milan and Rome leading the group) where this sector is more dynamic and mature, unlike secondary cities and inland areas where, although slowly developing, this process is still in an embryonic phase.
Short-term rents have driven the growth of the market: the recent economic crisis and a society oriented towards new features as mobility and flexibility are increasingly pushing towards a market model not based on purchasing, but on renting for short periods, at least in prime segments. This new contract modality will be the most interesting since, unlike the more traditional form of long-term rents, it guarantees a lower risk and an annual occupancy rate of about 85%.
12 Pwc (2019), Real Estate market Overview (Italy 2018) 13 CBRE (2019), Italy Real Estate Market Outlook
The emergence of this phenomenon will force investors to re-evaluate the refurbishment of properties that are promising, especially in terms of location and typology, with a particular interest towards the buildings within the urban centres. The sector is expected to follow an exponential growth path, mainly due to two factors: firstly, the great unexpressed potential charactering Italian cities, and secondly, the strong latent demand coming from singles, young couples, workers, students, tourists looking for accommodation for short time periods. The new Information Technology platforms will support this process, by speeding up interactions between demand and supply and by exploiting new modalities of marketing or the promotion of products, with reduced transaction costs.
In parallel with the phenomenon of short rents, the sharing economy will completely change the living paradigm: the house will be conceived no longer as a ‘good’, but as a ‘service’, with sharing as a founding element of the new forms of housing.
Year 2018 confirms a growing interest towards the Italian alternative residential market, which starts to be conceived as a new asset class from the institutional investors’ point of view, who are increasingly interested in diversification opportunities for their portfolios. Among the formats of alternative residential, beyond the most consolidated markets of Senior Living and Student Housing, there are also those alternative typologies, like micro-living, residential rental (multi-family) and all those forms of co-housing where the drivers is not only the provision of additional services, but also the presence of spaces where it is possible to share experiences.
As the market demonstrated, the interest of investors has been expressed mainly through operations involving both primary cities such as Milan and secondary cities, for which the above-mentioned new formats represent a relaunch opportunity. This choice allows to diversify the portfolios both from a yield and geographical point of view, with the capital allocated not only in the first locations.
A greater focus on residential product characterized by alternative and quality features is expected, in order to meet an ever-increasing demand. Particular attention will be
dedicated to those formats currently existing only in green forms, such as residential rental and community-supporting services.141516
1.3.5 Hotel
Year 2018 has been another good year for investments addressing the Hotel sector, with about 1.32 billion Euros of transacted volume at the end of the year (1.36 billion Euros in 2017). The two-year period 2017-2018 is the most positive period in terms of invested volume of the last 20 years.
About 80% of investments in 2018 was focused on the four Italian primary markets: Milan, Rome, Venice and Florence (70% in 2017). The transactions were operated in the national main markets, which have outdone by far the performances recorded in the pre-crisis period. Most of these operations were based on a single asset, consistently with the traditional structure of the market: high degree of fragmentation in hotels ownership and management, mainly in the hands of local owners and families. The interest of international investors is still high, as they are convinced by the high and growing industry performance, attractive yields and reduced sector risk especially in primary markets.
The excellent performance of the Italian Hotel sector and the emergence of new opportunities enabling operations of reposition and re-brand are pushing investors to look for further alternatives, also in secondary locations and other typologies of hotels: resorts, hostels, etc.
The Italian demand for hotels registered an increasing trend in 2017, recording +2.8% in the hotels overnight stays in the country. The demand growth is a direct aftermath of the recovery of tourism, of which international visitors account for about 50% of the hotel nights in the country, reaching peaks in the primary markets (Venice 86%, Florence 74%, Rome and Milan 70%). This trend is stable in 2018 and a record volume is expected for 2019, with about 2.0 billion Euros of hotels transacted.
14 Savills Italy (2019), Commercial and Residential Real Estate
15 Bank of Italy (2018), Italian Housing Market Survey. Short-term Outlook 16 CBRE (2019), Europe Real Estate Market Outlook 2018
The growth of prime markets was on average +3% per year since 2007. This indicator highlights good health of the Italian Hotel market and gives space to secondary markets in addition to traditional destinations, where competition is now aggressive. In the primary markets of the country, there is a major redevelopment programme involving the hotel heritage, thanks to the entry of new brands and new structures that attract new segments with a high spending capacity.
The Hotel market in Italy is characterized by a marked presence of hotel structures that are managed directly by the owners (typically local families; these structures represent about 75% of structures), hotels leased to group of local operators, national and international groups (approximately 24% of the total assets) and a contained part through contracts with the HMA (Hotel Management Agreement) with international chains of the high segment and luxury (about 2%). The direct management and the HMA presuppose a specialized property in the Hotel sector, while in the case of rented hotels, the investment takes on the features of a core investment, whose financial return is guaranteed by the rental fee of underlying rent.
In the last couple of years, there has been an increasing interest in such type of investment, the so-called ‘income generating investment’, generated by the rent and guaranteed by it. In fact, the high performance of the main hotel markets at national level ensures a contained management risk and a sustainable rent. This reduces the expectation of a return on investment, reflecting the lower risk, as for other asset classes (this is also the case of the Office sector). In this sense, all the major European institutional players are looking with interest at the Italian Hotel market, seeking income generating investments.
The basic requirements for the execution of transactions by core investors are:
• The presence of important player of international relevance and high rating; • The sustainability of the rent (or guaranteed minimum);
• The presence of hotels operating or recently built (which could require restructuring capex, but nor development neither urban risk).
In this context, the net yields levels required by core investors may be less than 5.0% for prime positions, and are expected to decline in 2019, also in function of a limited offer for these types of investments.17
1.3.6 Alternatives 1.3.6.1 Student Housing
The Student Housing market represented one of the most active emerging sectors in Italy in 2018. The first private international structures have been inaugurated (TSH, Firenze Lavagnini) and new international investors have entered the market alongside the domestic ones to enrich an offer that traditionally has been often linked to university and religious institutions in Italy.
According to the CBRE Investor Intentions Survey in 2019, 32% of respondents believe that Student Housing is the segment of the residential market with the most development opportunities, followed by Senior Housing (25.2%) and luxury residential (15%). 68.8% of respondents believe that the Student Housing segment could become an important asset class on the Italian scene.
As a demonstration of the growing interest, in 2018 ‘The Class of 2020’, a pan-European think tank promoting initiatives to develop the sector, chose Italy to host the Class Conference 2018, and in 2019 Bologna will be the seat of the Regional Conference. The new urban development plan Milan 2030 aims to exploit urban voids to accommodate public and private urban functions, thanks to the university system as one of the drivers of urban development (50,000 new young people aged 19 to 34 expected by 2030), articulating housing supply by promoting temporary housing, rent facilities, and residences for students and young people. The projects of moving some of the poles of the University of Milan to the EXPO area, the development of the Politecnico as an international headquarter, in collaboration with other non-European universities, in the historic area of Leonardo and in the headquarters of Bovisa, the creation of a new campus at Bocconi University, clearly highlight the dynamism affecting the industry. Some international investors have begun to invest in the Milanese market, securing areas with
strong growth potential and attractiveness for students (Arexpo and Bocconi Area). Demand remains strong, but the market is struggling to get off the ground, as the existing facilities with over 250 beds, which generate some interest in international investors, are mainly owned by public or religious entities. Coupled with promising future prospects, this emerging interest has led The Class of 2020 to engage in the advisory project ‘Milano Urban Campus’ with the City of Milan, bringing together operators, investors, developers, to discuss the opportunities for recovery of four disused areas in Milan, providing guidance and recommendations for the purpose-built student accommodation (PBSA) sector development in the city.
Bologna, Florence, Turin and Rome, benefiting from the presence of nationally and internationally recognized universities, a high quality of life and numerous academic, business and entertainment opportunities, are now in the wake of Milan as interesting markets for investors and operators for the inauguration of facilities able to intercept international students with high spending capacity, but also often young professionals. Other secondary cities could however emerge soon in the Italian landscape, with a number of factors that could facilitate the entry of investors and operators and PBSA structures. Specifically:
• The presence of important universities with high ranking at national and international level;
• Good investment opportunities with the availability of areas at lower prices than the prime cities with good margin prospects;
• Monthly rates slightly lower than in the most attractive cities; • Tourist attractiveness.1819
18 CBRE (2019), Italy Real Estate Market Outlook 19 GVA Redilco (2019), Italian Real Estate Market
1.3.6.2 Healthcare
Low birth rates combined with increasingly long life expectancy are leading to a progressive ageing of European population. The median age in the EU-28 at 1 January 2017 was 42.8 years old, while Italy, which is the country with the oldest population together with the Germany, had an average age of 45.9 years (Eurostat data). In 2017, Italy had the highest old-age dependency ratio in Europe (34.8%), followed by Greece (33.6%), Finland (33.2%) and Portugal (32.5%) (Eurostat data).
This factor makes Italy one of the most attractive countries for the investors in the health sector, particularly in terms of concerns the Nursing Homes sector (Residenze Sanitarie Assistenziali, RSA).
From 2001 to 2014, the Healthcare market was mostly characterised by a lack of volume. At an early stage, the main fund managers focused on long-term operations involving the acquisition of small portfolios owned by operators of retirement homes or local developers. Since 2015, the market seems to be consolidated, with a significant increase in volumes compared to the previous year. The main reasons may be related to the entry of major investors specializing in health in the European panorama and at the beginning of Sale & Lease Back operations on large health care facilities.
In detail, AXA was one of the first investors to enter the field of ‘acute care’, thanks to S&LB operations with Policlinico di Monza in 2015 and with Humanitas in 2017. These two operations made AXA one of the most important players in the sector.
In 2017, Primonial, a leader in Healthcare investments, strengthened its presence in Italy, with two transactions with the Villa Maria Group.
In 2018, despite a contraction in volumes, new investors have chosen to allocate a good part of their own real estate assets in the healthcare sector. In the summer of 2018, Savills IM SGR set the SIF Fund, whose main shareholder is Cattolica: the fund has closed a first transaction with the Coopselios group, and it aims at continuing to invest in the sector in the coming years.20
1.3.7 NPLs
After a trend of constant growth and consolidation lasting over 5 years, the Italian market linked to impaired loans is living a phase of full maturity, with a wider than ever panel of investors currently active in the Non-Performing Loans (NPL) and Unlikely To Pay (UTP) markets. Alongside the U.S. funds and specialists present since 2014-2015 and the subsequent arrival of new players, previously active only in the rest of Europe, the last 12 months have also seen the arrival and consolidation of large industrial groups operating in the international market of deteriorated credit and the emergence of new realities. At the moment, it is possible to identify more than 50-60 institutional investors from all over the world, concretely focused and interested in the Italian market of NPL and UTP.
In 2018, recorded transactions accounted for a record amount of over 100 billion Euros. The past twelve months have confirmed the expectations of the end of 2017, which anticipated another consecutive year marked by growing volumes. Intesa Sanpaolo transactions were among the largest ones, with €10.8 billion involved in the joint venture with Intrum, and BancoBPM, which had already disposed of more than 5 billion Euros of non-performing loans. As a total, there were about 15 banking groups that sold over 1 billion of NPE in the year.
It is possible to forecast a consolidation of the volume of transactions around relevant figures in 2019, anyway unlikely to exceed the levels reached in the last 12 months, even considering the erosion of the stock of NPL (currently 130 billion Euros) and UTP (86 billion Euros) in the Italian banking system. However, the pipeline currently sees about 10 billion Euros of transactions at an advanced stage or already announced for next year. There are also factors that could potentially give further impetus to new disposals that have not been planned yet. The first may be renewed pressure on the capital ratios of Italian banks after the progressive deterioration in the capitalisation of all the major groups in the second quarter of 2018, with a return to volatility and with the FTSE Italian Banks index down by more than 25% since the beginning of the year. A second element could then be linked to the evolution of the regulations: some articles of the so-called ‘banking package’, approved by Ecofin in December 2018, could determine a lower
impact of the massive sales of NPLs (more than 20% of stock) for credit institutions, facilitating new deleveraging operations.
The challenges to be faced and the potential still to be expressed in this consolidated and mature market phase may also be linked to new sourcing channels: to meet the product demand, some investors have already focused their activities on smaller and more local banks and a growth in operations on the secondary market is expected, even for the secured segment. Another target may then be potential operations of corporate restructuring or acquisitions of groups in liquidation, processes in which the purchase of credit can become leverage (or the result) of a broader picture. The interest in exposures classified as Unlikely to Pay will also remain strong, both for transactions in the portfolio and mainly as single-name. Great attention will then be paid to the results brought by the management of the packages transited at the beginning of the current cycle (2014-2016), which by now will have potentially exceeded the initial part of the business plan, in which a large part of the recoveries estimated in the acquisition phase are often concentrated, with many operations that also tend to over-perform the plans.
The possibility of creating an additional product for real estate investments will also depend on the management activity and the strategies adopted for the exposures already transited: approximately 30 billion Euros Gross Book Value of transactions concerned guaranteed loans. In 2018, there were several transactions involving real estate assets sold as part of a credit workout (at best, with recovery of part of the equity) and purchased from institutional investors.2122
21 CBRE (2019), Italy Real Estate Market Outlook
2. Real Estate Goods and Market
The following chapter aims at describing the principal distinctive features that characterize real estate goods and the relative market on which they are traded. The analysis of real estate investments requires the knowledge of the investment products and of the reference market, pursuing the goals both of the estimation of their values and of their role in a more complex portfolio.
The chapter opens with the description of the peculiar features of the real estate assets, highlighting how some of them constitute a limitation from the investors’ point of view. A second part illustrates the elements that define the real estate market, establishing direct relationship with the characteristics of the goods depicted in the first section.
Some of the aspects specified may result obvious. However, they end up being very important within an organic explanation and a deep comprehension of the real estate market and its analysis.
2.1 Characteristics of Real Estate Goods
The particular features that characterize the real estate properties directly derive from the very nature of these goods, influencing the needs of investors and the legal framework by which they are regulated. The capital work realized by Martin Hoesli and Giacomo Morri in 201023 is determinant in the definition of nine essential characteristics related real estate
goods. Some of them can be perceived as obvious; however, they become crucial within the framework of real estate investments.
1. Immobility
This obvious characteristic engenders a non-negligible consequence: given the impossibility to move the good, it is inherently related to the local economy, which influences in a direct way the value of the asset. The value of a real estate asset is dependent on its ability to generate income. For this reason, properties must adapt to the
23 Hoesli M. and Morri G. (2010), Investimento immobiliare. Mercato, valutazione, rischio e portafogli,
specific function requested by the market. This fundamental feature is confirmed on a daily basis by the widespread operations performed by real estate operators.
2. Indestructible land
Urban land rent represents the manifestation, in terms of price, of the value that economic actors and households assign, explicitly or implicitly, to each site in the process of definition of their locational choice, for production or residential uses. It represents the economic value of a scarce resource, namely urbanised land endowed with general accessibility characteristics (to the centre, to specific facilities as railway stations, airports etc., to environmental like parks, green areas). Since land is an indestructible good, it is perfectly governed by the economic law: its value fluctuates over time according to the relationship between supply and demand. Ghost-towns are the clear example of excess of supply matched with a null demand.
3. Heterogeneity
It is evident that two different real estate products cannot be identic. Two lots of land can be similar considering the composition of the ground or their geographical location, but probably they will diverge in terms of destination of use, location, accessibility etc. This heterogeneity can be difficult to be controlled and the way in which it influences the market is evident: the non-standardization of real estate product is an obstacle to the creation of mature and structured market.
4. Location
This feature is a direct consequence of the immobility of the goods. It represents one of the fundamental elements that determine the value of the property. In this context, the concept of accessibility assumes a crucial importance. “For firms, high accessibility
means that they have easy access to broad and diversified markets for final goods and production factors, to information and to the hubs of international infrastructure. For people, accessibility to a central business district and therefore to jobs means that their commuting costs are minimal, while at the same time they enjoy easy access to a wide range of recreational services restricted to specific locations (e.g. theatre, museums,
libraries) and proximity to specific services (e.g. universities), without having to pay the cost of long-distance travels”24. The impact that urban transformations engender on the
value of land is crystal-clear.
5. Long-term investment
Three components characterize real estate a long-term investment: long lifecycle of buildings (indestructibility of land), juridical framework and investors purposes. The first has been previously explained in the text of this chapter. In order to understand the way in which the juridical system influences the timespan of the investment, it is sufficient to think about the high costs of trade (taxes, duties, etc.) that investors must sustain to acquire a property. Neglecting the case of the purchase of the first house, investors acquire real estate assets with the objective of a long-term horizon for their investments. Let’s consider the example of pension funds, insurance companies, or asset management companies: they have a buy and hold strategy, which allows to generate profits in the long run.
6. High unit value
Real estate assets entail a considerable unit value and investors require a large amount of money in order to perform their investments. The recourse to credit helps them to overcome this problem, although usually a relevant equity ratio is necessary. This condition is extremely different from financial markets where, through the use of the financial leverage, investors can easily speculate on titles even with a restricted capital. Later on, the text of this dissertation will show how listed real estate companies, mutual real estate funds and other investment vehicles overcome the limitation of this important characteristic.
7. Illiquidity
Illiquidity refers to the state of an asset that cannot be easily sold or exchanged for cash in short time. Illiquid assets are hard to be sold quickly because of a lack of ready and