1 POLITECNICO DI MILANO
Facoltà di Ingegneria Civile, Ambientale e Territoriale
POLO REGIONALE DI COMO
Master of Science in
Environmental and Land Use Engineering
CARBONACEOUS SPECIES IN PM10 AND PM2.5 IN LOMBARDY
Supervisor: Prof. Giovanni Lonati
Master graduation thesis by: Dang Nguyen Nhung Student id. number: 722075
i POLITECNICO DI MILANO
Facoltà di Ingegneria Civile, Ambientale e Territoriale
POLO REGIONALE DI COMO
Corso di Laurea Specialistica in
Ingegneria per l’Ambiente e il Territorio
SPECIE CARBONIOSE NEL PM10 E PM2.5 IN LOMBARDIA
Relatore: Prof. Giovanni Lonati
Tesi di laurea di: Dang Nguyen Nhung Matricola: 722075
ii
Acknowledgments
I would like to express the deepest gratitude to my supervisors, Prof. Giovanni Lonati who encouraged, guided and supported me from the initial to the final level, facilitated me to develop an understanding of the subject. His lectures, in class or during the thesis work, provide me not only with further environmental knowledge but also with the methodology to approach a data set of environmental measurements, thus to obtain information about environmental issues.
I offer my regards and blessings to Vietnamese and international friends who supported me in any respect during the completion of the project.
Lastly, I would like to show my thankfulness to my family who always supported me during my study life in Italy.
Torino, 10 July 2014
iii
TABLEOFCONTENTS
SUMMARY ... 1
1. INTRODUCTION ... 3
2. OC AND EC IN PARTICULATE MATTERS ... 10
3. MATERIALS AND METHODS ... 12
4. ANALYTICAL RESULTS ... 19
4.1 Assessment of OC and EC annual average concentrations at different sites ... 19
4.2 Assessment of temporal variability of OC and EC concentrations ... 21
4.3 Assessment of spatial distribution of OC and EC concentrations ... 27
4.4 Assessment of relative percentage of OC and EC in coarse and fine PM ... 31
4.5 Analysis of OC/EC ratio ... 35
4.6 EC tracer method ... 38
CONCLUSIONS ... 44
ANNEX ... 46
iv
LISTOFTABLES
Table 3-1: Abbadia Cerreto dataset ... 12
Table 3-2: Alpe San Colombano dataset ... 13
Table 3-3: Bosco Fontana dataset ... 13
Table 3-4: Brescia dataset ... 14
Table 3-5: Cantù dataset ... 14
Table 3-6: Como dataset ... 15
Table 3-7: Lodi dataset ... 15
Table 3-8: Mantova dataset ... 16
Table 3-9: Milano dataset ... 16
Table 3-10: Sondrio dataset ... 17
Table 3-11: Varese dataset ... 17
Table 3-12: Statistics of annual average of PM10 and PM2.5 concentrations (µgm-3) ... 18
Table 4-1: Statistic of annual average of OC and EC concentrations of PM10 (µgm-3) ... 19
Table 4-2: Statistic of annual average of OC and EC concentrations of PM2.5 (µgm-3). ... 19
Table 4-3: Summary of OC concentration in PM10 during warm and cold seasons (µgm-3) ... 21
Table 4-5: Summary of OC concentration in PM2.5 during warm and cold seasons (µgm-3) ... 22
Table 4-6: Summary of EC concentration in PM2.5 during warm and cold seasons (µgm-3) ... 22
Table 4-7: Main percentiles of annual average concentration of OC in PM10 (µgm-3) ... 27
v Table 4-8: Main percentiles of annual average concentration of EC
in PM10 (µgm-3) ... 28 Table 4-9: Main percentiles of annual average concentration of OC
in PM2.5 (µgm-3) ... 29
Table 4-10: Main percentiles of annual average concentration of EC
in PM2.5 (µgm-3) ... 30 Table 4-11: Partitioning of OC and EC: average annual percentage of
total OC and EC mass in coarse and fine size range (%) ... 31 Table 4-12: Seasonal partitioning of OC and EC: average percentage
of total OC and EC mass in PM2.5 samples (%) ... 33 Table 4-13: Statistics of OC/EC ratio in annual PM10 samples (µgµg -1) ... 35 Table 4-14: Statistics of OC/EC ratio in annual PM2.5 samples (µgµg -1) ... 36 Table 4-15: Statistics of OC/EC ratio in seasonal PM10 samples (µgµg -1) .... 36 Table 4-16: Statistics of OC/EC ratio in seasonal PM2.5 samples (µgµg -1) ... 37
Table 4-17: The average of OCPRIMARY and OC SECONDARY in PM10
and PM2.5 (µgm -3) ... 39 Table 4-18: Partitioning of OCPRIMARY and OCSECONDARY between
vi
LIST OF FIGURES
Figure 1-1: PM10 emission by sectors in Lombardy ... 4
Figure 1-2: PM2.5 emission by sectors in Lombardy ... 4
Figure 4-1: Annual average concentration of OC and EC ... 20
Figure 4-2: Seasonal variability of OC and EC in PM10 and PM2.5 during warm and cold seasons in diffirent sites ... 26
Figure 4-3: Main percentiles of annual average concentration of OC in PM10 ... 27
Figure 4-4: Main percentiles of annual average concentration of EC in PM10 ... 28
Figure 4-5: Main percentiles of annual average concentration of OC in PM2.5 ... 29
Figure 4-6: Main percentiles of annual average concentration of EC in PM2.5 ... 30
Figure 4-7: Partitioning of OC between coarse and fine size range ... 32
Figure 4-8: Partitioning of EC between coarse and fine size range ... 32
Figure 4-9: Seasonal partitioning of OC in coarse and fine size range ... 33
Figure 4-10: Seasonal partitioning of EC in coarse and fine size range ... 34
Figure 4-11: Scatterplots showing the linear relationships between OCPRIMARY concentration and PM10 and PM2.5 concentration. ... 42
1
SUMMARY
In Lombardy, the more industrialized region in Italy, the standard of air quality for particulate matter (PM) is frequently exceeded. PM10 (particles that are 10 µm or less in diameter) concentration is at present the legislative standard for particulate matter in Italy, as in the European Union. However, PM2.5 (particles that are 2.5 µm or less in diameter) data are introduced in most recent Air Quality Directive (Directive 2008/50/EC)– promulgated by the European Council – in prevision of an annual limit value entering into force in 2015.
In Italy, there is a lack of information on PM10 and PM2.5 which has been regularly monitored only in recent few years. In many other European countries, and in the United States, a great deal of PM10 monitoring takes place. On the contrary, very few measurements of PM2.5 have been carried out in Europe up to now and, according to the Directive 1999/30/CE, Member States of the European Community have to gather information on PM2.5 concentration at typical locations. Therefore, the assessment of PM2.5 and PM10 data in the most industrialized and populated area of Northern Italy may give a valuable contribution for legislative and environmental purposes.
In order to update and complete previous investigation, a measurement campaign of daily sampling of PM10 and PM2.5 has been carried out in several sites in Lombardy between 2005 and 2007, within the framework of the PARFIL project (PARticolato atmosferico Fine Lombardia). This project, funded by the Lombardy regional authorities, was intended to provide a detailed knowledge of the PM features in Lombardy by performing extended PM10 and PM2.5 sampling campaigns in different environments of the region (urban, traffic, rural and remote sites). The main aim was to complete the existing studies of some areas with more investigations, and to conduct some samplings in sites that were never investigated before. The PARFIL has been implemented by the Regional Authorities, coordinated by the Regional Environmental Agency (ARPA Lombardia) and developed by universities and research
establishments present on the region. This thesis uses one part of the PARFIL data set, focusing on the most relevant carbonaceous
species in PM, organic carbon (OC) and elemental carbon (EC) to compare OC and EC levels between different sites, to assess the temporal and spatial variation of OC and EC levels, to assess the fraction by which OC and EC are present in coarse and fine PM, to analyse the OC/EC ratio and to split OC total into OC primary and OC secondary by using EC tracer method.
2
SOMMARIO
In Lombardia, la regione più industrializzata d’Italia, il limite di qualità dell’aria per il particolato atmosferico (PM) è frequentemente superato. La concentrazione del PM10 (particelle con un diametro uguale o inferiore a 10 µm) è attualmente lo standard di misura del particolato. Tuttavia, i dati relativi al PM2.5 (particelle con un diametro uguale o inferiore a 2.5
µm) sono stati introdotti nella recente Direttiva sulla Qualità dell’Aria (Direttiva 2008/50/EC)–
promulgata dal Consiglio Europeo – in previsione di un valore limite annuale che entrerà in vigore nel 2015.
In generale in Italia c’è una limitata disponibilità di informazioni circa il PM10, ed il PM2.5 è stato monitorato solo negli ultimi anni. Tuttavia, in accordo alla Direttiva 1999/30/CE, gli Stati Membri dell’Unione Europea devono ottenere informazioni circa la concentrazione di PM2.5 a livello locale. Pertanto, l’acquisizione e la valutazione dei dati di PM2.5 e sul PM10 nelle zone più industrializzate e popolate del Nord Italia può dare un grande contributo sia a fini legislativi che ambientali.
Per aggiornare e completare le precedenti indagini, una campagna di misurazioni su campioni giornalieri di PM10 e PM2.5, facente parte del progetto PARFIL (PARticolato atmosferico Fine Lombardia), è stata effettuata in diverse zone in Lombardia dal 2005 al 2007. Questo progetto, finanziato dalle autorità regionali lombarde, ha lo scopo di fornire un conoscenza dettagliata sui valori del PM in Lombardia effettuando campionamenti sistematici a lungo termine di PM2.5 e PM10 in diverse aree della regione (urbane, trafficate, rurali e zone remote). Lo scopo principale è stato quello di completare gli studi esistenti in alcune aree con ulteriori indagini, e di condurre campionamenti in aree dove non erano mai state effettuate prima. PARFIL è stato implementato dalle Autorità Regionali, coordinato dall’Agenzia Regionale per l’Ambiente (ARPA Lombardia) e sviluppato dalle Università e dai centri di ricerca presenti nella regione. Questa tesi usa una parte dei dati acquisiti con il progetto PARFIL, concentrandosi sulle pìu rilevanti specie carboniose nel PM, carbonio organico (OC) e carbonio elementare (EC), comparandone i livelli tra le differenti aree, analizzandone la variabilità spaziale e temporale, valutandone la ripartizione tra i differenti tagli granulometrici del PM (frazione grossolana e frazione fine), e studiando il rapporto OC/EC utile per suddividere l’OC totale tra OC di origine primaria, ovvero direttamente rilasciato in atmosfera dalle sorgenti di emissione, ed OC secondario, che ha origine da processi di trasformazione chimico/fisica in atmosfera.
3
1. INTRODUCTION
Particulate matters (PM) is the general term used for a type of air pollutant which is not a specific chemical entity but is a mixture of particles of different sizes, compositions and properties, coming from different sources. They are, on one hand, defined as particles such as dust, dirt, soot, or smoke, which are large or dark enough to be seen with the naked eye while others, are so small and can only be detected using an electron microscope. Particle diameters may range from approximately 0,005 µm to 100 µm, although the suspended portion generally consists of particles less than 40 µm. Particles are further classified as primary or secondary in nature. Primary particles are those emitted directly from sources into the atmosphere, whereas secondary particles are formed through physical or chemical transformations that take place in the atmosphere.
Since the particle diameters span over a wide range, different terms are used when dealing with particles in a given size range. In particular, the term PM10 refers to particles that are 10 µm or less in diameter. PM10 is generally subdivided in to a fine fraction, 2,5 µm or less in diameter (PM2.5) and a coarse fraction, more than 2,5 µm in diameter. Primary PM10 may result from natural or human activities. Natural sources include windblown dust, sea spray and wildfires. Anthropogenic sources include fuel combustion, industrial processes and transportation. High temperature combustion sources contribute to the fine fraction of PM10, whereas particles produced by grinding activities or wind erosion are predominantly found in the coarse fraction. Secondary particles are predominantly found in the fine fraction and can also be of either natural or anthropogenic origin. The behavior of particulate matter in the atmosphere and its potential to affect human health and atmospheric visibility are dependent on the source type and on formation processes that particles undergo at the source or in the atmosphere.
Coarse particles or “inhalable coarse particles” have an aerodynamic diameter larger than 2,5 micrometers and smaller than 10 micrometers. They are found near roadways and dusty industries such as mechanical disruption (e.g. crushing, grinding, and abrasion of surfaces), evaporation of sprays, and suspension of dust.
Fine particles (PM2.5) have diameter that are 2,5 micrometers and smaller. They are found in smoke and haze and can be directly emitted from sources such as forest fires, or they can form when gas emitted from power plants, industries and automobile react in the air.
The particles come in many sizes and shapes and can be made up of hundreds of different chemicals. A distinction is also made between primary and secondary particles. The distinction depends upon the formation of particles in air. Some particles, known as primary particles are emitted directly from a source, such as construction sites, unpaved roads, fields, smokestacks or fires. Others form in complicated reactions in the atmosphere of chemicals such as sulfur dioxides and nitrogen oxides that are emitted from power plants, industries and automobiles. These particles, known as secondary particles, make up most of the fine particle pollution in the country.
Particulate matters are formed in an atmosphere by a transformation of gaseous emissions. The chemical and physical compositions of PM depend on location, weather and time of year. Particle pollution is made up of a number of components, including acids (such as nitrates and sulfates), organic chemicals, metals, and soil or dust particles.
4
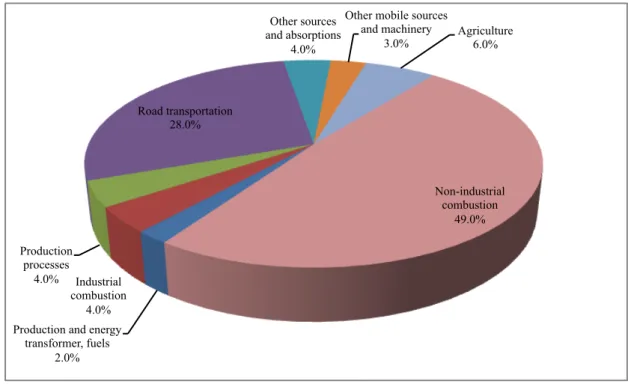
Production and energy transformer, fuels 2.0% Industrial combustion 4.0% Production processes 4.0% Road transportation 28.0% Other sources and absorptions 4.0%
Other mobile sources and machinery
3.0% Agriculture 6.0%
Non-industrial combustion
49.0%
Figure 1-1: PM10 emission by sectors in Lombardy
Source: INEMAR (Atmospheric Emission Inventory) – version 2010
Production and energy transformer, fuels 3.0% Industrial combustion 4.0% Production processes 2.0% Road transportation 25.0% Other sources and
absorptions 4.0% Other mobile sources
and machinery
3.0% Agriculture 4.0%
Non-industrial combustion
55.0%
Figure 1-2: PM2.5 emission by sectors in Lombardy
Source: INEMAR (Atmospheric Emission Inventory) – version 2010
PM10 is composed of aluminosilicate and other oxides of crustal elements, and major sources including fugitive dust from roads, industry, agriculture, construction and demolition, and fly ash from fossil fuel combustion. The lifetime of PM10 is from minutes to hours, and its travel distance varies from <1km to 10 km.
5 The major sources of PM2.5 are fossil fuel combustion, vegetation burning, and the smelting and processing of metals. Their lifetime is from days to weeks and travel distance ranges from 100s to >1000s km.
Anthropogenic sources can be divided into stationary and mobile sources. Stationary sources include those such as (US EPA, 2004):
1. Fuel combustion for electrical utilities, residential space heating, and industrial processes; 2. Construction and demolition;
3. Metals, minerals, and petrochemicals; 4. Wood products processing;
5. Mills and elevators used in agriculture; 6. Erosion from tilled lands;
7. Waste disposal and recycling.
Mobile sources include direct emissions of primary particulate matter and secondary particulate matter precursors from highway vehicles and non-road sources as well as fugitive dust from paved and unpaved roads.
Prescribed Burning and wildfires: As a matter of fact, combustion is the main anthropogenic
source of fine particles, with the vast majority of them included in the sub-micrometer range (Cattaneo et al., 2009). Prescribed burning is used as a tool for hazard reduction, site preparation, wildlife habitat improvement, disease and insect control and ecosystem maintenance (Smith and Stoneman, 1992). The rates of particle emission vary depending on the type of fuel and on the phase of combustion (flaming, smoldering, or a combination of the two). According to Lamn et al., 1992, 90% of particles from prescribed fires are less than 10µm in diameter and around 70% are less than 2.5µm in diameter. The fine fraction consists of approximately 40-70% organic carbon material, 2-15% graphitic carbon and the remainder inorganic ash material (Ward and Hardy, 1984).
Residential wood combustion: Most of particles emitted in wintertime in communities are
caused by residential wood combustion using woodstoves. Particles emitted from wood-stoves are reported to be less than 0.4µm in diameter and almost entirely in the fine fraction (Rau and
Huntzicker, 1984). Emissions of woodstove are predominantly consisting of organic carbon,
elemental carbon and sulfate, with trace amounts of potassium, chloride and nitrate. More than 100 different organic compounds have been identified in woodsmoke.
Transportation sources: Transportation has been identified as a large source of particulate
matter, generating emission through fuel combustion and engine wear. Motor vehicles also generate particulate matter through tire and brake wear and the resuspension of road dust. Both gasoline and diesel vehicles produce particle emissions that are most entirely smaller than 10µm in diameter and predominantly in the fine fraction. Measurements show that mass emission rates from diesel trucks are 6-100 times higher than those from gas automobiles (Hildemann et al., 1991a; NRCC, 1982; Williams et al., 1989), while noncatalyst cars emit more submicrometer particles than catalyst cars (Hildemann et al., 1991a).
Fossil fuel combustion: Boilers, heaters and furnaces associated with utilities, industry, and
commercial/institutional and residential establishments are means of fuel combustion. Emission from fuel combustion depends on many factors, including the type of fuel burned, the source type and the type of emission controls employed. Coal is burning fossil fuel characterized by high ash content. The combustion of coal is a large contributor of particulate matter in utilities
6 and industrial sectors. Emission depends on type of coal burned and its ash content. For example, combustion of low-ash coal produces less particulate matter than that of high-ash coal. Major chemical components of particulate matter from coal combustion include oxides of silicon, aluminum and iron, with lesser amounts of sulfur, magnesium, potassium and calcium. The predominant types of fuel oil burned by combustion sources are distillate oils and residual oils. Distillate oils are more volatile and less viscous than residual oils. They contain little nitrogen or ash and less than 0,3 % sulfur by weight and are used mainly in domestic and small commercial applications. In contrast, residual oils contain significant quantities of ash, nitrogen and sulfur. They are used in utility, industry and large commercial applications.
Characteristics of particles emitted from distillate oil fired boilers are typically carbonaceous in nature and dependent on the completeness of combustion. For residual oil combustion, emission is typically high in carbon and sulfur levels and depends on oil sulfur content. Usually, the combustion of distillate oils produces less particulate matter than that of heavier residual oils. Reduced boiler loads may also contribute to decreased particle emissions.
Nonferrous metal industries: Nonferrous industries refereed to processes in which metals
other than iron are smelted. This also includes the production of copper/ nickel, lead/zinc and aluminum. Emissions from copper smelters in particular have been found enriched in copper, arsenic, selenium, cadmium and indium. These characteristic chemical profiles have been used to identify the plumes and particulate matter from individual smelters (Small et al., 1981). Aluminum smelters, a source of vaporized organic compounds and sulfur dioxide, are sources of various particle fluorides (cryolite, aluminum fluoride, calcium fluoride, chiolite), alumina and ferric oxide. They are also involved in secondary particle production.
Pulp and paper industry: Cellulose is extracted from wood by dissolving the lignin that binds
the cellulose fibres together in wood pulping. Kraft, sulfite, neutral sulfite semi-chemical (NSSC) and soda (US EPA, 1992) are four major processes for chemical wood pulping. Kraft pulp mills generate particles that are primarily from the recovery furnace, the lime kiln and the smelt dissolving tank. They are mainly composed of sodium salts and some calcium salts from the lime kiln, and are caused by carryover of solids and sublimation and condensation of the inorganic chemicals.
Wood and wood-derived products industry: This industry includes sawmills and plywood and veneer manufacture. Plywood manufacturers are a source of both particulate matter and organic matter. This may also be a source of fugitive emissions as sawdust and other small wood particles, primarily from plywood cutting and sanding operations. (Source: NAAQ Objectives
For PM, 1999)
Due to the health effects of particulate matter, various governments have created regulations both for the emissions allowed from certain types of pollution sources (motor vehicles, industrial emissions etc.) and for the ambient concentration of particulates. Many urban areas in the U.S and Europe still frequently violate the particulate standards, though urban air on these continents has become cleaner, on average, with respect to particulates over the last quarter of the 20th century. Much of the developing world, especially Asia, exceed standards by such a wide margin that even brief visits to these places may be unhealthy.
With regard to limit values, European Union (EU) already introduced the new Directive which was adopted on 21 May 2008 including new air quality objectives for PM2.5 with annual target value 25 µm m-3. The target value entered into force from January 1, 2010 and limit value will
7 enter into force from January 1, 2015. This Directive still does not set the permitted exceedances each year for PM2.5. The limit value of PM10 is 50 µm m-3 for averaging period of 24-h (not to be exceeded more than 35 times a year) and 40 µm m-3 for annual averaging period
(the permitted exceedances each year is not available).
European Union PM10 PM2.5 since 1/1/2015
Yearly average 40 µg/m3 25 µg/m3
Daily average (24-hour) 50 µg/m3
Allowed number of
exceedences per year 35 None
Some other regulations on limit values in different countries are given below.
Australia
Australia PM10 PM2.5
Yearly average None 8µg/m3
Daily average (24-hour) 50 µg/m3 25 µg/m3
Allowed number of
exceedences per year None None
Canada
Canada PM10 PM2.5 since 1/1/2015
Yearly average 70 µg/m3 30 µg/m3
Daily average (24-hour) 120 µg/m3
Allowed number of
exceedences per year None
In Canada the standard for particulate matter is set nationally by the federal-provincial Canadian Council of Ministers of the Environment (CCME). Jurisdictions (provinces) may set more stringent standards. The CCME standard for PM2.5 is 30 µg/m3 (daily average, i.e. 24-hour period, 3 year average, 98th percentile).
Hong Kong
Hong Kong has set limits for particulates in the air as below:
Hong Kong PM10 PM2.5
Yearly average 50 µg/m3 35 µg/m3
Daily average (24-hour) 100 µg/m3 75 µg/m3
Allowed number of
8 Hong Kong has proposed new limits on particulates and is planning to enforce them around 2014. Proposed limit on PM10 is 50 µg/m3 yearly average and 100 µg/m3 daily average. Proposed limit on PM2.5 is 35 µg/m3 yearly average and 75 µg/m3 daily average. Both daily averages may be exceeded 9 times per year.
Japan
Japan has set limits for particulates in the air as below:
Japan PM10 PM2.5 since 21/9/2009
Yearly average None 15 µg/m3
Daily average (24-hour) 100 µg/m3 35 µg/m3
Allowed number of
exceedences per year None None
China
China has set limits for particulates in the air:
China PM10 since 1/1/2016 PM2.5 since 21/9/2009
Yearly average 40 µg/m3 15 µg/m3
Daily average (24-hour) 50 µg/m3 35 µg/m3
Allowed number of
exceedences per year None None
South Korea
South Korea has set limits for particulates in the air:
South Korea PM10 since 4/12/2006 PM2.5 since 1/1/2015
Yearly average 50 µg/m3 25 µg/m3
Daily average (24-hour) 100 µg/m3 50 µg/m3
Allowed number of
exceedences per year None None
United States
The Unites States Environmental Protection Agency (EPA) has set standards for PM10 and PM2.5 concentrations as below:
9
United States
PM10
daily limit since 1987 annual limit removed
since 2006
PM2.5
daily limit since 2006 annual limit since 1997
Yearly average None 15 µg/m3
Daily average (24-hour) 150 µg/m3 35 µg/m3
Allowed number of
exceedences per year 1 None
Concerning to limit value, the World Health Organization (WHO) recommended a guideline below:
WHO PM10 PM2.5
Yearly average 20 µg/m3 10 µg/m3
Daily average (24-hour) 50 µg/m3 25 µg/m3
In addition to guideline values, the Air Quality Guidelines provide interim targets for concentrations of PM10 and PM2.5 aimed at promoting a gradual shift from high to lower concentrations.
If these interim targets were to be achieved, significant reductions in risks for acute and chronic health effects from air pollution can be expected. Progress towards the guideline values, however, should be the ultimate objective.
The effects of PM on health occur at levels of exposure currently being experienced by many people both in urban and rural areas and in developed and developing countries – although exposures in many fast-developing cities today are often far higher than in developed cities of comparable size.
"WHO Air Quality Guidelines" estimate that reducing annual average particulate matter (PM10) concentrations from levels of 70 µg/m3, common in many developing cities, to the WHO
guideline level of 20 µg/m3, could reduce air pollution-related deaths by around 15%. However, even in the European Union, where PM concentrations in many cities do comply with Guideline levels, it is estimated that average life expectancy is 8.6 months lower than it would otherwise be, due to PM exposures from human sources.
In developing countries, indoor exposure to pollutants from the household combustion of solid fuels on open fires or traditional stoves increases the risk of acute lower respiratory infections and associated mortality among young children; indoor air pollution from solid fuel use is also a major risk factor for cardiovascular disease, chronic obstructive pulmonary disease and lung cancer among adults
10
2. OC AND EC IN PARTICULATE MATTERS
The chemical species found within the fine and coarse fractions vary significantly. The major components of the fine fractions include sulfate, nitrate, ammonium, and inorganic and organic carbon compounds. Carbonaceous PM (organic and elemental carbon species) typically is the first or second (after sulfate PM) largest contributor to PM mass concentration. Carbonaceous is also the aerosol component with the greatest difference in concentration between urban and remote monitoring location, giving it the distinction of being one of the most important locally-controllable PM components.
Carbonaceous aerosols, including organic (OC) and elemental (EC) carbon, are ubiquitous in the atmosphere and therefore contribute significantly to particulate matter, both the PM2.5 fraction and coarse (PM2.5-10) fraction, and they contribute to visibility degradation and climate forcing due to their ability to scatter and absorb solar radiation. Carbonaceous aerosols also adversely affect health. EC plays a significant role in climate forcing, and a recent review suggests that the climate warming effects of EC are greater than previously thought, although large uncertainties still exist. Characterizing and predicting the complex nature of OC and EC are challenging from both a measurement and modeling framework. However, this characterization is necessary given the importance of OC and EC to many atmospheric processes and climate impacts.
Inorganic or elemental carbon (EC) , also known as graphitic or black carbon, is a product of the incomplete combustion of carbon-based materials and fuels, and is solely primary in origin. The predominant sources of elemental carbon include fossil fuel combustion and biomass burning (Penner et al., 1993). Vehicle engine exhaust, also, is found to include elemental carbon which contributes to the formation of ultrafine particles (elemental carbon is a significant components of diesel exhaust).
Elemental carbon particles are typically less than 1 µm in diameter. Size distribution measurements of elemental carbon in ambient air and vehicular emissions have been found to exhibit a bimodal distribution with peaks in the range of 0,05-0,12 µm and 0,5-1,0 µm (Venkataraman and Friedlander, 1994). Because elemental carbon particles are both very small and very inert, they can remain in the atmosphere for extended periods before being removed by scavenging processes. This poses a potential health problem, as these particles can penetrate deeply into the lungs and act as adsorption sites for toxic pollutants. A characteristically large surface area together with its impurities makes elemental carbon the principal light-absorbing aerosol species, with the potential to affect both visibility and climate (Charlock and Sellers, 1980; Charlson et al., 1992). It is estimated that elemental carbonis responsible for more than 90% of light absorption and 25-45% of overall visibility reduction (Hamilton and Mansfield, 1991).
Ultrafine elemental carbon particles are formed primarily by the condensation of C2 molecules
generated during the combustion process; they can nucleate even at high temperatures because of their very low equilibrium vapor pressure (Kittelson, 1998); Morawska et al., 1998).
Organic carbon (OC) particles can be directly released to the atmosphere or produced via secondary to-particle conversion processes. The dependence of an organic compound’s gas-aerosol partitioning on temperature and gas-aerosol composition has the effect of blurring the
11 distinction between primary and secondary aerosol formation. For example, gases may be emitted that will partition largely to particulate matter (or condense onto the surfaces of buildings and vegetation) once they have cooled to ambient temperature. A lower temperature emission of the same chemical may result in particulate formation at the point of emission (PM2.5 Report Canada, 2004). Organic carbon is predominantly found in the fine fractions. In several studies in United States, meat-cooking operations, paved road dust and fireplaces have been estimated to account for more than 50% of fine organic carbon particle emissions in an urbanized area, and the associated organic species have been found to number in the hundreds. Both biogenic and anthropogenic sources contribute to primary and secondary organic
particulate matter. The total particulate organic matter (POM) is composed by a primary fraction (POMP) and a
secondary fraction, well known as secondary organic aerosol (SOA). Since no direct chemical analysis method to discriminate the secondary components of the particulate organic matter is available, several indirect methods such as elemental carbon tracer methosc (Chu and Macias, 1981; Wolff et al., 1983; Novakov, 1982; Gray et al., 1986; Huntzicker et al., 1986; Turpin, 1991; Turpin and Huntzicker, 1995; Strader et al., 1999; Cadaba et al., 2004), receptor modeling (Schauer et al., 1996; Schauer and Cass, 2000; Zheng et al., 2002) and chemical transport modeling (Pandis et al., 1992; Hildemann et al., 1993; Strader et al., 1999; Yu et al., 2004) are employed to estimate the amount of primary and secondary components. Among theses methods, EC tracer methods used in this thesis relies on ambient measurements only.
12
3. MATERIALS AND METHODS
The Lombardy region is not an homogenous territory, both from a geographical and PM’s emissions standpoint. Geographically, from North to South the region could be split up into three parts. In the northern part there are Alps and a typical alpine environment; moving southwards there are the Prealps, characterized by a lower height and a larger number of important towns; finally in the southern part, there is the Pianura Padana, a wide plane cut for its longitude by Po river which also states the border of the region. About PM emissions, the situation of the major contributors is also variable, some important urban areas are characterized by larger contribution due to vehicle traffic emissions, some others are known to have more contributes to PM belonging from industrial sources, depending on the human activities present on the specific territory. Each dataset present in the ARPA database is related to one site and each site has been retained representative of one specific area of the region.
Different types of analysis were conducted on the PM samples collected: carbonaceous elements (EC, OC), inoic species (nitrate, sulfate, chloride and ammonium) and trace elements (Al, Si, S, Cl, K, Ca, Ti, V, Cr, Mn, Fe, Ni, Cu, Zn, Br, Pb). Carbonaceous elements were detected by means of the Thermal Optical Transmittance method.
Data main charactersitics are resumed in the tables 3-1 – 3-11 Table 3-1: Abbadia Cerreto dataset
Sampling site Abbadia Cerreto
Type of environment Description
PM2.5 PM10
Sampling period From 11/08/05 to 16/06/07 From 08/08/05 to 12/06/07 Number of PM measurement
Warm season Cold season
Carbonaceous species
Number of sampling days 23 28
Warm season 8 10
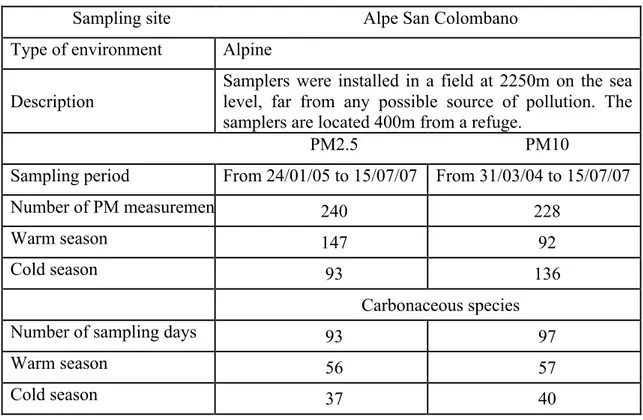
13 Table 3-2: Alpe San Colombano dataset
Sampling site Alpe San Colombano
Type of environment Alpine Description
Samplers were installed in a field at 2250m on the sea level, far from any possible source of pollution. The samplers are located 400m from a refuge.
PM2.5 PM10
Sampling period From 24/01/05 to 15/07/07 From 31/03/04 to 15/07/07
Number of PM measurement 240 228
Warm season 147 92
Cold season 93 136
Carbonaceous species
Number of sampling days 93 97
Warm season 56 57
Cold season 37 40
Table 3-3: Bosco Fontana dataset
Sampling site Bosco Fontana
Type of environment Rural Description
Samplers were installed next to the air quality monitoring station located inside a natural reserve 8km from Mantova.
PM2.5 PM10
Sampling period From 13/04/04 to 24/07/07 From 13/01/04 to 29/07/07
Number of PM measurement 174 211
Warm season 152 133
Cold season 22 78
Carbonaceous species
Number of sampling days 25 59
Warm season 1 7
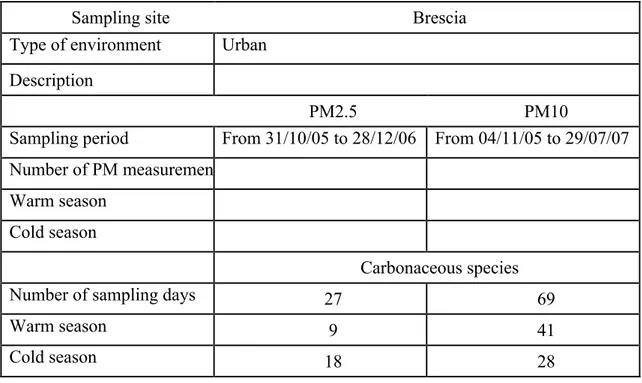
14 Table 3-4: Brescia dataset
Sampling site Brescia
Type of environment Urban Description
PM2.5 PM10
Sampling period From 31/10/05 to 28/12/06 From 04/11/05 to 29/07/07 Number of PM measurement
Warm season Cold season
Carbonaceous species
Number of sampling days 27 69
Warm season 9 41
Cold season 18 28
Table 3-5: Cantù dataset
Sampling site Cantù
Type of environment Urban
Description
Samplers were installed inside the air quality monitoring station’s fenced area, in a small park. Along one side of the park there is a street with scarce traffic. In the area there are some industrial and craft activities related to woodworking, especially for furniture production.
PM2.5 PM10
Sampling period From 01/04/04 to 28/06/07 From 08/04/04 to 30/06/07
Number of PM measurement 451 508
Warm season 220 263
Cold season 231 245
Carbonaceous species
Number of sampling days 87 108
Warm season 50 59
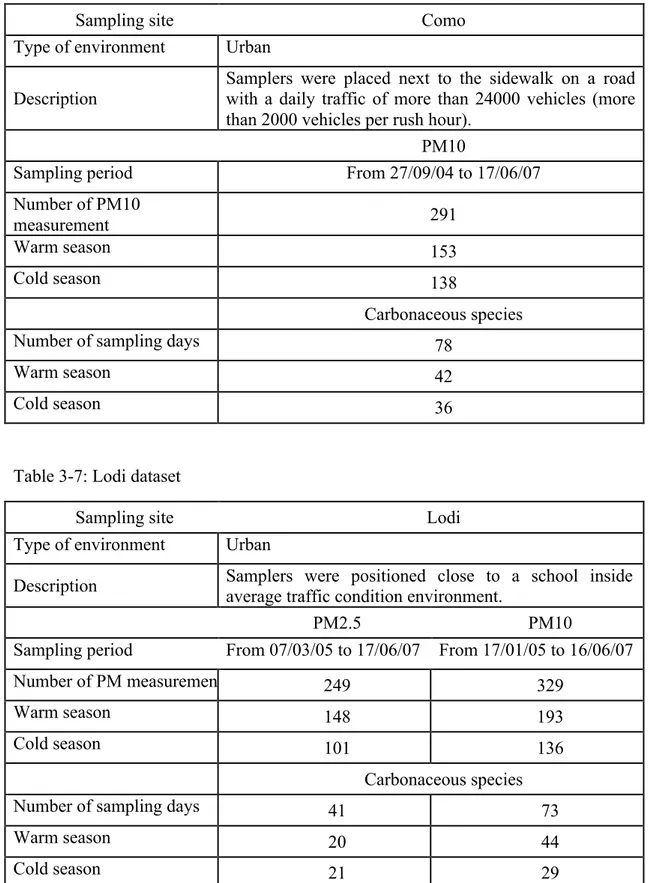
15 Table 3-6: Como dataset
Sampling site Como
Type of environment Urban Description
Samplers were placed next to the sidewalk on a road with a daily traffic of more than 24000 vehicles (more than 2000 vehicles per rush hour).
PM10
Sampling period From 27/09/04 to 17/06/07
Number of PM10
measurement 291
Warm season 153
Cold season 138
Carbonaceous species
Number of sampling days 78
Warm season 42
Cold season 36
Table 3-7: Lodi dataset
Sampling site Lodi
Type of environment Urban
Description Samplers were positioned close to a school inside an average traffic condition environment.
PM2.5 PM10
Sampling period From 07/03/05 to 17/06/07 From 17/01/05 to 16/06/07
Number of PM measurement 249 329
Warm season 148 193
Cold season 101 136
Carbonaceous species
Number of sampling days 41 73
Warm season 20 44
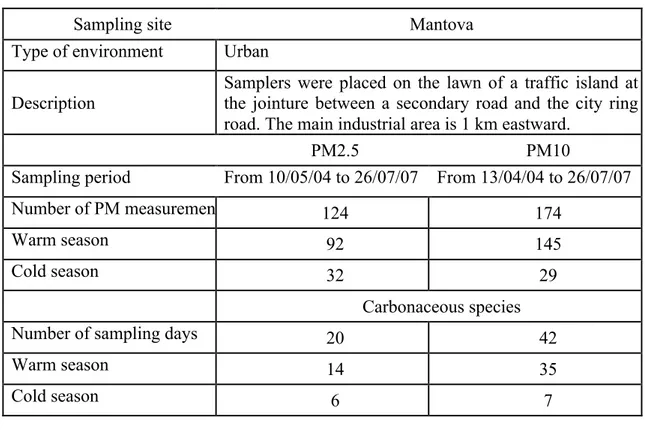
16 Table 3-8: Mantova dataset
Sampling site Mantova
Type of environment Urban Description
Samplers were placed on the lawn of a traffic island at the jointure between a secondary road and the city ring road. The main industrial area is 1 km eastward.
PM2.5 PM10
Sampling period From 10/05/04 to 26/07/07 From 13/04/04 to 26/07/07
Number of PM measurement 124 174
Warm season 92 145
Cold season 32 29
Carbonaceous species
Number of sampling days 20 42
Warm season 14 35
Cold season 6 7
Table 3-9: Milano dataset
Sampling site Milano
Type of environment Urban
Description
Samplers were positioned inside the gardens of the Politecnico di Milano university. The site is surrounded by streets with low traffic volume which changes to a high volume only during rush hours. On one of the surrounding streets there is a tran’s line.
PM2.5 PM10
Sampling period From 17/01/05 to 01/07/07 From 25/02/05 to 30/06/07
Number of PM measurement 331 463
Warm season 170 238
Cold season 161 225
Carbonaceous species
Number of sampling days 79 114
Warm season 38 46
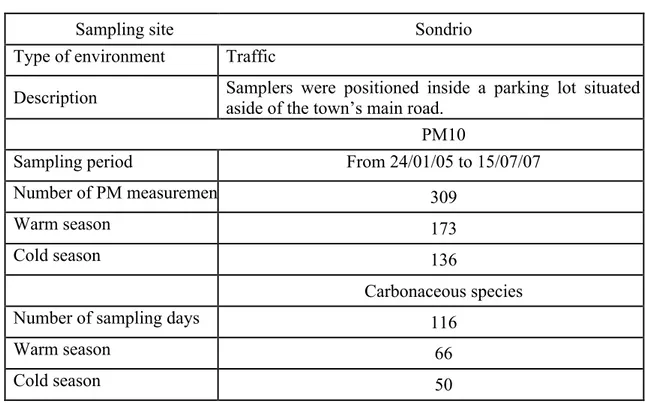
17 Table 3-10: Sondrio dataset
Sampling site Sondrio
Type of environment Traffic
Description Samplers were positioned inside a parking lot situated aside of the town’s main road. PM10
Sampling period From 24/01/05 to 15/07/07
Number of PM measurement 309
Warm season 173
Cold season 136
Carbonaceous species
Number of sampling days 116
Warm season 66
Cold season 50
Table 3-11: Varese dataset
Sampling site Varese
Type of environment Urban
Description
Samplers were positioned on the terrace of the Varese Province Department building. Samplers were taken at a height of 4m and the terrace is in front of a street with low traffic volume.
PM2.5 PM10
Sampling period From 10/05/04 to 02/07/07 From 10/05/04 to 11/03/07
Number of PM measurement 361 377
Warm season 178 177
Cold season 183 200
Carbonaceous species
Number of sampling days 29 76
Warm season 0 29
Cold season 29 47
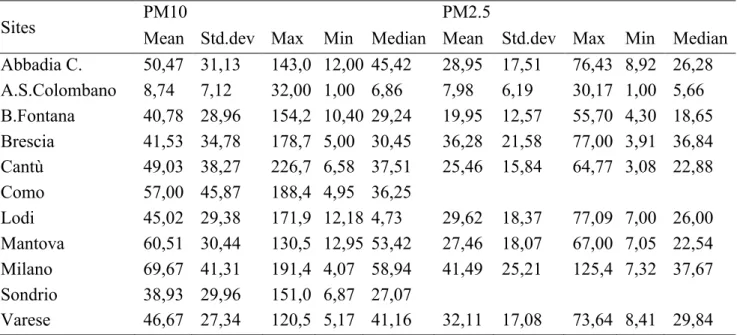
18 The statistics of annual average of PM10 and PM2.5 concentrations are shown in Table 3-12. Table 3-12: Statistics of annual average of PM10 and PM2.5 concentrations (µgm-3)
Sites PM10 Mean Std.dev Max Min Median Mean Std.dev Max Min Median PM2.5 Abbadia C. 50,47 31,13 143,0 12,00 45,42 28,95 17,51 76,43 8,92 26,28 A.S.Colombano 8,74 7,12 32,00 1,00 6,86 7,98 6,19 30,17 1,00 5,66 B.Fontana 40,78 28,96 154,2 10,40 29,24 19,95 12,57 55,70 4,30 18,65 Brescia 41,53 34,78 178,7 5,00 30,45 36,28 21,58 77,00 3,91 36,84 Cantù 49,03 38,27 226,7 6,58 37,51 25,46 15,84 64,77 3,08 22,88 Como 57,00 45,87 188,4 4,95 36,25 Lodi 45,02 29,38 171,9 12,18 4,73 29,62 18,37 77,09 7,00 26,00 Mantova 60,51 30,44 130,5 12,95 53,42 27,46 18,07 67,00 7,05 22,54 Milano 69,67 41,31 191,4 4,07 58,94 41,49 25,21 125,4 7,32 37,67 Sondrio 38,93 29,96 151,0 6,87 27,07 Varese 46,67 27,34 120,5 5,17 41,16 32,11 17,08 73,64 8,41 29,84
19
4. ANALYTICAL RESULTS
4.1 Assessment of OC and EC annual average concentrations at different sites
The presence of organic carbon (OC) and elemental carbon (EC) was considered for the chemical characterization of PM10 and PM2.5 samples. Summary statistics of organic carbon and elemental carbon daily average concentrations from 2005 to 2007 are given in Table 4-1 and 4-2.
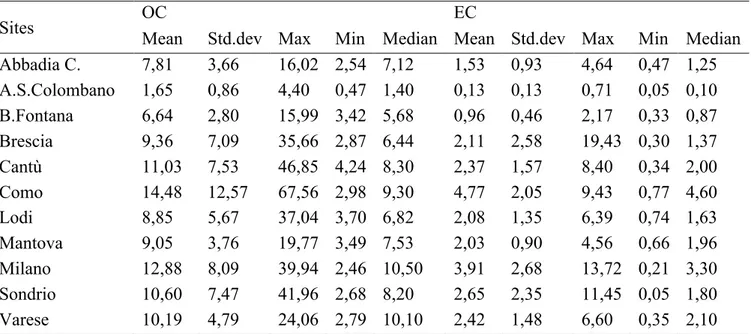
Table 4-1: Statistic of annual average of OC and EC concentrations of PM10 (µgm-3)
Sites OC EC
Mean Std.dev Max Min Median Mean Std.dev Max Min Median Abbadia C. 7,81 3,66 16,02 2,54 7,12 1,53 0,93 4,64 0,47 1,25 A.S.Colombano 1,65 0,86 4,40 0,47 1,40 0,13 0,13 0,71 0,05 0,10 B.Fontana 6,64 2,80 15,99 3,42 5,68 0,96 0,46 2,17 0,33 0,87 Brescia 9,36 7,09 35,66 2,87 6,44 2,11 2,58 19,43 0,30 1,37 Cantù 11,03 7,53 46,85 4,24 8,30 2,37 1,57 8,40 0,34 2,00 Como 14,48 12,57 67,56 2,98 9,30 4,77 2,05 9,43 0,77 4,60 Lodi 8,85 5,67 37,04 3,70 6,82 2,08 1,35 6,39 0,74 1,63 Mantova 9,05 3,76 19,77 3,49 7,53 2,03 0,90 4,56 0,66 1,96 Milano 12,88 8,09 39,94 2,46 10,50 3,91 2,68 13,72 0,21 3,30 Sondrio 10,60 7,47 41,96 2,68 8,20 2,65 2,35 11,45 0,05 1,80 Varese 10,19 4,79 24,06 2,79 10,10 2,42 1,48 6,60 0,35 2,10 Table 4-2: Statistic of annual average of OC and EC concentrations of PM2.5 (µgm-3)
Sites OC Mean Std.dev Max Min Median Mean Std.dev Max Min Median EC Abbadia C. 6,01 2,94 13,47 2,80 4,82 1,12 0,67 2,58 0,39 0,88 A.S.Colombano 1,77 0,94 4,57 0,49 1,47 0,13 0,10 0,42 0,05 0,08 B.Fontana 4,20 1,32 7,69 2,30 4,03 0,70 0,40 1,73 0,25 0,54 Brescia 9,19 4,79 22,81 4,25 7,72 1,97 1,78 10,07 0,28 1,47 Cantù 7,02 3,70 18,06 2,57 5,52 1,64 1,09 6,32 0,20 1,41 Como Lodi 6,34 4,07 20,76 2,12 4,73 1,67 1,40 6,67 0,20 1,40 Mantova 5,38 2,71 11,86 2,62 3,96 1,26 0,61 2,25 0,39 1,15 Milano 8,73 5,47 32,80 3,06 6,82 3,18 1,95 10,19 0,73 2,65 Sondrio Varese 9,15 3,00 19,07 4,56 8,83 2,13 0,75 3,93 0,75 2,05 OC mean concentration to PM10 ranges from 1,65 µgm-3 (A.S. Colombano, alpine environment) to 14,48 µgm-3 (Como, traffic environment). With the only exception of A.S.
Colombano in which both OC, EC concentrations in PM10 and PM2.5 are much smaller, these levels in other sites (most of them are classified as urban areas) are respectively not much
20 different. It can be observed that OC mean contributions in PM2.5 are reduced by 20-40% with respect to PM10, with concentration levels ranging from 1,77 µgm-3 (A.S.Colombano) to 8,73
µgm-3 (Milano) on annual basis. (see Figure 4.1). EC mean contribution to PM10 varies from
0,13 µgm-3 (A.S.Colombano) to 4,77 µgm-3 (Como) while in PM2.5 ranges from 0,13 µgm-3 (A.S.Colombano) to 3,18 µgm-3 (Milano).
Considering PM10 and PM2.5 analysis, A.S.Colombano differs from the other sampling sites: the concentration is between 5 to 40 times lower.
Figure 4-1: Annual average concentration of OC and EC
0 5 10 15 20 25 30
Abbadia Colombano Fontana Brescia Cantù Como Lodi Mantova Milano Sondrio Varese
Co n ce n tr at io n ( µ g m -‐3 )
Annual average concentration of OC
PM10 PM2.5 0 2 4 6 8
Abbadia Colombano Fontana Brescia Cantù Como Lodi Mantova Milano Sondrio Varese
Co n ce n tr at io n ( µ g m -‐3 )
Annual average concentration of EC
PM10 PM2.5
21
4.2 Assessment of temporal variability of OC and EC concentrations
The analysis of seasonal data points out relevant differences in concentration levels between warm and cold seasons (from April to September and from October to March).
The dataset of organic carbon and elemental carbon in warm and cold season is performed in Table 4-3 – 4-6.
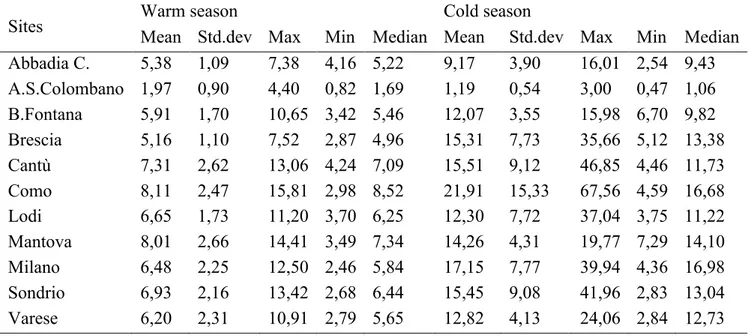
Table 4-3: Summary of OC concentration in PM10 during warm and cold seasons (µgm-3)
Sites Warm season Cold season
Mean Std.dev Max Min Median Mean Std.dev Max Min Median Abbadia C. 5,38 1,09 7,38 4,16 5,22 9,17 3,90 16,01 2,54 9,43 A.S.Colombano 1,97 0,90 4,40 0,82 1,69 1,19 0,54 3,00 0,47 1,06 B.Fontana 5,91 1,70 10,65 3,42 5,46 12,07 3,55 15,98 6,70 9,82 Brescia 5,16 1,10 7,52 2,87 4,96 15,31 7,73 35,66 5,12 13,38 Cantù 7,31 2,62 13,06 4,24 7,09 15,51 9,12 46,85 4,46 11,73 Como 8,11 2,47 15,81 2,98 8,52 21,91 15,33 67,56 4,59 16,68 Lodi 6,65 1,73 11,20 3,70 6,25 12,30 7,72 37,04 3,75 11,22 Mantova 8,01 2,66 14,41 3,49 7,34 14,26 4,31 19,77 7,29 14,10 Milano 6,48 2,25 12,50 2,46 5,84 17,15 7,77 39,94 4,36 16,98 Sondrio 6,93 2,16 13,42 2,68 6,44 15,45 9,08 41,96 2,83 13,04 Varese 6,20 2,31 10,91 2,79 5,65 12,82 4,13 24,06 2,84 12,73
Table 4-4: Summary of EC concentration in PM10 during warm and cold seasons (µgm-3)
Sites Warm season Mean Std.dev Max Min Median Mean Std.dev Max Min Median Cold season Abbadia C. 0,92 0,49 2,24 0,47 0,82 1,86 0,96 4,64 0,54 1,91 A.S.Colombano 0,15 0,15 0,71 0,05 0,11 0,10 0,08 0,38 0,05 0,05 B.Fontana 0,88 0,42 1,83 0,32 0,80 1,51 0,40 2,17 1,16 1,38 Brescia 1,08 0,56 2,61 0,30 0,96 3,57 3,50 0,50 19,43 2,71 Cantù 1,62 0,92 4,21 0,34 1,38 3,26 1,72 8,40 0,34 2,82 Como 3,70 1,45 6,99 0,77 4,02 6,01 1,95 9,43 1,91 6,16 Lodi 1,47 0,72 3,57 0,74 1,20 3,03 1,54 6,39 1,01 2,77 Mantova 1,87 0,76 3,59 0,66 1,86 2,84 1,15 4,56 1,46 2,20 Milano 2,21 1,14 6,14 0,21 2,04 5,05 2,82 13,72 1,44 4,44 Sondrio 1,50 0,67 3,68 0,05 1,49 4,14 2,88 11,45 0,05 3,75 Varese 1,47 0,75 3,58 0,36 1,29 3,05 1,51 6,60 0,61 2,75
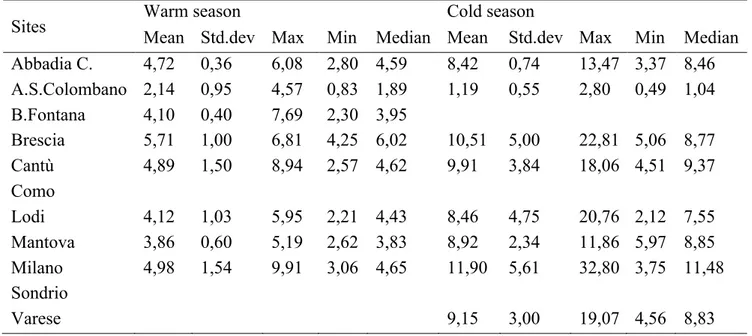
22 Table 4-5: Summary of OC concentration in PM2.5 during warm and cold seasons (µgm-3)
Sites Warm season Cold season
Mean Std.dev Max Min Median Mean Std.dev Max Min Median Abbadia C. 4,72 0,36 6,08 2,80 4,59 8,42 0,74 13,47 3,37 8,46 A.S.Colombano 2,14 0,95 4,57 0,83 1,89 1,19 0,55 2,80 0,49 1,04 B.Fontana 4,10 0,40 7,69 2,30 3,95 Brescia 5,71 1,00 6,81 4,25 6,02 10,51 5,00 22,81 5,06 8,77 Cantù 4,89 1,50 8,94 2,57 4,62 9,91 3,84 18,06 4,51 9,37 Como Lodi 4,12 1,03 5,95 2,21 4,43 8,46 4,75 20,76 2,12 7,55 Mantova 3,86 0,60 5,19 2,62 3,83 8,92 2,34 11,86 5,97 8,85 Milano 4,98 1,54 9,91 3,06 4,65 11,90 5,61 32,80 3,75 11,48 Sondrio Varese 9,15 3,00 19,07 4,56 8,83
Table 4-6: Summary of EC concentration in PM2.5 during warm and cold seasons (µgm-3)
Sites Warm season Cold season
Mean Std.dev Max Min Median Mean Std.dev Max Min Median Abbadia C. 0,83 0,36 1,66 0,39 0,75 1,68 0,74 2,58 0,75 1,72 A.S.Colombano 0,17 0,12 0,42 0,05 0,13 0,08 0,06 0,24 0,05 0,05 B.Fontana 0,68 0,40 1,73 0,25 0,53 Brescia 1,04 0,51 1,82 0,28 0,99 2,42 2,00 10,07 0,58 1,97 Cantù 1,24 0,62 2,65 0,20 1,17 2,18 1,34 6,32 0,31 2,03 Como Lodi 0,92 0,32 1,63 0,20 0,95 2,46 1,65 6,67 0,85 1,73 Mantova 1,02 0,51 1,94 0,39 0,88 1,82 0,44 2,25 1,17 1,90 Milano 2,09 0,95 4,16 0,73 1,83 4,13 2,12 10,19 1,28 4,13 Sondrio Varese 2,13 0,75 3,93 0,75 2,05
Seasonal variability of OC and EC concentration in different sites are compared in Figure 4-2.
23 0 10 20 30 40
Summer (PM10) Winter (PM10) Summer (PM2.5) Winter (PM2.5)
C on ce n tr ati on of O C ( µ g m -3) Abbadia Cerreto IQR Average Min Max Median 0 2 4 6 8 10
Summer (PM10) Winter (PM10) Summer (PM2.5) Winter (PM2.5)
C on ce n tr ati on of EC ( µ g m -3) Abbadia Cerreto IQR Average Min Max Median 0 1 2 3 4 5
Summer (PM10) Winter (PM10) Summer (PM2.5) Winter (PM2.5)
C on ce n tr ati on of O C ( µ g m -3)"
A.S.Colombano IQR Average
Min Max Median 0.0 0.5 1.0
Summer (PM10) Winter (PM10) Summer (PM2.5) Winter (PM2.5)
C on ce n tr ati on of EC ( µ g m -3) A.S. Colombano IQR Average Min Max Median 0 10 20 30 40
Summer (PM10) Winter (PM10) Summer (PM2.5) Winter (PM2.5)
C on ce n tr ati on of O C ( µ g m -3) B. Fontana IQR Average Min Max Median 0 2 4 6 8 10
Summer (PM10) Winter (PM10) Summer (PM2.5) Winter (PM2.5)
C on ce n tr ati on of EC ( µ g m -3) B. Fontana IQR Average Min Max Median
24 0 10 20 30 40
Summer (PM10) Winter (PM10) Summer (PM2.5) Winter (PM2.5)
C on ce n tr ati on of O C ( µ g m -3) Brescia IQR Average Min Max Median 0 2 4 6 8 10
Summer (PM10) Winter (PM10) Summer (PM2.5) Winter (PM2.5)
C on ce n tr ati on of EC ( µ g m -3)
// Max 19,43 Brescia // Max 10,07
IQR Average Min Max Median 0 10 20 30 40
Summer (PM10) Winter (PM10) Summer (PM2.5) Winter (PM2.5)
C on ce n tr ati on of O C ( µ g m -3) // Max 46,85 Cantù IQR Average Min Max Median 0 2 4 6 8 10
Summer (PM10) Winter (PM10) Summer (PM2.5) Winter (PM2.5)
C on ce n tr ati on of EC ( µ g m -3)" Cantù IQR Average Min Max Median 0 10 20 30 40
Summer (PM10) Winter (PM10) Summer (PM2.5) Winter (PM2.5)
C on ce n tr ati on of O C ( µ g m -3) // Max 67,56 Como IQR Average Min Max Median 0 2 4 6 8 10
Summer (PM10) Winter (PM10) Summer (PM2.5) Winter (PM2.5)
C on ce n tr ati on of EC ( µ g m -3)"
Como IQR Average
Min Max Median
25 0 10 20 30 40
Summer (PM10) Winter (PM10) Summer (PM2.5) Winter (PM2.5)
C on ce n tr ati on of O C ( µ g m -3)" Lodi IQR Average Min Max Median 0 2 4 6 8 10
Summer (PM10) Winter (PM10) Summer (PM2.5) Winter (PM2.5)
C on ce n tr ati on of EC ( µ g m -3)"
Lodi IQR Average
Min Max Median 0 10 20 30 40
Summer (PM10) Winter (PM10) Summer (PM2.5) Winter (PM2.5)
C on ce n tr ati on of O C ( µ g m -3) Mantova IQR Average Min Max Median 0 2 4 6 8 10
Summer (PM10) Winter (PM10) Summer (PM2.5) Winter (PM2.5)
C on ce n tr ati on of EC ( µ g m -3) Mantova IQR Average Min Max Median 0 10 20 30 40
Summer (PM10) Winter (PM10) Summer (PM2.5) Winter (PM2.5)
C on ce n tr ati on of O C ( µ g m -3) Milano IQR Average Min Max Median 0 2 4 6 8 10
Summer (PM10) Winter (PM10) Summer (PM2.5) Winter (PM2.5)
C on ce n tr ati on of EC ( µ g m -3)
// Max 13,72 Milano // Max 10,19
IQR Average Min Max Median
26 Figure 4-2: Seasonal variability of OC and EC in PM10 and PM2.5 during warm and cold seasons in diffirent sites
With the exception of A.S.Colombano in which both OC and EC mean concentration levels in PM2.5 and PM10 show a greater value during the warm season, at all the other sites the highest concentrations have been always observed only during the cold season. This increased levels are probably due to the increased cold season emissions (due to domestic heating) and to the different meterological and climate conditions in wintertime. During the cold season, thermal inversions and fog situations at ground level are very frequent and persistent and cause the accumulation of a considerable amount of air pollutants in the lower layers of the atmosphere. During warm season, instead, the pollutant dispersion is improved by the higher average wind velocity and the higher mixing layer (Marcazzan et al., 2001).
0 10 20 30 40
Summer (PM10) Winter (PM10) Summer (PM2.5) Winter (PM2.5)
C on ce n tr ati on of O C ( µ g m -3) // Max 41,96 Sondrio IQR Average Min Max Median 0 2 4 6 8 10
Summer (PM10) Winter (PM10) Summer (PM2.5) Winter (PM2.5)
C on ce n tr ati on of EC ( µ g m -3) // Max 11,45 Sondrio IQR Average Min Max Median 0 10 20 30 40
Summer (PM10) Winter (PM10) Summer (PM2.5) Winter (PM2.5)
C on ce n tr ati on of O C ( µ g m -3) Varese IQR Average Min Max Median 0 2 4 6 8 10
Summer (PM10) Winter (PM10) Summer (PM2.5) Winter (PM2.5)
C on ce n tr ati on of EC ( µ g m -3)"
Varese IQR Average
Min Max Median
27
4.3 Assessment of spatial distribution of OC and EC concentrations
The distribution of data is shown in Tables 4-7 – 4-10.
Table 4-7: Main percentiles of annual average concentration of OC in PM10 (µgm-3)
Sites OC in PM10 10th percentile 25 th percentile 50 th percentile 75 th percentile 90 th percentile Abbadia C. 4,13 4,82 7,12 10,53 12,66 A.S.Colombano 0,81 1,03 1,36 2,12 2,84 B.Fontana 4,38 4,96 5,69 7,34 10,21 Brescia 3,93 4,82 6,44 11,62 21,14 Cantù 5,30 6,47 8,35 11,97 21,04 Como 5,48 7,67 9,34 16,34 27,45 Lodi 4,80 5,67 6,82 9,72 16,02 Mantova 5,20 6,37 7,53 11,21 14,06 Milano 4,68 6,01 10,51 18,52 24,43 Sondrio 4,58 5,76 8,17 12,63 22,58 Varese 4,05 5,81 10,06 13,65 15,69
Figure 4-3: Main percentiles of annual average concentration of OC in PM10
It can be seen fom this figure that the sampling station in A.S. Colombano is completely different from the others due to its high-altitude location. Most of data of OC in PM10 in other sites vary between 5 µgm-3 to 15 µgm-3 except Como and Milano where there are some data higher than 15 µgm-3. 0 10 20 30 40 50 60 70
Abbadia Colombano Fontana Brescia Cantù Como Lodi Mantova Milano Sondrio Varese
C on ce n tr ati on ( µ g m !3)$ IQR Average Min Max Median 10th percentile 90th percentile
28 Table 4-8: Main percentiles of annual average concentration of EC in PM10 (µgm-3)
Sites EC in PM10 10th percentile 25th percentile 50th percentile 75th percentile 90th percentile Abbadia C. 0,69 0,84 1,25 2,15 2,39 A.S.Colombano 0,05 0,05 0,05 0,18 0,28 B.Fontana 0,39 0,59 0,87 1,30 1,55 Brescia 0,58 0,88 1,37 2,49 3,62 Cantù 0,83 1,16 2,01 3,02 4,59 Como 2,09 3,38 4,56 6,17 7,62 Lodi 0,88 1,04 1,63 2,62 3,65 Mantova 0,85 1,46 1,96 2,46 3,08 Milano 1,34 2,04 3,31 4,95 7,28 Sondrio 0,74 1,22 1,76 3,22 5,52 Varese 0,85 1,26 2,14 3,04 4,50
Figure 4-4: Main percentiles of annual average concentration of EC in PM10
Due to its special alpine terrain, the observations in A.S. Colombano are always much smaller than other locations’. Most of data from other sampling sites are under 5 µgm-3 except Como site which has many data higher than 5 µgm-3 because of its traffic environment.
0 5 10 15 20
Abbadia Colombano Fontana Brescia Cantù Como Lodi Mantova Milano Sondrio Varese
C on ce n tr ati on ( µ g m !3)$ IQR Average Min Max Median 10th percentile 90th percentile
29 Table 4-9: Main percentiles of annual average concentration of OC in PM2.5 (µgm-3)
Sites OC in PM2.5 10th percentile 25th percentile 50th percentile 75th percentile 90th percentile Abbadia C. 3,90 4,33 4,82 6,03 10,60 A.S.Colombano 0,81 1,07 1,47 2,21 3,24 B.Fontana 2,85 3,54 4,03 4,57 6,02 Brescia 5,02 6,34 7,72 10,08 16,03 Cantù 3,47 4,38 5,52 8,58 13,21 Como Lodi 2,98 4,08 4,73 7,55 11,74 Mantova 3,37 3,74 3,96 6,18 9,58 Milano 3,76 4,64 6,82 11,64 15,86 Sondrio Varese 6,20 6,91 8,84 11,21 12,26
Figure 4-5: Main percentiles of annual average concentration of OC in PM2.5
As mentioned above, A.S. Colombano is always the site that has lowest concentration because it’s an alpine site. The next ones are B. Fontana and Abbadia Cerreto because they are rural locations. The concentrations of other urban sites vary between 4 µgm-3 and 12 µgm-3.
0 10 20 30 40
Abbadia Colombano Fontana Brescia Cantù Como Lodi Mantova Milano Sondrio Varese
C on ce n tr ati on ( µ g m !3)$ IQR Average Min Max Median 10th percentile 90th percentile
30 Table 4-10: Main percentiles of annual average concentration of EC in PM2.5 (µgm-3)
Sites EC in PM2.5 10th percentile 25th percentile 50th percentile 75th percentile 90th percentile Abbadia C. 0,51 0,67 0,88 1,35 2,20 A.S.Colombano 0,05 0,05 0,08 0,21 0,29 B.Fontana 0,33 0,39 0,54 1,02 1,21 Brescia 0,81 1,00 1,47 2,30 3,00 Cantù 0,49 0,80 1,41 2,20 3,04 Como Lodi 0,64 0,88 1,10 1,70 3,44 Mantova 0,49 0,84 1,15 1,71 2,14 Milano 1,28 1,72 2,65 4,16 5,54 Sondrio Varese 1,33 1,67 2,05 2,44 3,02
Figure 4-6: Main percentiles of annual average concentration of EC in PM2.5
With the same explanation above, Colombano is still completely different with the rest ones. The data of the others vary from around 1 µgm-3 to 3 µgm-3.
0 5 10 15
Abbadia Colombano Fontana Brescia Cantù Como Lodi Mantova Milano Sondrio Varese
C on ce n tr ati on ( µ g m !3)$ IQR Average Min Max Median 10th percentile 90th percentile
31
4.4 Assessment of relative percentage of OC and EC in coarse and fine PM
The relative percentage values of OC and EC in coarse size range (PM2.5-10) are calculated by the following equations:
OC/PM2.5-10 = OCPM10 –OCPM2.5 OCPM10
∙ 100% (4.1) EC/PM2.5-10 = ECPM10 –ECPM2.5 ECPM10
∙ 100% (4.2)
The relative partitioning of OC and EC in PM2.5 are calculated as below:
OC/PM2.5 = 100 - OC/PM2.5-10 (4.3)
EC/PM2.5 = 100 - EC/PM2.5-10 (4.4)
The result is shown in Table 4-11
Table 4-11: Partitioning of OC and EC: average annual percentage of total OC and EC mass in coarse and fine size range (%)
This result is performed in Figure 4-7 and 4-8. It has been seen that with respect to concentration of OC and EC in PM10, a large partition of OC and EC goes to PM2.5, ranges from 55% to 81,9% with OC and 61,5% to 82,7% with EC. The rest percentages go to PM2.5-10. Sites PM2.5-10 PM2.5 OC EC OC EC Abbadia C. 23,0 26,8 77,0 73,2 A.S.Colombano 19,1 27,4 80,9 72,6 B. Fontana 23,6 17,3 76,4 82,7 Brescia 18,1 24,7 81,9 75,3 Cantù 34,2 30,7 65,8 69,3 Como Lodi 25,1 21,4 74,9 78,6 Mantova 40,3 38,5 59,7 61,5 Milano 25,8 18,8 70,1 81,2 Sondrio Varese 45,0 32,6 55,0 67,4
32 Figure 4-7: Partitioning of OC between coarse and fine size range
Figure 4-8: Partitioning of EC between coarse and fine size range
In temporal analyses, the partitioning to PM2.5 of organic carbon and elemental carbon is shown in Table 4-12. 0% 10% 20% 30% 40% 50% 60% 70% 80% 90% 100%
Abbadia Colombano Fontana Brescia Cantù Como Lodi Mantova Milano Sondrio Varese
Partitioning of OC between coarse and fine size range
OC/Coarse (PM2.5-10) OC/Fine (PM2.5) 0% 10% 20% 30% 40% 50% 60% 70% 80% 90% 100%
Abbadia Colombano Fontana Brescia Cantù Como Lodi Mantova Milano Sondrio Varese
Partitioning of EC between coarse and fine size range
33 Table 4-12: Seasonal partitioning of OC and EC: average percentage of total OC and EC mass in PM2.5 samples
Sites OC EC
Warm season Cold season Warm season Cold season
Abbadia C. 87,8 91,8 90,2 90,3 A.S.Colombano 87,8 74,1 72,0 56,5 B. Fontana 75,3 82,2 Brescia 98,1 76,0 79,0 69,1 Cantù 64,9 67,1 74,8 60,6 Como Lodi 71,3 78,9 55,1 66,0 Mantova 57,6 64,3 54,6 64,1 Milano 72,6 67,9 74,2 73,8 Sondrio Varese 27,8 64 67,4
Note: the percentage fractions of total OC and EC in coarse PM can be obtained by subtraction of reported figures from 100
Figure 4-9: Seasonal partitioning of OC between coarse and fine size range
0% 10% 20% 30% 40% 50% 60% 70% 80% 90% 100%
Warm Cold Warm Cold Warm Cold Warm Cold Warm Cold Warm Cold Warm Cold Warm Cold Warm Cold Warm Cold Warm Cold
Seasonal partitioning of OC between coarse and fine size range
OC/Coarse (PM2.5-10) OC/Fine (PM2.5)