ALMA MATER STUDIORUM - UNIVERSITÀ DI BOLOGNA
SCUOLA DI INGEGNERIA E ARCHITETTURA
DIPARTIMENTO DI INGEGNERIA INDUSTRIALE
CORSO DI LAUREA MAGISTRALE IN INGEGNERIA ENERGETICA
TESI DI LAUREA in
ENERGETICA DEGLI EDIFICI E IMPIANTI TERMOTECNICI M
DYNAMIC SIMULATION AND ANALYSIS OF A PASSIVE HOUSE
CASE STUDY WITH DIRECT PV SYSTEM FOR HEATING AND
DOMESTIC HOT WATER PRODUCTION
CANDIDATO: RELATORE:
Elisa Venturi Chiar.mo Prof. Ing. Gian Luca Morini
CORRELATORI: Dr.-Ing. Fabian Ochs Dr.-Ing. Georgios Dermentzis Ing. Mara Magni
Anno Accademico 2017/18
DYNAMIC SIMULATION AND ANALYSIS OF A PASSIVE HOUSE
CASE STUDY WITH DIRECT PV SYSTEM FOR HEATING AND
DOMESTIC HOT WATER PRODUCTION
Elisa Venturi, October 2018
Master Thesis
Supervisors:
Prof. Ing. Gian Luca Morini Dr.-Ing. Fabian Ochs
Dr.-Ing. Georgios Dermentzis Ing. Mara Magni
Institute for Material Technology Unit of Energy Efficient Building
AKNOWLEDGMENT
In reaching the finish line, it has not been a cakewalk, but I would like to thank everyone who stood by my side along this journey.
First of all, I thank my parents. My greatest supporters in every way. This is the achievement of an objective set long ago and nothing would have been possible if not because of you. I am thankful to the whole department “Arbeitsbereich Energieeffizientes Bauen” of the University of Innsbruck for taking me in for the last six months. I am particularly grateful to Dr.-Ing. Fabian Ochs for making this experience abroad possible. Thank you for all the helpful suggestions in order to pursue the research and the continuing attention in the given corrections. Furthermore, I am thankful to the co-supervisors Dr.-Ing. Georgios Dermentzis and Ing. Mara Magni for the incessant help and patience with me. Your support has been really precious to me.
I thank Prof. Ing. Gian Luca Morini from University of Bologna for the shared passion for this subject and for the teachings along these years.
My gratitude also goes to my friends in Bologna, who believe in me and respect me for the person I am, without screens needed. Thank you to always find a reason to stick together, even though our frenetic lives. In these last months more than ever, I understood the importance of your friendship.
To my sports club PF Progresso Fontana Pattinaggio, which I still consider “my” extended family, despite these months of absence. I continue thanking you for the comprehension of my choice to leave and the joy you offer me every time I come back into that gym.
Finally, I am thankful to the new people I met during my experience abroad. Many different stories, personalities and places. Thank you to accompany me in this brief experience, but that turned out to be one of the most educational done until now. You have been a key point for my personal growth. Now I know I have friends all over the world.
RINGRAZIAMENTI
Non è stata una passeggiata, ma qui ormai prossima al traguardo, vorrei ringraziare tutti quelli che mi sono stati vicini in questo percorso.
Innanzitutto, ringrazio i miei genitori. I miei più grandi sostenitori in tutti i sensi. Questa è la realizzazione di un obiettivo fissato ormai da lungo tempo e niente sarebbe stato possibile se non grazie a voi.
Ringrazio tutto il dipartimento “Arbeitsbereich Energieeffizientes Bauen” dell’Università di Innsbruck per avermi accolta in questi sei mesi. In particolare, ringrazio il Dr.-Ing. Fabian Ochs per aver reso possibile questa mia esperienza all’estero. Grazie per avermi offerto tanti spunti per proseguire la ricerca e la continua attenzione nelle correzioni offerte. Inoltre ringrazio i collaboratori Dr.-Ing. Georgios Dermentzis e Ing. Mara Magni per l’incessante aiuto e pazienza avuta nei miei confronti, il vostro supporto è stato prezioso.
Ringrazio il Prof. Ing. Gian Luca Morini dell’Università di Bologna per la passione trasmessa per questa materia e gli insegnamenti ricevuti negli anni.
Ringrazio i miei amici di Bologna, che credono in me e mi apprezzano per la persona che sono, senza bisogno di schermi. Grazie per trovare sempre un motivo per stare insieme, nonostante le nostre vite frenetiche. In questi ultimi mesi più che mai, ho compreso l’importanza della vostra amicizia.
La mia società sportiva PF Progresso Fontana Pattinaggio, che ancora reputo la “mia” famiglia allargata nonostante questi mesi di assenza. Continuo a ringraziarvi per la vostra comprensione riguardo la mia scelta di partire e la gioia che mi date ogni volta che entro in quella palestra.
Infine ringrazio le nuove persone conosciute in questa esperienza all’estero. Tante storie, personalità e luoghi diversi. Grazie per avermi accompagnato in questa breve esperienza, ma che si è rilevata una delle più educative fatte finora. Siete stati un punto fondamentale della mia crescita personale. Ora so di avere amici sparsi in tutto il mondo.
EXTENDED ABSTRACT
In this master thesis, different heating systems for space heating and domestic hot water (DHW) preparation are investigated with respect to their energy efficiency. In particular, a case study of a multi-storey Passive House (called An-der-Lan) is analysed by means of dynamic building and system simulations.
The investigated building is a Passive House with an electric heating and DHW preparation system. It represents a case study to investigate this concept for cost effective and efficient buildings. Through the flat-wise electric heating and DHW preparation system, distribution losses can be avoided while in the same time due to the simple installation, the investment costs can be kept at minimum levels. However, the inefficient electric heating leads to high electricity demand and correspondingly high operation costs. Therefore, all the south façade of the building is equipped with a large photovoltaic (PV) field to compensate for that.
Nearly zero energy building (nZEB) according to the Energy Performance of Building Directive (EPBD) is the required building standard from 2021 on. Each State member of the European Union developed its own definition of nZEB and requirements to accomplish that concept nZEBs. Hence, it is difficult to compare the ambition level of different member states (in contrast to the Passive House requirements). Exemplarily, the Italian and Austrian implementations of the EPBD were analysed.
Dynamic simulations are performed using the integration of several software. All data about the building are read from PHPP (Passive House Planning Package), which is a tool used for design and certification of Passive Houses. This algorithm uses monthly energy balance. Data are then read by the CarnotUIBK, which is a model in MATLAB Simulink environment, developed by the University of Innsbruck, in order to simulate the behaviour of the building. Finally, blocksets from the CARNOT library (developed by the Solar Institute Jülich, Germany) are assembled in Simulink in order to model the additional systems. These are: heating emission system, DHW production system, photovoltaic (PV) system and a heat pump (HP). For parametrizing the HP model, data are acquired from the software of Galletti company (Selmac Galletti).
For sake of simplicity, the first part of dynamic simulations focuses on the comparison of the UA and RC models for a simple office located in Rome. This is a case study from the project IEA SHC T56 – System Simulation Models. In particular, attention is put on the influence of the thermal capacity. Assuming the RC model as the reference case, variants of the UA model with different percentages of the thermal capacity are simulated, in order to find out the most
similar to the RC model. Several quantities are evaluated and compared between the two models. Based on the considered quantity, the UA model that is more similar to the RC model changes. For this building, the UA model with 25% of the original thermal mass (which is 132
Wh
m2 K , that correspond to the value of a standard medium weight building in PHPP) could be
considered as the best approximation of the more detailed RC model. The same investigation is carried out for the An-der-Lan building. In this case, it is not possible to identify the best UA model, because for every considered quantity, the minimum difference between the UA and RC model is got for a different percentage of the thermal mass. Moreover, simulation times for the simple single zone model case (office) are compared. The RC model is the one with the longest time. For example, the simulation time for the RC model is 6 times higher than the required time from the UA model with 25% of the capacitance. However, this major simulation effort is considered acceptable in order to get more realistic results.
The second part of dynamic simulation focuses on the comparison among different systems for heating and DHW preparation. The realized system is direct electric heating with radiant heaters and flat-wise DHW preparation with electric boilers. Here it is denoted as the reference all electric Case1 and it is compared against alternative solutions. Case2 is based on a central heat pump system: both heating and DHW production are supplied by an air/water heat pump. For these two main cases, several variants are studied. The first variant concerns the DHW storage volumes: a smaller and a bigger volume than the base case, are introduced. Furthermore, the variation of the area of PV panels is investigated. Different design of PV panels and different orientations are considered. A sensitivity analysis study is conducted. When variants on the storage volumes are considered, PV system is at the reference case and vice versa. Finally, Case3 and Case4 are a mix of the previous two cases. Case3 assumes heating by heat pump and electric boiler for DHW, while Case4 assumes direct electric heating and a heat pump for DHW preparation.
Results show that Case2 is the best in terms of electric energy required from the grid, although it is the system with the highest thermal losses. This proofs the convenience of a heat pump compared to the electric system, which is less energy efficient. Furthermore, the PV system only in the south façade is not sufficient to cover the energy required in neither of the two main cases. Only for few days in a year, electric energy can be supplied to the grid.
Finally, annual, monthly, daily, hourly and 10 minutes balances are compared. Results show the importance of smaller time step in balances between required and produced energy, in order to have more precise results.
EXTENTED ABSTRACT
In questa tesi, diversi sistemi per il riscaldamento e la produzione di acqua calda sanitaria (ACS) sono studiati in riferimento alla loro efficienza energetica. In particolare, è analizzato un edificio caso studio, che rispetta i requisiti di Passive House (denominato An-der-Lan), tramite strumenti di simulazione dinamica di edifici e impianti.
L’edificio studiato è una Passive House dotata di un sistema elettrico per il riscaldamento e la produzione di ACS. Questo rappresenta un caso studio per investigare il concetto di convenienza economica ed efficienza degli edifici. Grazie alla produzione elettrica di calore per il riscaldamento dell’edificio e la produzione di ACS, si evitano perdite di distribuzione e allo stesso tempo, grazie alla semplicità di installazione, i costi di investimento possono essere mantenuti al minimo. Ma a causa dell’inefficienza del sistema, la richiesta energetica è elevata e di conseguenza lo sono i costi operativi. Quindi, per compensare la richiesta energetica, su tutta la facciata dell’edificio esposta a sud è stato installato un impianto fotovoltaico (PV). Gli edifici a energia quasi zero (nZEB) rappresentano lo standard richiesto dal 2021 in poi dalla Direttiva Europea “Energy Performance of Building Directive” (EPBD). Ogni Stato membro dell’Unione Europea ha sviluppato la propria definizione di nZEB e i propri requisiti da soddisfare per raggiungere questo concetto. Risulta quindi difficile paragonare i Decreti di ogni Stato (al contrario dei requisiti delle Passive House). A titolo d’esempio, la Direttiva italiana e austriaca di recepimento e applicazione dell’EPBD sono state analizzate.
Sono condotte simulazioni dinamiche grazie all’integrazione di diversi software. Tutti i dati dell’edificio sono letti dal PHPP (Passive House Planning Package), il quale è uno strumento per la progettazione e la certificazione delle Passive House. Il PHPP usa bilanci energetici su base mensile. I dati sono in seguito letti da CarnotUIBK, modello in ambiente MATLAB Simulink, sviluppato dall’Università di Innsbruck, per simulare il comportamento dinamico dell’edificio. Infine, blocchi della libreria CARNOT (sviluppata dal Solar Institute di Jülich, Germania) sono assemblati in Simulink per modellare i sistemi aggiuntivi. Questi sono: il sistema per il riscaldamento, il sistema per la produzione di ACS, il sistema fotovoltaico e la pompa di calore (HP). Per la parametrizzazione della HP, i dati sono acquisiti dal software dell’azienda Galletti (Selmac Galletti).
Per semplicità, la prima parte delle simulazioni dinamiche si concentra sul paragone tra i modelli UA e RC per un semplice ufficio situato a Roma. Questo è un edificio caso studio del progetto IEA SHC T56 – System Simulation Models. In particolare, l’attenzione si concentra sull’influenza della capacità termica. Assumendo il modello RC come il caso di riferimento, sono simulate varianti del modello UA con diverse percentuali di capacità, al fine di trovare la
più simile al modello RC. Sono considerate varie grandezze e in seguito i loro valori sono paragonati tra i due modelli. In base alla grandezza considerata, il modello UA più simile al RC cambia. Per questo edificio, il modello UA con il 25% della capacità termica originale (che è 132 Wh
m2 K , che corrisponde al valore standard per un edificio con un peso medio nel PHPP) può
essere considerato la migliore approssimazione del modello RC (che è il modello più dettagliato). Lo stesso studio è condotto per l’edificio An-der-Lan. In questo caso non è possibile identificare il migliore modello UA in quanto, per ogni grandezza considerata, la minima differenza tra il modello UA e il modello RC si ottiene per una diversa percentuale della capacità termica. Inoltre, sono confrontati i tempi di simulazione per il caso del semplice edificio a una sola zona termica. Il modello RC risulta quello con il maggior tempo computazionale. Per esempio, esso risulta 6 volte maggiore del tempo richiesto dal modello UA con il 25% di capacità. In ogni caso, questo maggiore sforzo computazionale è considerato accettabile al fine di ottenere risultati più realistici.
La seconda parte di simulazioni dinamiche si concentra sul confronto tra diversi sistemi per il riscaldamento e la produzione di ACS. Il sistema reale, assunto come caso di riferimento e chiamato Case1, è composto da riscaldamento elettrico tramite corpi radianti e produzione di ACS tramite boiler con resistenze elettriche. Questo è confrontato con soluzioni alternative. Il Case2 si basa su un sistema centralizzato a pompa di calore: sia il riscaldamento che la produzione di ACS sono alimentati da una pompa di calore aria/acqua. Per questi due casi principali, diverse varianti sono studiate. La prima variante riguarda gli accumuli per l’ACS: un volume minore e uno maggiore, rispetto al caso base, sono considerati. Inoltre, è studiata la variazione dell’area dei pannelli PV. Diversi design e diversi orientamenti sono considerati. È condotta un’analisi di sensitività. Quando si considerano le varianti dell’accumulo di ACS, il PV è mantenuto al caso di riferimento e viceversa. Infine, il Case3 e il Case4 sono una via di mezzo dei casi precedenti. Il Case3 prevede il riscaldamento da HP e produzione elettrica di ACS, mentre il Case4 consiste in riscaldamento elettrico e ACS fornita da HP.
I risultati mostrano che il Case2 è il migliore in termini di energia elettrica richiesta dalla rete, sebbene sia il sistema con le maggiori perdite termiche. Questo prova la convenienza della HP rispetto al caso elettrico, che è il meno efficiente. Inoltre, l’impianto PV sulla facciata a sud non risulta sufficiente a coprire la richiesta energetica in nessuno dei due casi principali. Infatti solo per pochi giorni in un anno, l’energia elettrica può essere fornita alla rete.
Infine, bilanci energetici annuali, mensili, giornalieri, orari e ogni 10 minuti sono confrontati. I risultati mostrano l’importanza di piccoli time step nei bilanci tra energia richiesta e prodotta, al fine di ottenere risultati più precisi
SUMMARY
1 PROJECT INTRODUCTION ... 1
1.1 Literature overview ... 1
1.2 An-der-Lan building and the concept of Passive House ... 3
2 nZEB IN THE CURRENT LANDSCAPE ... 5
2.1 Energy Efficiency Building for European Commission ... 5
2.1.1 The Energy Performance of Buildings Directive (EPBD, 2010) ... 5
2.1.2 The Energy Efficiency Directive (2012) ... 6
2.2 Europe 2020 and Horizon 2020 ... 7
2.3 nZEB Italia ... 8
2.4 nZEB Austria ... 15
3 BUILDINGS AND BOUNDARY CONDITIONS ... 22
3.1 Simple office... 22
3.2 An-der-Lan building ... 23
3.2.1 Photovoltaic system ... 26
3.2.2 Heating system ... 27
3.2.3 Domestic hot water preparation system ... 29
3.2.4 Internal gains ... 31
3.3 Alternative case for An-der-Lan building ... 33
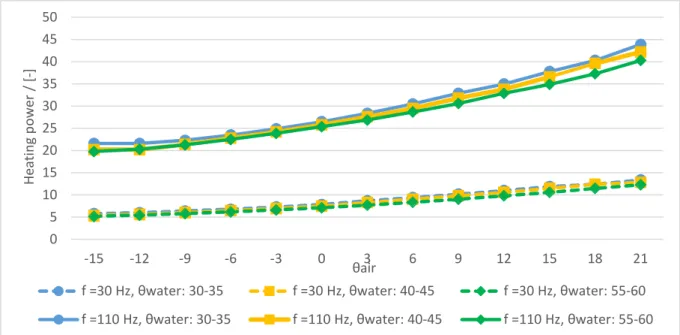
3.3.1 Air/Water Heat pump ... 33
3.3.2 Radiator ... 35
3.3.3 Boiler ... 38
3.4 Sensitivity analysis study of An-der-Lan building ... 39
3.4.1 PV variants ... 39
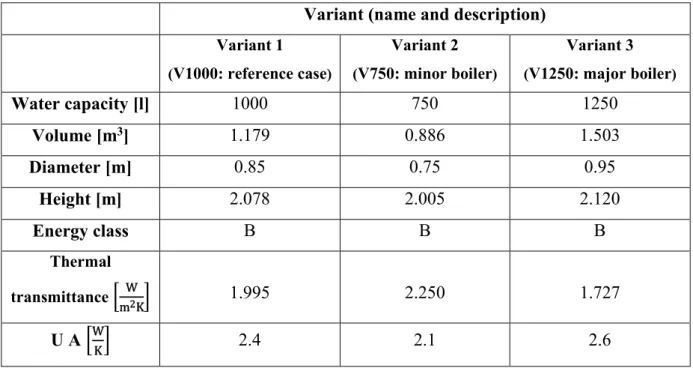
3.4.2 DHW storage variants ... 41
4 MODELS ... 45
4.1 Building performance simulation ... 45
4.2 Implementation of the simulation models ... 46
4.3 Selection of the appropriate simulation model: UA and RC ... 47
4.3.1 UA model ... 47
4.3.2 RC model ... 47
4.4.1 Description of the thermal mass ... 49
4.4.2 Studies on the thermal mass ... 51
4.5 Simulation tools for the An-der-Lan building ... 52
4.5.1 Model for the PV system ... 52
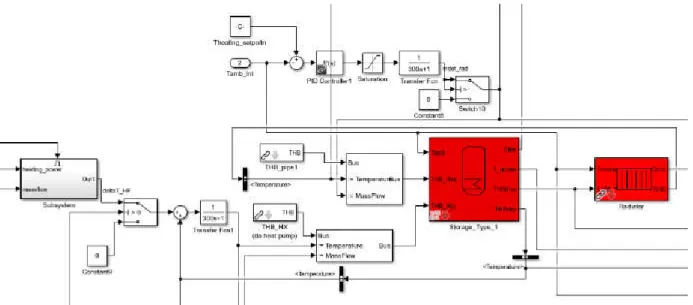
4.5.2 Model for the electric case ... 53
4.5.3 Model for the Heat Pump ... 55
5 RESULTS ... 58
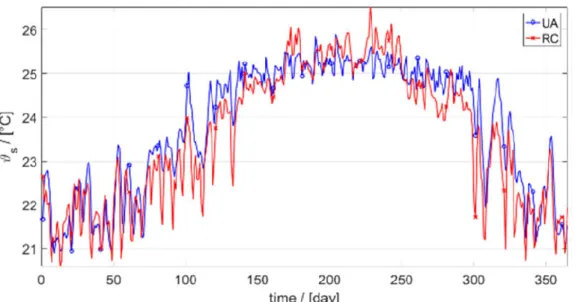
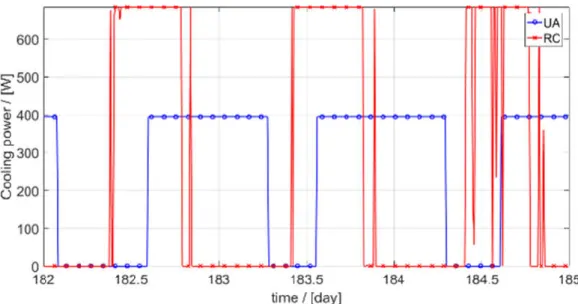
5.1 Comparison between UA and RC models ... 58
5.2 Effects of the thermal mass ... 61
5.2.1 The office case ... 61
5.2.2 The An-der-Lan building case ... 65
5.3 Simulation Results of different heating system and PV areas ... 69
5.3.1 Case1: Electric heating and electric DHW ... 69
5.3.2 Case2: Heat pump for heating and domestic hot water ... 76
5.3.3 Comparison of all cases ... 84
5.3.4 Comparison of different periods balances ... 87
5.4 PHPP results ... 91
6 CONCLUSIONS AND OUTLOOK ... 94
LIST OF SYMBOLS AND UNITS
A Total internal floor area m2
C Capacity J
m3 K
Specific heat capacity at constant pressure J kg K
Electric energy [Wh]
EEB Final energy demand kWh
m2year
EP Energy Performance Index kWh
m2
Er Relative error [-]
f Conversion Factor [-]
fGEE Total energy efficiency factor [-]
HBWRef Reference space heating demand
kWh m2year
H'T
Average coefficient of global heat exchange for transmission per unit of dispersing surface
W m2
HTEBRef Reference heating technology energy demand
kWh m2year I Current [A] ℓc Shape factor [-] ̇ Mass flow kg s
Exponent of the radiator [-]
n Number of elements [-]
P Power [W]
PEBHEB Primary energy demand
kWh m2year
Thermal power [W]
Q Requested thermal energy
(according to the Italian Interministerial Decree)
kWh m2∙year T Absolute temperature [K] U Thermal Transmittance W m2K V Voltage [V]
LIST OF GREEK LETTERS AND UNITS η Efficiency [-] Δ Difference [-] θ Relative temperature [°C] ρ Density kg m3 LIST OF SUBSCRIPTS
10 min 10 minutes balance
A Ambient air indoor
amb Ambient air outdoor
Annual
building Required from the building
C Cooling
c Convective
CO2 CO2
DHW Domestic Hot Water
el Element
energy_cool Energy through the cooling system energy_heat Energy through the heating system energy_trans Energy through walls and windows
energy_vent Energy due to ventilation
gl Global
Required from the grid
H Heating in Inside inf Infiltration intgains Gains L Lighting limit Limit max Maximum
nd Needed
oc Open circuit
out Outside
P,nren Primary no-renewable energy
P,ren Primary renewable energy
P,tot Total primary energy
PE To determine the PEB
PE, ern Renewable portion of the PEB
PE, n ern Non-renewable portion of the PEB
PV Photovoltaic R Radiator r Radiative s Sensitive sc Short circuit spec Specific
Tground Transmission through the ground
tot Total
trans transmission
Twalls Transmission through wall
Twind Transmission through windows
u Useful
V Ventilation
vent Ventilation
ventmech Mechanical ventilation
LIST OF ABBREVIATIONS
3D Three Dimensional
A Annex
AC Alternate Current
AEA Austrian Energy Agency
BIPV Building Integrated PhotoVoltaics
BPS Building Performance Simulation
CARNOT Conventional And Renewable eNergy systems OpTimization Blockset
COP Coefficient Of Performance
CTI Italian Thermotechnical Committee
DC Direct Current
DH District Heating
DHW Domestic Hot Water
e7 Energy Markets Analysis
EH Electric Heating
ENEA National Agency For New Technologies And Energy
EPBD Energy Performance Of Building Directive
ERA European Research Area
EU European Union
HP Heat Pump
HPP Heat Pump Programme
HVAC Heating, Ventilation and Air Conditioning
HX Heat Exchanger
IEA International Energy Agency
LCoE Levelized Cost Of Electricity
MATLAB MATrix LABoratory
nZEB Nearly Zero Energy Building
NZEB Net Zero Energy Building
OIB Austrian Institute Of Construction Engineering
PHPP Passive House Planning Package
PV Photovoltaic
RMS Root mean square
RSE Energy Research Company
SaLüH Renovation for ventilation, heating and hot water
SHC Solar Heating and Cooling programme
SPF Seasonal Performance Factor
ST Solar Thermal
STC Standard Test Conditions
T Task
THB Thermo-Hydraulics Bus
WDB Weather Boundary Condition
1
1 PROJECT
INTRODUCTION
1.1 L
ITERATURE OVERVIEWThe European Union (EU) is focused on limiting building environmental impact through specific policy actions, a clear example is the recast of the Energy Performance of Buildings Directive (EPBD) (European Commission, 2018). One relevant regulatory obligation of the EPBD recast is that all new buildings have to be nearly zero-energy buildings (nZEBs) by the end of 2020. The definition of nZEB is up to each Member State, but the common aspect is a very high energy performance with renewable production to cover the remaining energy needs in a building. Moreover, Member States should draft a cost-optimal methodology. The aim is to obtain both an energy convenience and a cost convenience in the new building construction. As D’agostino and Parker (2018) highlighted, a cost-effective nZEB is achievable in many states with the optimization of some key factors such as thermal insulation, airtightness, home energy management system along with photovoltaics (PV), and class A++ for appliances and lighting. In the optimized cases, the natural gas consumption for space and water heating was reduced approximately by 70.
For more economic solutions in some cases, a shift from an nZEB to a zero emission neighbourhoods can be meaningful. The installation of grid connected renewable energy sources at a local or regional level instead of a single building could be more efficient and economic (Good et al., 2016). ()
A similar concept of nZEB is the Net Zero Energy Building (NZEB) accounting often for annual electricity balance between on-site renewables and grid. An example is an efficient technical system entirely based on heat pump combined with the maximum possible PV installed in a highly insulated building (Becchio et al, 2015). () In that case also, the economic
benefits of considering a region or a state instead of a single building were discussed. Introducing the levelized cost of electricity (LCoE), it has been shown in a simulation study that the cost of energy from PV was more expensive than the grid electricity for a single building
2
(Hirvonen et al. 2016). () Therefore, it is confirmed the need of incentives. Then, a system of PV
combined with heat pump (HP) or direct electric heating (EH) shows an LCoE lower than the grid. However, the same trend is not confirmed for a PV system coupled with district heating (DH). In any case, it was highlighted that the zero energy level (ZEL) was directly proportional to the PV capacity for all heating systems. Another interesting outcome was that the use of a thermal storage of 200 l was able to increase the self-consumption of PV. Self-consumption values for the heat pump were increased by 20 - 40%, while with direct electric was increased by 15% - 70% when storage was utilized. With EH, a small storage gave relatively much larger benefits than a large one. Below 2 kW PV capacity, the storage size was not important, due to the small amount of excess power. Larger storages increased the demand for grid electricity during times of low insolation.
Another study declares that a combination of PV and HP is more cost effective compared to PV and battery. Indeed, optimal operation of an HP enabled an average saving of 7% of the electricity cost under conventional operation. This can greatly contribute to the expansion of PV. Although the introduction of a 2 kWh to 4 kWh battery enabled a cost saving of 100 to 300 USD per year, the investment was not recovered within the lifetime of the battery (assuming current prices) (Iwafune et al., (2017).
Finally, a comparison between a solar thermal (ST) system and a PV system coupled with an HP has been presented in considering two multi-family houses. The yield of a solar thermal system (including storage and distribution losses) was compared to that of a heat pump system and PV. It was indicated that small solar thermal systems are generally favourable compared to PV from the energetic point of view. For air-/water heat-pumps with commonly lower seasonal performance factor (SPF) larger solar thermal system are beneficial. The economics strongly depends on the development of the PV system costs. Trends indicate an advantage of PV over ST even if low volatile electricity prices (i.e. seasonal fluctuation) are considered. The system complexity increases in case of solar and heat pump systems. Hence, for a decision for or against ST, it should be considered that the maintenance effort might be over-proportional high for small ST systems (Ochs et al., 2014). ().
3
1.2 AN-DER-LAN BUILDING AND THE CONCEPT OF PASSIVE HOUSE
The project analysed in this work is about a new building in the so called An-der-Lan project. From now on, for sake of simplicity, it will be referred as the An-der-Lan building.
The building has been constructed under the requirements of the Passive House standard. Passive House is a building standard that is truly energy efficient, comfortable and affordable at the same time. A Passive House is designed to have an energy demand that is as low as possible. The combination of Passive House with renewable sources of energy represents a suitable solution to move to low/zero carbon buildings. Indeed, with such a low amount of required energy, it is easier to meet the subsequent demand by renewable sources (Passive House Institute, 2018).
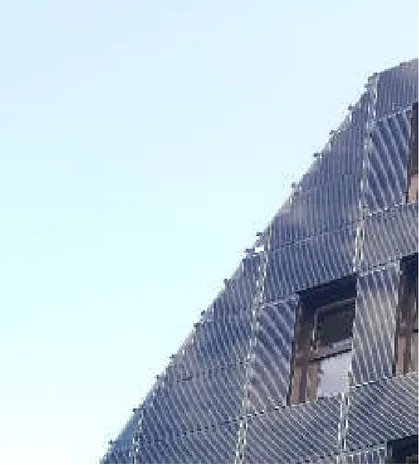
The An-der-Lan building is a new small residential complex with 14 flats situated in Innsbruck, Austria (Figure 1.1).
The owner is the Innsbruck's real estate company (IIG) and it will be used by the association “psycho-social care service of Tyrol”. The Association will accompany the mentally ill, which after a stay in the clinic, should be offered a temporary assisted living environment with a therapeutic offer as assistance on the way to the independent life.
4
In this study, the Passive House case study An-der-Lan building is simulated with the dynamic tool MATLAB Simulink. Electric system is modelled to provide heat for the space heating and domestic hot water (DHW). A PV system is modelled to provide electric power. A comparison of electric source with PV system and HP with PV system is carried out in order to evaluate which can be the more energy convenient. Indeed, the study has the purpose to investigate which can be the best way to have self-consume of the power coming from the PV system, requiring as less as possible energy from the grid. This is a more precise approach to the problem, compared to the no-dynamic tools. Indeed, monitoring the behaviour of the whole building system every few minutes for a year allows to have more detailed and realist results compared to static tool. The main risk of the latter is to overrate the actual useful power from the PV system, as the request and production of energy are not coincident.
In Chapter 2 the concept of energy efficient building according the European Union is illustrated. Moreover, the nZEB requirements according the Italian and Austrian Decrees are presented. Chapter 3 presents the detailed description of the two considered buildings. The first is a simple single zone office, the second is the An-der-Lan building. In particular, there is the description of its systems in the reference case, the alternative solutions considered and all the variants taken into account in this project. Theoretical description of the UA and RC models is illustrated in Chapter 4. Moreover, in this chapter adopted tools in simulation models are shown. In particular, all the blocksets used in MATLAB Simulink models are presented too. In Chapter 5 results for different models (UA and RC) are illustrated and discussed. The same method is applied for the results obtained from the An-der-Lan building simulations. Moreover, a sensitivity analysis is presented. Furthermore, the comparison among alternative systems are discussed. Comparison among different time step balances is conducted too. Finally, in Chapter 6 conclusion and possible future development are exposed.
5
2
N
ZEB
IN
THE
CURRENT
LANDSCAPE
2.1 E
NERGYE
FFICIENCYB
UILDING FORE
UROPEANC
OMMISSIONBuildings are responsible for approximately 40% of energy consumption and 36% of CO2
emissions in the EU. Currently, about 35% of the EU's buildings are over 50 years old and almost 75% of building stock is energy inefficient, while only 0.4-1.2% (depending on the country) of building stock is renovated each year. Therefore, more renovation of existing buildings has the potential to lead to significant energy savings, which could reduce the EU’s total energy consumption by 5-6% and lower CO2 emissions by about 5%.
Improving the energy efficiency of buildings can also generate other economic, social and environmental benefits. Furthermore, energy performance of buildings also has a major impact on the affordability of housing and energy poverty. Energy savings and efficiency improvement of the housing stock would enable many households to escape energy poverty (European Commission: Energy Efficiency, Building, 2018).
The 2010 Energy Performance of Buildings Directive (EPBD) and the 2012 Energy Efficiency Directive are the EU's main legislation promoting the improvement of the energy performance of buildings within the EU and providing a stable environment for investment decisions to be taken.
2.1.1 The Energy Performance of Buildings Directive (EPBD, 2010)
The EPBD is the European Union's main legislative instrument aiming to promote the improvement of the energy performance of buildings within the Community. It was inspired by the Kyoto Protocol which commits the EU and all its parties by setting binding emission reduction targets.
The so-called “EPBD recast” was the replacement of the Directive 2002/91/EC. It was approved on 19 May 2010 and entered into force on 18 June 2010.
This version of the EPBD broadened its focus on Nearly Zero-Energy Buildings (nZEB), cost optimal levels of minimum energy performance requirements as well as improved policies.
6 According to the recast:
All new buildings must be nearly zero-energy buildings by 31 December 2020 (public buildings by 31 December 2018)
Energy performance certificates must be issued when a building is sold or rented, and they must also be included in all advertisements for the sale or rental of buildings EU countries must establish inspection schemes for heating and air conditioning
systems or put in place measures with equivalent effect
EU countries must set cost-optimal minimum energy performance requirements for new buildings, for the major renovation of existing buildings, and for the replacement or retrofit of building elements (heating and cooling systems, roofs, walls and so on) EU countries must draw up lists of national financial measures to improve the energy
efficiency of buildings.
The last two points represent the idea that minimum requirements have to be defined through an economic analysis too. The rules for performing this analysis have been set by the Commission and form the “cost-optimal methodology”, which must be applied by each Member State to make a comparison against the current requirements and, in the future, whenever the requirements are updated.
2.1.2 The Energy Efficiency Directive (2012)
The Energy Efficiency Directive establishes a set of binding measures to help the EU reach its 20% energy efficiency target by 2020 (Europe 2020). Under the Directive, all EU countries are required to use energy more efficiently at all stages of the energy chain, from production to final consumption.
Buildings under the Energy Efficiency Directive should respect the following points:
EU countries must make energy efficient renovations to at least 3% of the total floor area of buildings owned and occupied by central government
EU governments should only purchase buildings which are highly energy efficient EU countries must draw up long-term national building renovation strategies which can
7
On 30 November 2016 the Commission proposed an update for both the Directives. The aim is to accelerate building renovation, to help promote the use of smart technology in building and a new target of 30% of energy efficiency for 2030.
To support this aim, the Commission also published the EU Building Stock Observatory. This is a new buildings database that monitors the energy performance of buildings across Europe, tracking many different aspects.
In the end, the European Commission draws its attention to certificates and financing renovations too.
2.2 EUROPE 2020 AND HORIZON 2020
Europe 2020 is a 10-year strategy proposed by the European Commission on 3 March 2010 for advancement of the economy of the European Union. It aims at “smart, sustainable, inclusive growth” with greater coordination of national and European policy. It follows the Lisbon Strategy for the period 2000–2010.
The strategy identifies five headline targets the European Union should take to boost growth and employment. One of these is exactly about the energy landscape: reduction of greenhouse gas emission, increase of renewable energy and increase of energy efficiency. One of the implementing tools of the Europe 2020 strategy is Horizon 2020 (European Commission: Europe 2020 Strategy, 2018).
Horizon 2020, also named “FP8”, is the eighth of the Framework Programmes for Research and Technological Development. These are funding programmes created by the European Union/European Commission to support and foster research in the European Research Area (ERA). Horizon 2020 provides grants to research and innovation projects through open and competitive calls for proposals. Horizon 2020 supports Open access to research results, in order to create greater efficiency, improve transparency and accelerate innovation (Framework Programmes for Research and Technological Development, 2018).
8 2.3 NZEB ITALIA
ITALIAN DEFINITION OF NEAR ZERO ENERGY BUILDING (NZEB)
In Italy, the EPBD has been implemented with the Legislative Decree 4 June 2013, n.63, converted with modifies in the law of the 3rd August 2013, n.90. Here the nZEB is defined. The definition is the following: “A Nearly Zero Energy Building is a building with a great performance, which is evaluated based on the requirements for new buildings and additional requirements about renewable sources. Energy needs are very low, or nearly zero, and mostly covered by renewable sources. The requirements are all referred to the reference building” (Decreto Interministeriale del 26 Giugno 2015, 2015).
The “reference building” was born in the Interministerial Decree of June 26, 2015 for building energy certification. The purpose of this operation is to provide a general reference to calculate the value of primary energy limit that new buildings or those undergoing major renovation must comply. The reference building is defined by the Decree as a virtual building identical to the planned one in terms of geometry (shape, volumes, floor area, surfaces of constructive elements and components), orientation, territorial location, destination of use and situation to the contour. On the other hand, thermal characteristics and energy parameters are determined by the Decree, based on the climatic zone of the site. For all not defined input data and parameters, real building values are used.
Regarding the building shell, there are precise transmittance values within which it is necessary to undergo, these change according to the housing element considered, to the climate zone and the date of the operation (in the case of residential in fact limits are different between 2015 and 2021). In the Decree is specified that all these values are inclusive of thermal bridges.
As regards the technical installations, instead, the building of reference shall be deemed to be equipped with the same energy production plants of the real building. In the regulation are provided values concerning winter heating, summer cooling, production of domestic hot water, of electricity on- site, of mechanical ventilation and lighting.
The Decree defines that it must be refer to UNI/TS 11300 for the calculation of the requested thermal energy in winter (QH,nd
kWh
m2∙year ) and in summer (QC,nd
kWh
m2∙year ). Moreover, for space
heating and cooling, reference building parameters must be used, while regarding the domestic hot water, the required thermal energy (QW,nd
kWh
9
Consequently, to carry out any work on the building, there must a comparison with the parameters proposed by the Decree regarding the reference building.
Different requirements must be satisfied if different intervention types are taken into account.
PARAMETERS OF ITALIAN NZEB
Five requests have to be satisfied in order to obtain a nZEB.
1. The average coefficient of global heat exchange for transmission per unit of dispersing surface (H'T W
m2 ) must be less than the maximum allowable value reported in Table 2.1,
depending on the climate of the area and the ratio surface/volume S
V 1 m :
Table 2.1: Maximum allowable H’T values
Shape ratio S V 1 m Climatic zone A and B C D E F S V ≥ 0.7 0.58 0.55 0.53 0.50 0.48 0.4 ≤ S V < 0.7 0.63 0.60 0.58 0.55 0.53 S V < 0.4 0.80 0.80 0.80 0.75 0.70
2. The ratio between the solar summer equivalent area of the windowed components and the area of the useful surface ( ,
, [−]) must be lower than the corresponding
limit value. This is 0.030 for residential building and 0.040 for all other buildings.
3. The energy performance indexes EPH,nd, EPC,nd and EPgl must be lower than the values
of the corresponding limit indexes calculated for the reference building (EPH,nd,limit,
EPC,nd,limit and EPgl,limit).
These parameters represent:
EPH,nd is the energy performance index for winter conditioning kWh
m2
EPC,nd [kWh/m2] is the energy performance index for summer conditioning,
including humidity control kWh
10
EPgl is the global energy performance index, expressed in total primary
energy kWh
m2 . Sometimes this parameter can be also indicated as EPgl,tot for
the building and EPgl,tot,limit for the reference building.
EPH,nd,limit, EPC,nd,limit and EPgl,limit (or EPgl,tot,limit) are the same quantities, but
referred to the reference building kWh
m2
All these parameters are calculated as the ratio between the needed energy [kWh] and the surface of the apartment [m2]. In particular, they are obtained from Equation 2.1-2.3: , = (2.1) , = (2.2) , = , + , + , + , + , (2.3) Where: , = , (2.4) , = , (2.5) , = , (2.6)
QW,nd, QV,nd, QL,nd are the energy demand respectively for domestic hot water,
ventilation and lighting and they all are assumed equal to values of the real building. The energy demands (Q) for heating and cooling are calculated considering the thermal transmittance of the reference building. These values vary based on the element (vertical external wall, vertical internal wall, roof, etc.) and the climatic zone. Limit values for structures toward outside or not conditioned rooms are shown in Table 2.2.
11
Table 2.2: U-value limits for structures toward outside or no-conditioned room, based on the type of structure and climatic zone, according to the Interministerial Decree of June 26, 2015
U W m2K Climatic zone Opaque vertical structures Opaque horizontal or sloping coverage structures Opaque horizontal floor structures Transparent and opaque windows (fixtures included) A and B 0.43 0.35 0.44 3.00 C 0.34 0.33 0.38 2.20 D 0.29 0.26 0.29 1.80 E 0.26 0.22 0.26 1.40 F 0.24 0.20 0.24 1.10
Furthermore, thermal transmittance U of opaque vertical and horizontal structure of separation between buildings or neighbour estate must be lower than 0.8 W
m2K for every
climatic zone. The total solar factor transmission value (ggl+sh) for the windowed components with orientation from east to west passing to the south must be lower than 0.35 for every climatic zone.
4. The efficiencies of average seasonal efficiency of heating (ηH), of average seasonal
efficiency of hot water production (ηW) and of average seasonal efficiency of cooling
(ηC) must be higher than the values of the corresponding efficiencies indicated for the
building of reference (ηH,limit, ηW,limit, and ηC,limit). These limits are listed in the Table 2.3
12
Table 2.3: Efficiencies for the subsystem of utilization performance
Subsystem of utilization performance H C W
Water distribution 0.81 0.81 0.70
Air distribution 0.83 0.83 -
Mix distribution 0.82 0.82 -
Table 2.4: Efficiencies for subsystem of power-generating
Subsystem of power-generating Thermal energy production
Electric energy production on-site
H C W
Liquid fuel power-unit 0.82 - 0.80 -
Gas fuel power-unit 0.95 - 0.85 -
Solid fuel power-unit 0.72 - 0.70 -
Solid biomass power-unit 0.72 - 0.65 -
Liquid biomass power-unit 0.82 - 0.75 -
Vapour compression heat pump
with electric engine 3.00 2.50 2.50 -
Vapour compression chiller with
electric engine - 2.50 - -
Absorption heat pump 1.20 2.50 1.10 -
Chiller with indirect flame 0.60 * ηgn - -
Chiller with direct flame - 0.60 - -
Vapour compression heat pump
with endothermic engine 1.15 1 1.05 -
Cogeneration 0.55 - 0.55 0.25
Electric heating (resistance) 1.00 - - -
District heating 0.97 - - 0.1
District cooling - 0.97 - -
Thermal solar system 0.3 - 0.3 -
13
5. In accordance with the Legislative Decree No. 28/2011 remain the limits on thermal renewable.
Specifically, the plants for the production of thermal energy must guarantee the respect of the cover, through the use of renewable sources, of 50% EPW and 50% (EPH + EPC+
EPW).
ITALIAN CONVERSION FACTORS
For the purposes of building classification, the calculation of not renewable primary energy is made applying the appropriate conversion factors in primary no-renewable energy.
The conversion factor in total primary energy is fP,tot and it is calculated according to Equation
(2.7):
, = , + , (2.7)
Where:
fP,nren: conversion factor in primary no-renewable energy
fP,ren: conversion factor in primary renewable energy
14
Table 2.5: Conversion factors
Energetic vector fP,nren fP,ren fP,tot
Natural gas 1.50 0 1.05
GPL 1.50 0 1.05
Diesel and oil fuel 1.07 0 1.07
Coal 1.10 0 1.10
Solid biomass 0.20 0.80 1
Liquid and gas biomass 0.40 0.6 1
Electric energy from the grid 1.95 0.47 2.42
District heating 1.5 0 1.5
Urban waste 0.2 0.2 0.4
District cooling 0.5 0 0.5
Electric energy from solar thermal system 0 1.00 1.00
Electric energy from photovoltaic system 0 1.00 1.00
Free cooling 0 1.00 1.00
Heat pump 0 1.00 1.00
ITALIAN COST-OPTIMAL METHODOLOGY
In Italy, to pursue the cost-optimal methodology, the Ministry of Economic Development has set up a working group including Energy Research Company (RSE), National Agency for New Technologies and Energy (ENEA) and Italian Thermotechnical Committee (CTI). The last step in this methodology was to compare the optimal levels with the requirements currently in force. Comparison showed that in almost all the buildings, it is more cost-effective to exceed the minimum legal requirements and construct higher-performance buildings than those required by the current law. This will allow to obtain not only energy savings but also cost savings during the building’s useful life.
15 2.4 NZEB AUSTRIA
AUSTRIAN DEFINITION OF NEARLY ZERO ENERGY BUILDING (NZEB)
The Austrian nZEB is defined in the Austrian Institute of Construction Engineering (OIB) Guideline 6 (Österreichisches Institut für Bautechnik, 2018). The definition is “A nZEB is an energy efficient building with a good thermally insulated envelope and an environment‐friendly heating system, which is not attached to a specific building concept, e.g., 'Passive House' ”.
PARAMETERS OF AUSTRIAN NZEB
Austrian nZEBs are defined by four indicators or parameters. The minimum energy performance requirements on these four indicators are related to the Austrian reference climate. In addition to these parameters, other requirements have to satisfied. These concern renewable share, heat-transferring components, technical building system and maximum coverable electricity required.
Independently from requirements, every new building or existing building in case of renovation has to respect the limit on the U values, defined in the OIB Guideline 6 (Table 2.6). The same values will also apply for the NZEB 2020 buildings as well.
Table 2.6: Minimum requirements for U-values
Building elements U W m2K Exterior wall 0.35 Roof 0.2 Window 1.4 Floor 0.4
1. The four main indicators are:
Reference space heating demand (HBWRef kWh
m2a );
Final energy demand (EEB kWh
m2a );
Total energy efficiency factor (fGEE [-]);
Primary energy demand (PEBHEB kWh
16
These parameters have to respect the requests shown in the Table 2.7. The table shows that the national plan indicates a stepwise tightening of the requirements towards 2020. In particular, compliance with minimum requirements can be achieved by two methods: Through tightened requirements on space heating demand (HBWRef), which means
better building envelope in order to reduce the heating/cooling energy needed, and not
considering the fGEE. This is reflected in the formula for NZEB 2020 buildings
10 × (1 + 3,0 / ℓc) where ℓc is the characteristic length (usually known as the building's 'shape factor');
Through installation of a more energy efficient technical system for heating and DHW. The total energy efficiency factor (fGEE) reflects the type of energy use and production
Table 2.7: Main indicators for Austrian nZEB
HBWRef EEB fGEE PEBHEB
Currently in force 14 × (1 + 3,0 / ℓc) by means of HTEBRef 41 or 16 × (1 + 3,0 / ℓc) 0,85
By entry into force of OIB-RL6:2019 12 × (1 + 3,0 / ℓc) by means of HTEBRef or 16 × (1 + 3,0 / ℓc) 0,80 From 01/01/2021 10 × (1 + 3,0 / ℓc) by means of HTEBRef or 14 × (1 + 3,0 / ℓc) 0,75
17 2. Requirements for the renewable share
The requirement of minimum levels of energy from renewable sources in the case of new construction and renovation of a building is fulfilled if at least one of the following points from (a) or (b):
a. Use of renewable sources outside the system boundaries "building":
It is required that at least 50% of heat demand for space heating and hot water is covered by renewable source, in compliance with the requirements of the applicable maximum heating energy demand. The mentioned renewable source can be: biomass, heat pump, district heating from a heating plant on basis if renewable or district heating from high efficiency cogeneration.
b. Use of renewable sources on-site or nearby:
There are through active measures, such as by solar thermal energy, net income on-site or in the vicinity of at least 10% of the energy requirement for hot water; There are through active measures, such as by photovoltaic, net income on-site or in the vicinity of at least 10% of the energy requirement for household current or to generate operating current;
There are through active measures, such as by heat recovery, net income on-site or in the vicinity of at least 10% of the energy requirements for space heating; A combination of the three previous possibilities to reduce the maximum
permissible final energy demand or the maximum permissible total energy efficiency factor fGEE by at least 5% through a combination of measures of solar
thermal energy, photovoltaics, heat recovery or efficiency gains.
3. Requirements for heat-transferring components:
18
Table 2.8: Limits of U-values foe each type of wall
Component U W
m2K
Wall against outside air 0.35
Wall against unheated or not developed attic rooms 0.35 Wall against unheated, frost-free parts of building (except lofts) 0.60
Walls earth touched 0.40
Walls (partition walls) between residential or operating units or
conditioned staircase 0.90
Walls against other structures at land or building site boundaries 0.50 Walls on small surfaces against outside air 0.70 Walls (partition walls) within residential and business units - Windows, window doors, glazed doors each in residential buildings
against outside air 1.40
Windows, window doors, glazed doors each in non-residential buildings
against outside air 1.70
Other transparent components vertical against outside air 1.70 Other transparent components horizontal or inclined to outside air 2.00 Other transparent components vertical against unheated building parts 2.50
Roof window against outside air 1.70
Doors unglazed, against outside air 1.70
Doors unglazed, against unheated building parts 2.50 Gates Rolling doors, sectional doors like against outside air 2.50
Inner doors -
Ceilings and roofs in each case against outside air and against roof areas
(ventilated or uninsulated) 0.20
Ceilings against unheated building parts 0.40 Ceilings against separate living and operating units 0.90
Ceilings within residential and operational units - Ceilings over outdoor air (for example over passages, parking decks) 0.20
Ceilings against garages 0.30
19
4. Requirements for parts of the technical building system
To limit heat dissipation, the heat distribution systems for space heating have to follow the technical measures illustrated in Table 2.9:
Table 2.9:Limits of technical measured for distribution system
Type of cables Minimum insulation thickness W
m K
Lines in non-conditioned rooms
2/3 of the pipe diameter, however, at most 100 mm
for cables in walls and ceiling openings, in the intersection of lines, at central
Cable network distributors
1/3 of the pipe diameter, however, at most 50 mm
Cables in conditioned rooms 1/3 of the pipe diameter, however, at most 50 mm
Cables in the floor construction
6 mm (can be omitted when laying in the Impact sound insulation in ceilings against
conditioned Spaces, of course without Reduction of footfall sound insulation)
20 5. Maximum coverable electricity required
The following electricity demand shares are considered to be covered by photovoltaic electricity (Table 2.10):
Table 2.10: Required percentage of photovoltaic electricity
Components Coverable portion
Space heating, heat supply (heat) 25 %
Space heating, power supply(aux.) 75%
Hot water, heat supply (heat) 50 %
Hot water, power supply (aux.) 75 %
Cooling energy requirement 25 %
Household Electricity / Electricity consumption 75% Solar thermal energy, auxiliary energy (aux.) 100 %
Lighting energy demand 0 %
Humidifying energy demand 0 %
AUSTRIAN CONVERSION FACTOR
The conversion factors used to determine the PEB (fPE), the non-renewable portion of the PEB (fPE, n.ern.), the renewable share of PEB (fPE, ern.) and CO2 (fCO2) are shown in Table 2.11.
Table 2.11: Austrian conversion factors
Energy carrier f PE [-] f PE,n.ern. [-] f PE,ern. [-] fCO2 g kWh Coal 1.46 1.46 0.00 337 Oil 1.23 1.23 0.01 311 Gas 1.17 1.16 0.00 236 Biomass 1.08 0.06 1.02 4
Electricity (Austrian mix) 1.91 1.32 0.59 276
District heating from renewable energy source 1.60 0.28 1.32 51 District heating from non-renewable energy source 1.52 1.38 0.14 291
District heating from high efficient cogeneration (default value)
0.94 0.19 0.75 28
District heating from high efficient cogeneration (best value)
≥ 0.30
according to individual certification
21 AUSTRIA COST-OPTIMAL METHODOLOGY
The calculation of cost-optimality in order to define NZEBs 2020 was carried out by OIB in March 2013. This calculation was based on three surveys conducted by the Austrian Energy Agency (AEA), the Energy Markets Analysis (e7) and the Technical University of Vienna.
To calculate cost-optimality, virtual buildings were chosen, which represented four different building categories, namely:
single-family house; multi-family house;
multi-storey residential building;
office or commercial building (non-residential building with natural ventilation). The calculation of the cost-optimality included the calculation of 4 parameters:
space heating demand kWh
m2 a
primary energy demand kWh
m2 a
CO2 emissions kg
m2 a , (according to the conversion factors in the OIB Guidelines)
total energy efficiency factor (fGEE)
The calculation of the cost-optimality consisted of a comparison between the value of the energy savings achieved using the different improvement packages and the costs that are directly and indirectly related to those energy efficiency measures alone.
Based on the outcomes of the cost-optimality methodology, the requirements for achieving NZEB levels – for both residential and non-residential buildings – were defined.
22
3 BUILDINGS
AND
BOUNDARY
CONDITIONS
3.1 S
IMPLE OFFICEOne of the first topic to investigate is to understand which could be the best possible way to simulate a building, taking into account both the accuracy and the effort to do it. For this purpose, a very simple office is considered (Figure 3.1). The office is from the project IEA SHC T56 – System Simulation Models (SHC Solar Heating and Cooling Programme - International Energy Agency, 2018)
All the walls are adiabatic except for the south façade, which is through the external environment. This characteristic was simulated by setting the temperature in the other virtual rooms equal to the one in the office. The main wall has three windows with shadings. The simple office is located in Rome, Italy. Climate data are assumed from Meteonorm (Meteonorm Software, 2018) and are shown in Table 3.1, 3.2 and 3.3.
23
Table 3.1: Main data climate, according to Meteonorm
Latitude 41.9°
Longitude 12.5°
Altitude 1 m
Table 3.2: Average monthly temperature [°C] , according to Meteonorm
Jan Feb Mar Apr May Jun Jul Aug Sep Oct Nov Dec
8.9 10.0 12.6 14.6 19.1 23.1 26.3 26.4 22.8 18.1 12.4 9.4
Table 3.3: Average monthly irradiation kWh
m2 month, according to Meteonorm
Jan Feb Mar Apr May Jun Jul Aug Sep Oct Nov Dec
Nord 12 18 26 32 46 52 48 39 28 22 15 12 Est 38 47 75 94 109 116 121 107 84 65 42 35 South 104 98 122 107 95 89 100 117 125 127 104 100 West 40 46 77 88 115 112 119 114 89 64 41 36 Horizontal 58 73 122 154 192 202 216 189 142 101 63 50
3.2 A
N-
DER-L
AN BUILDINGThe case study of a multi-storey Passive House is located in Innsbruck, Austria. Therefore, the climate data for Innsbruck are considered. Table 3.4 shows latitude, longitude and altitude.
Table 3.4: Main data climate, according to Meteonorm
Latitude 47.267°
Longitude 11.4°
Altitude 582 m
24
Table 3.5: Average monthly temperature, according to Meteonorm
Jan Feb Mar Apr May Jun Jul Aug Sep Oct Nov Dec -2.5 0.2 5.2 9.9 14.3 17.6 19.3 18.5 15.2 9.6 4.1 -0.9
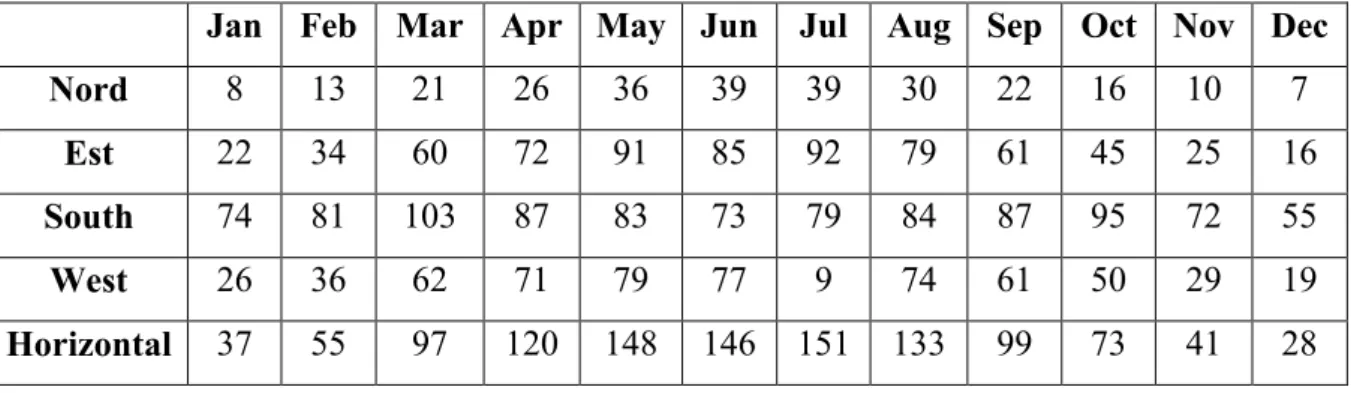
Table 3.6 shows the average monthly values of irradiation along different orientation kWh
m2 month .
Table 3.6: Average monthly irradiation, according to Meteonorm
Jan Feb Mar Apr May Jun Jul Aug Sep Oct Nov Dec
Nord 8 13 21 26 36 39 39 30 22 16 10 7
Est 22 34 60 72 91 85 92 79 61 45 25 16
South 74 81 103 87 83 73 79 84 87 95 72 55
West 26 36 62 71 79 77 9 74 61 50 29 19
Horizontal 37 55 97 120 148 146 151 133 99 73 41 28
The building has been built on a total area of 810 m2, it is composed by six storeys and a basement. The total area is of 1053 m2
Each floor is 3 m high. Since the roof is sloped, the fourth and the five floors have different area. Geometrical values for each floor are shown in Table 3.7
Table 3.7: Geometrical properties of each floor
Height [m] Area [m2] Volume [m3]
Basement 3.00 175 525 Ground floor 3.00 200 395 First floor 3.00 181 543 Second floor 3.00 181 543 Third floor 3.00 147 440 Fourth floor 3.00 103 308 Fifth floor 3.00 66 199 Total 21.00 1053 3615
25
Moreover, each storey has a different planimetry. Table 3.8 shows the spaces included in each floor. It has to emphasized that each apartment has a bathroom and a kitchen.
Table 3.8: Rooms in each floor
Basement Therapy room with kitchen, basement, storage room, 2 technical rooms, 3 WCs, 2 showers, 2 changing rooms Ground floor Living room, storage closet, office, conference room, WC,
equipment room, waste room, terrace
First floor 4 apartments
Second floor 4 apartments
Third floor 4 apartments
Fourth floor 2 apartments, WC, shower, changing room
Fifth floor Therapy room, WC, shower
There are 25 different walls, considering orientation, stratigraphy and tilt. Internal walls are not considered, since the whole building is considered as a unique thermal zone. Moreover, thermal bridges are not taken into account. For the sake of simplicity, they are gathered in 10 different walls. Table 3.9 shows the characteristics of the considered walls.
Table 3.9: Properties of the walls
Type of wall Orientation Orientation angle [°] Slope [°] Area [m2] U-value W m2K Thickness [m]
1 Outside wall South 176 90 285.2 0.125 0.453
2 Floor Horizontal 90 180 280.8 0.170 0.600
3 Outside wall North 0 90 148.1 0.125 0.453
4 Outside wall East 113 90 144.1 0.125 0.453
5 Roof North 0 59 188.0 0.166 0.463
6 Outside wall West 299 90 95.9 0.125 0.453
7 Roof Horizontal 342 0 82.2 0.109 0.558 8 Roof West 299 59 119.0 0.166 0.463 9 Earth retaining wall - - 90 225.6 0.199 0.513 10 Roof Horizontal 133 0 41.5 0.171 0.523
26
There are 10 different type of windows, considering type of glass and wall in which they are applied. For the sake of simplicity, they are gathered in 5 different windows. Table 3.10 shows the properties of the windows.
Table 3.10: Properties of the windows
Orientation Orientation angle [°] Slope [°] Ug W m2K Uf W m2K g- value [-] Total area [m2] 1 South 176 90 0.52 0.90 0.54 47.88 2 South 176 90 0.60 0.85 0.54 41.15 3 East 113 90 0.52 0.90 0.54 40.14 4 West 299 90 0.52 0.90 0.54 26.99 5 North 0 90 0.52 0.90 0.54 23.03 3.2.1 Photovoltaic system
A distinctive point of the building is the wide photovoltaic (PV) system. This covers the whole south façade of the building. Rectangular panels with different sizes are installed. Table 3.11 shows the amount of panels mounted on the façade.
Table 3.11: PV system in the South facade
Type Panel’s dimensions [m x m] Panel’s area [m2] Number of panels Total area [m2] 1 0.995 x 1.700 1.69 108 182.7 2 0.995 x 2.017 2.01 7 14.0 3 0.995 x 1.520 1.51 7 10.6
This numbers are based on the plan draw.
Since the average of area between the bigger and smaller panels (type 2 and 3) is equal to the medium surface (type 1), for sake of simplicity only characteristics of the type 1 panels are considered. Therefore, all panels are assumed as type 1 panels.
27 Technical data of the PV panels are show in Table 3.12
Table 3.12: Technical data of the PV system
Cell type Monocrystalline silicon
Maximum power (Pmax) [W] 220
MPP voltage (Vmpp) [V] 29.1
MPP voltage (Impp) [A] 7.56
Open circuit voltage (Voc) [V] 36.0
Short circuit current [A] 8.10
Temperature coefficients: NOCT [°C] 45 ± 3 Pmax % °C - 0.41 Voc % °C - 0.30 Isc % °C 0.03 Inverter properties: Nominal power [W] 9000 Overload 1.2 Efficiency [%] 0.90
Standby power consumption 0
3.2.2 Heating system
In the building the heating system is an electric system. This means that electric resistances are giving heating to the room, in order to maintain the desired set point temperature, that is 20 °C. This system allows to not have dedicated room for heating technology and no distribution – ascending pipes. This also means that the distribution losses are avoided. The only losses to consider are the thermal loss through the boiler surface and the distribution losses from the boiler to the sinks. Actually, the latter are not taken into account in the comparison between different systems, since they are produced in any case.
In each room electric surfaces of different size are installed. Emitters in each floor are shown in Table 3.13.
28
Table 3.13: Emitters for each floor
Floor Emitters Total nominal power [W]
Basement 4 x 500 W 2 x 750 W 3500 Ground floor 1 x 250 W 2 x 500 W 2 x 750 W 2750 First floor 4 x 250 W 1 x 1000 W 3 x 1250 W 5750 Second floor 4 x 250 W 1 x 1000 W 3 x 1250 W 5750 Third floor 1 x 50 W 3 x 250 W 3 x 1000 W 1 x 1250 W 5050 Fourth floor 2 x 250 W 1 x 500 W 3 x 1000 W 4000 Fifth floor 1 x 250 W 1 x 1000 W 1 x 1250 W 2500
Therefore, the total power installed for the heating system is 29.3 kW.
Furthermore, the ventilation system is assumed constant during the year. The monthly energy required is supposed equal to 0.480 kWh.
29 3.2.3 Domestic hot water preparation system
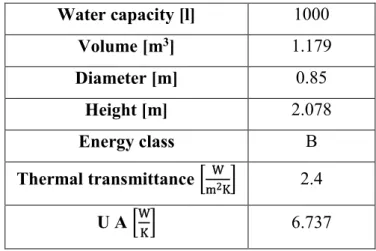
The system for the preparation of the DHW is electric too. This means that electric resistance heats water content into a boiler. In the bathroom of each apartment a boiler of 50 litres is installed. So there are totally 14 boilers of 50 litres capacitance. Moreover, for the common area, three boilers of 12 litres are provided. Technical data about boiler are shown in Table 3.14.
Table 3.14: Technical data of the boilers
Apartment boiler Common area boiler
Water volume [l] 50 120
Volume [m3] 0.05 0.12
Diameter [m] 0.273 0.369
Height [m] 0.854 1.122
Nominal electric power [W] 3000 3000
Energy class B B Thermal transmittance W m2K 1.059 0.789 U A W K 0.9 1.2 Water conductivity W m K 0.6 0.6
For both boilers the required temperature of the water after the boiler is 60 °C in order to avoid the Legionella risk. After, the water is mixed with water from the tap (at averagely 10 °C) in order to obtain the desired mass flow at 48 °C.
The DHW profile are esteemed based on the IEA SHC & HPP T44/A38 (Halleretal., 2013). (Haller , Dott, Rusche nburg, Ochs, & Bony,
2013)Since the study presented in the document refers to a family, trends are scaled down in the
more truthfully possible way. Different trends are assumed for the apartment boilers and for the common area boilers and different water requested are considered. In any case, daily profiles are considered and kept unchanged for all the days of the year. In particular, two different profiles are assumed for the apartments, they are called A1 and A2 (half of the apartments follows trend A1 and the half the trend A2). While for the three common boiler are assumed three different profiles, called C1, C2 and C3. The apartment profiles are assumed for one person. C1 profile is assumed for 24 persons (14 patients and 10 operators during the day), while C2 and C3 profile are assumed for 5 persons (only working and not living in the building). The DHW profiles are illustrated in Table 3.15.
30
Table 3.15: DHW profiles
Time A1 A2 C1 C2 C3
7.00 Floor clean.
7.15 Shower Small tapping Shower
7.30 Small tapping 8.00 Small tapping 8.30 Small tapping 8.45 Small tapping 9.00 Small tapping 9.15 Small tapping 10.00 Small tapping 10.30 Small tapping 10.45 Small tapping 11.00 Small tapping 11.15 Small tapping
12.00 Small tapping Small tapping Small tapping
12.15 Small tapping Small tapping
12.45 Dish wash. 14.00 Small tapping 14.30 Small tapping 14.45 Small tapping 15.00 Small tapping 15.15 Small tapping 16.00 Small tapping 16.30 Small tapping 16.45 Small tapping 17.00 Small tapping 17.15 Small tapping 18.00 Small tapping
19.00 Small tapping Small tapping Small tapping
19.15 Small tapping Small tapping