School of Industrial and Information Engineering
Master of Science in Management Engineering
AN EMPIRICAL ANALYSIS ABOUT VENTURE
CAPITAL IMPACT ON EUROPEAN
PORTFOLIO COMPANIES PERFORMANCES
IN CLEANTECH
Supervisor: Prof. Annalisa Croce
Co-Supervisor: Prof. Roberto Bianchini
Authors: Ginevra Ballerini 883120
Abstract
Environment health is the topic at stake today. Governments, supra-national institutions along with local communities are calling for the transition to a low-carbon economy and mobilizing to work it out. Nonetheless, a pivotal contribution would be given by the massive introduction of sustainable business models through which companies deliver their value proposition.
Cleantech is one main emerging category in this scenario and it encompasses those technologies capable of generating yield for investors and, at the same time, reducing the negative impact on the environment. As the goodness of these business models is often not proven in the market, the capital provision from risk prone investors is necessary. In the current academic literature, the extent to which venture capital can be the main ambassador in sustaining with capital and expertise the environmental revolution is an open question.
This work is exclusive in its purpose. It investigates the relationship between venture capital and portfolio companies’ performance in cleantech in the European landscape, and it is supported by an econometric analysis. To carry out the empirical study, we resort to the VICO database and single out cleantech companies, while the control group is extracted from Orbis. Firms included were born between 1989-2014 and invested between 2005-2014. The econometric analysis is divided in two parts: the first model relates the probability to grow after the investment to VC and its characteristics, and it aims at studying the monitoring and value adding capabilities of such investors; the second model relates the probability to get invested to the operating performance before the investment, and it aims at detecting the screening capabilities. The results are noteworthy: we find that VC-backed companies are more likely to grow in terms of intangible assets after the investment, while there is no significant impact on the growth of sales and headcount. It seems that VC does intensive R&D activity but that it lacks technical expertise. Concerning the screening process, VC invests in less profitable and smaller companies, while patents do not act as a
signal. On the whole, there is no empirical evidence that VC is about to spur the development of cleantech.
Sommario (Italian version)
Oggi la salute ambientale è diventata un tema di discussione quotidiano. Governi, organizzazioni internazionali e comunità locali di tutto il mondo si appellano ad una nuova economia a basse emissioni ed esortano a trovare quanto prima una soluzione. Nondimeno, l’introduzione di business model sostenibili, attraverso cui le aziende trasmettono la loro
value proposition, costituirà un contributo di primaria importanza.
Su questo sfondo si erge il cleantech, un settore emergente che comprende tutte quelle tecnologie in grado di generare un profitto per gli investitori e al contempo ridurre l’impatto negativo sull’ambiente. Dato che l’efficacia di questi business model non è ancora testata sul mercato, sono necessari investimenti che finanzino progetti ad alto rischio. Nella letteratura scientifica, rimane una questione irrisolta fino a che punto il venture capital potrà essere l’ambasciatore di questa rivoluzione ambientale, tramite l’apporto di capitale e delle competenze tecniche e manageriali in suo possesso.
Questo lavoro è unico nella sua finalità: nel contesto europeo, si indagano le correlazioni tra il venture capital e le performance delle società nel portafoglio, attraverso il supporto di uno studio econometrico. Per svolgere l’analisi empirica, abbiamo attinto al database VICO Updated e selezionato le aziende con un modello di business cleantech, mentre il campione di controllo è stato estratto da Orbis. Le imprese del campione sono state fondate tra 1989-2014 e investite da fondi di venture capital tra 2005-2014. L’analisi econometrica approfondisce due aspetti: il primo è la verifica delle capacità di monitoring e di value adding dell'investitore, analizzando la probabilità di crescere una volta ricevuto l’investimento del venture capital e le sue caratteristiche; il secondo invece, studia la probabilità di essere investite legata alle performance operative antecedenti l’investimento, con l’obiettivo di individuare eventuali capacità di screening.
I risultati ottenuti sono degni di nota: troviamo che è più probabile che le aziende investite dal venture capital accrescano i beni intangibili (cioè gli intangible assets) dopo l’investimento, mentre non è visibile un impatto significativo sulla crescita delle vendite e
dell’organico. Sembra che il venture capital svolga un’ intensa attività di ricerca e sviluppo ma manchi di conoscenza tecnica. Nel processo di screening, il venture capital preferisce finanziare imprese più piccole e meno profittevoli, mentre i patents non riescono ad attrarre ulteriori investimenti.
Alla luce dei risultati, non troviamo evidenza empirica del fatto che il venture capital possa dare un contributo importante alla fioritura del cleantech.
Acknowledgements
In this section we would like to sincerely thank all the actors that have made a contribution to our thesis.
First of all, we would like to express our appreciation to our thesis superivisors: Prof. Annalisa Croce and Prof. Roberto Bianchini. She has taught us the logics underlying the management of a database and the constrution of an empirical model, capable to respond in a scientifc way to a research question. Nonetheless, she has taught us the arts of precision and accuracy. Instead, Prof Bianchini has driven us in the phase of data gathering and has introduced us to the cleantech world, imparting the interest on it.
Moreover, we would like to thank the Management Engineering department of Politecnico di Milano, that let us work on the VICO database.
Again, a special thanks to Politecnico di Milano and all the professors for having enriched us, both at the academic and personal level. We are very proud of having the opportunity to study in one among the academic excellence in the international landscape. Exams held as well as the difficulties provided us with a method to tackle any kind of problem.
Finally, we thank our families and friends, for the support and the love during the most difficult periods of these years.
Executive summary
This work can be a little contribution to the global environmental cause. It is a study about the impact of venture capital on portfolio companies’ performances in cleantech, that is a “new technology and related business models that offer competitive returns for investors
and customers”, while “greatly reducing or eliminating negative ecological impact, at the same time as improving the productive and responsible use of natural resources.” (The
Cleantech Group). As this category encompasses a broad range of technologies and usages, from the public utilities’ production of renewable energy to the optimization of households-level gas and power consumptions, cleantech’s flourishing is likely to be pivotal for the transition of the whole system to a low-carbon economy (LCE). Nonetheless, to spawn a canvas of cleantech technologies, both capital injection and expertise must be channelled to ideas and early-stage projects, because the success will depend on the capability of such ventures to be profitable. This analysis is exclusive and relevant in inquiring the impact of a private investor category (i.e. venture capital) on investee companies’ performances, through a quantitative method, since the ultimate purpose for investors (and for society in this case) is to sell these companies’ shares through IPOs or M&As.
While incumbents are good at bringing about incremental innovation, entrepreneurial ventures are necessary for the introduction of quantum leap technology. Big corporations can count on internal financial resources and often on external ones. Differently, start-ups, that generate almost zero or no cash and deliver new value propositions, depend upon the financial provision of risk-prone investors. Among these ones, venture capital (VC, hereafter) is a main actor. Kortum & Lerner (2000) find that VC abilities in spurring innovation is three to four times more successful than corporate R&D. Radical innovation is core for that process that Shumpeter calls “creative destruction” (Schumpeter, 1942) and that is a force making markets working efficiently (i.e. dynamic efficiency). Indeed, VC’s investment targets are emerging sectors, such as software/IT and biotech (for instance, in 2014, in US, the biggest VC market, almost 90% of capital is invested in high-tech sectors, according to Teker, Teker, & Teraman (2016)). Cleantech
represents a new target sector; the share of VC investments in cleantech has grown from 2% to more than 10% in the last decade (Usher, 2008).
O’Rourke (2009) divides the evolution of the definition of cleantech into three distinctive phases: at the onset in 90s, cleantech concept appears in discourses but is not a legitimated and recognised category among environmental technologies; in the second phase, from 2002 to 2004, the two major organizations sponsoring cleantech, the Cleantech Group and Clean Edge, introduce this technology to the North America’s VC community, sponsoring it as a new investment category; the last phase is marked by the entrance in the mainstream media in 2006 and a peak of investments in 2008. Is it worth noting that the definition modelling was mated by increasing capital flows and greater interest to the sector. Given the broad spectre of the industries in which cleantech business models compete, as well as the public good nature of their value proposition, there are several stakeholders playing a primary role in their development: incumbents of traditional Oil&Gas industry, that face the double nature of opportunity (for new market shares) and threat (of substitution, according to Porter’s five forces model (Porter,1989)); VC and financial institutions, as capital providers; governments and sovra-national entities that engage to tackle the negative externalities of pollution and global warming, and promote the transition to a low-carbon economy.
Some studies aim at inquiring which are the determinants of VC investments in cleantech sector. Those are regulatory environment, energy price & stock returns, media coverage, Hofstede cultural dimensions (Hofstede, 1984).
Public policy is a driver in shaping the regulatory context. According to Giudici, Guerini, & Rossi-Lamastra (2017), the need for governmental intervention is rooted in the peculiar nature of cleantech business, which makes tailored incentives and regulations a fundamental pre-requisite for the success of the industry. There are two main categories of public policies: technology push and market pull. Technology push policies contribute to the supply of technology and concern public grants, loans, R&D financial aid for early stage investments, training programs and governmental VC. Market pull policies contribute to the demand of technology and concern public procurement, feed-in tariffs, renewable portfolio
standards and measures that incentivize the adoption of firms and consumers. Many experts agree that the two approaches are complementary and a case study by Klaassen et al. (2005) on Denmark, Germany and UK validate this thesis. For instance, Denmark between 1979-1989 implemented jointly a system of subsidies for installation of wind turbines and an R&D program, while UK in the early 90s suffered a shortage of R&D expenditure despite it was able to drive down market prices. The most favourable environment would include “a stable,
long-term, transparent and predictable regulatory environment.” (European Commission,
2016). Indeed, long term policies such as feed-in tariffs and quantity renewable standards (rather than fiscal incentives, for instance, that are perceived as short term measures) are among most preferred policies when surveying VC (Bürer & Wüstenhagen, 2009) and most determinant when observing correlation with VC deals (Menon and Criscuolo, 2015).
Stock market and commodity prices may be drivers for the VC investments in cleantech. Colombo et al. (2016) and also Kumar et al. (2012) find that increasing oil prices poses an incentive to invest in alternative sources of power. Colombo et al. (2016) find also a positive correlation of media coverage with VC cleantech deals. Doing advertising, informing stakeholders and potential shareholders about benefits, along with making the products fashion, help in building image and reputation of the sector. From a cultural point of view, referring to the Hofstede model (Hofstede, 1984), uncertainty avoidance is negatively correlated with the number of deals (Colombo et al., 2016).
However, there are some tricky aspects in the relationship between VC and cleantech. These are related to the Cash Flow Valley of Death, Managerial Valley of Death, and exit mechanisms for start-ups along with the commodity nature of energy.
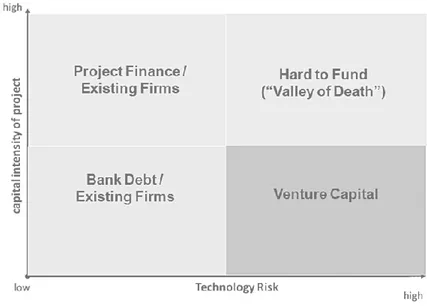
Under certain circumstances, VC is not able to provide capital to cleantech due to structural problems. The proper mode of funding for a general project depends upon the level of risk associated to the technology and the level of capital intensity. Projects characterized by low level of risk get funds from traditional institutions such as banks, while VC build high-risk portfolios financing several technologies (to diversify risk) characterized by low capital intensity. The Cash Flow Valley of Death concerns those cleantech projects highly risky and capital intensive, such as offshore wind farms or advanced biofuel
refineries. The order of magnitude for capital intensity can dwarf VC size. For instance, Solyndra, a former producer of photovoltaic systems, had to raise about $970M in equity and $500M in debt before going to IPO, while Google just $40M (considering a typical $300M VC fund).
Concerning the Managerial Valley of Death, managers approaching cleantech that come from Oil&Gas incumbents, fail in leading entrepreneurial firms where competition is high and cash flow is limited, while VC-based entrepreneurs may have not the capability to manage commodity pricing and regulatory uncertainties (Ghosh & Nanda, 2010). Randjelovic et al. (2003) also point out a lack of managerial skills in green sector.
Exit mechanisms can be critical for cleantech. It is observed that, while for IT and biotech industries incumbents are prone to buy start-up, Oil&Gas giants intentions are ambiguous. Zhong & Bazilian (2018), focusing on the role of Oil&Gas established companies concerning the current energy transition, look at their budget share pledged for renewable energy CAPEX. For instance, Shell, the biggest player in the industry, in 2016 reported a CAPEX of $200m on renewable. It is a very small percentage on $80bn revenues (2016 Shell Annual Report, 2016). It is possible that established traditional energy firms see themselves in the same situation as Laio, father of Edipo, when he was told by the oracle that the son will grow and kill him. Not willing to end up as Laio, they give up on feeding these start-ups. A visible lack of trust of established giants towards cleantech companies may further freeze-up funding upstream the innovation chain, with VC not envisaging exit opportunities.
Finally, the commodity nature of the final product is another important issue. In biotech and IT, companies try to offer cutting edge products that meet the always fickler customers and their needs, and this leads incumbents to compete in acquiring start-ups to spot opportunities. Being energy a commodity, except for few ideological green people, it is the same whatever the source of production. An end-user cannot tell the source of production.
Although there is widespread interest in understanding the current context in cleantech, inquiring which policies are most preferred by VC or which variables are
positively correlated with VC deals, no extant literature has tested the operating impact of VC on portfolio companies’ performance in cleantech. This is likely to be relevant for the deployment of cleantech as well.
Academic research on the impact of VC on investee companies divides into two big families of research questions: the survival probability (and types of exit) and the economic, financial and operating performances.
VC can show monitoring capabilities, improving the performance of investee companies and/or leading them to positive exits, and screening capabilities, in detecting the most promising business models.
Berger & Udell (1998) argue that a VC company is welcome by entrepreneurs as it provides not just capital, but also post-investments monitoring and value adding services such as networking with customers and suppliers, knowledge and moral support. Performing well such activities brings about benefits both to the investor (through higher return) and to the entrepreneur (through improvement of performance). Alemany & Martí (2005), among others, find that VC backed firms grow more than non-VC backed after the investment. Given the heralded managerial valley of death in the sector, it is worth testing whether their results hold in cleantech.
H1. VC-backed cleantech companies are more likely to grow than non-backed cleantech ones after the investment.
However, VC investments can differ along many dimensions, both investors-specific (e.g. private venture capital vs governmental venture capital) and investment-specific (e.g. syndicated investments vs non-syndicated ones). D. J. Cumming & MacIntosh (2007) state that the difference in performances can originate from the different governance. Alperovych et al. (2015) underline a different contribution to efficiency improvement within the VC categories, pointing out that GVC investments can cause a degradation in efficiency. It is worth to inquire the difference among VC types.
Syndication is another alternative to explore. The participation of more than one investor can be a potential source of augmented capability both in the screening process thanks to double control (Gompers & Lerner, 2004), and in the monitoring and controlling process, enjoying synergies in advising. The downside can be the emergence of communication costs (Cumming et al., 2007).
H3. Syndication of VC investments (i.e. the presence of more than one investor) in cleantech increases the odds of growth for investee companies.
Demographics characteristics of investors can be relevant as well in the outcome. Alemany & Martí (2005)’s study shows that VC experience results determinant in the outcome. The participation to company’s boards let VC share its expertise and knowledge (MacMillan et al. 1989; Hellmann and Puri, 2000; 2002). Moreover, the provenience of investors can be another relevant variable. Cumming et al. (2017) posit positive correlation of the geographic distance between investors and entrepreneurs and the exit outcome.
H4. Experience of VC investors in cleantech increase the odds of growth for investee companies.
H5. Cross border investments of VC in cleantech increase the odds of growth for investee companies.
VC’s investments are not randomly targeted: they often show pre-investment screening capabilities, acting as a ‘scout’ in the selection of better performing firms (Baum & Silverman, 2004; Chemmanur et al., 2011; Chemmanur et al., 2011). Along with superior operating performance, VC-backed firms are likely to be more innovative than non-backed ones, and patents can be a signal, to overcome information asymmetries and attracting VC (Lahr & Mina, 2016).
H6. VC-backed cleantech companies show higher performances than non-backed ones before the investment.
H7. VC-backed cleantech companies show a higher innovation rate than not backed ones before the investment (i.e. patents act as a signal).
The hypotheses get tested through an econometric analysis. Data for invested firms and rounds characteristics are from VICO Updated, the database on entrepreneurial VC-backed ventures in the European landscape. The control group comes from Orbis. For each invested firm, it gives 10 non invested similar companies in terms of age, industry and country. Once the database is built, cleantech companies are identified through a text analysis on the items describing the business activity. The dictionary for the text analysis resembles that one used (with similar goals) by Douglas J. Cumming et al. (2017). For English and Italian companies already present in the old version of VICO, a manual check on websites is carried out to detect the cleantech nature. Additional cleantech companies are identified in the historical annual rankings published by the Cleantech Group, considering just European ones.
After dropping the observations without sufficient variables to observe, we get the screening sample, made of 138 VC backed firms observed only in the year of the first investment, and 1349 non-VC-backed companies. On this sample, we perform a propensity score matching to control for selection and we get the monitoring sample, made of 684 companies, of which 135 invested.
A Probit model is used to test the hypotheses. For monitoring (H1-H5), growth is the dependent variable. Performances observed for growth are sales and employment (as most studies), total assets and intangible assets (as Alemany & Martí 2005) and fixed assets. For screening (H6-H7), the investment is the dependent variable. Regressors are control variables along with ad-hoc built dummies to test the hypotheses.
The results are unexpected. In general, VC backing has positive and statistically significant impact on the growth of intangible assets. We find also that more aged VC has a bigger statically significant impact than younger VC on the growth of sales, but neither of them is significant for the whole model. Concerning the other VC characteristics, the differences between the coefficients are not statistically significant.
The lack of capability to increase performances as sales and employment entails that cleantech firms may need more time to scale-up and have a relevant impact on local area. As Ghosh & Nanda (2010) argue, the required timespan of VC holding can be longer than
the usual 3-5 years in alternative sectors as IT. Moreover, the results can be read as a partial evidence of the Managerial Valley of Death. Concerning screening capabilities, VC selects less profitable and smaller cleantech companies, and this is in line with literature on VC screening, but there is no evidence that most growing firms get the attention of investors. Furthermore, we do not find evidence that patents act as a signal to attract VC.
There are margins to improve our work in developing a more sophisticated model to detect cleantech companies in the initial database, considering a larger sample beyond European ventures, accounting for differences across cleantech sectors, along with testing the hypotheses with other econometric models (also accounting for short term and long-term impacts).
Table of Contents
Introduction ... 1
1 Literature Review ... 3
1.1 Venture capital in a new emerging sector ... 3
1.1.1 Venture capital for innovation ...3
1.1.2 Brief historical account of the rise of cleantech ...5
1.2 Forces pushing VC to cleantech ... 11
1.2.1 Public policy ...12
1.2.2 Other economic, social and cultural forces ...18
1.3 VC funding in cleantech ... 20
1.3.1 Inefficiencies in the market for VC capital ...20
1.3.2 The cash valley of death ...22
1.3.3 The managerial valley of death, exit opportunities, commodity nature of energy ...29
1.4 VC impact on portfolio companies’ performance ... 31
2 Research Question & Methodology ... 37
2.1 Theory & Hypotheses development ... 37
2.2 Methodology and data ... 43
2.2.1 Overview of the cleantech market ...43
2.2.2 Sample construction ...46 2.2.3 Model specification ...50 2.2.4 Descriptive statistics ...55 3 Results ... 63 4 Discussions ... 69 5 Conclusions ... 71 6 Bibliography ... 73 Appendix ... 83
List of Figures
Figure 1 Vc $Bn Investments Around The World. Source: (Teker Et Al., 2016). ... 4 Figure 2 Vc Investments Share In Us For Main Sectors. Source: The Cleantech Group. ... 5 Figure 3 The Adoption Of ‘Cleantech’ Term In Scientific, Business And Medicine Researches (Caprotti,
2016). ... 8 Figure 4 Number Of Printed Media Articles Reporting Cleantech From 2002 To 2006. Source: O’rourke
(2009) ... 8 Figure 5 Use Of ‘Cleantech’ In Scientific And Business Disciplines, Compared With Capital Flows Trends,
1990-2009. Source: Caprotti (2016). ... 10 Figure 6 Correlation Between Oil Price And Cleantech Investments. Source: Bloomberg, New Energy
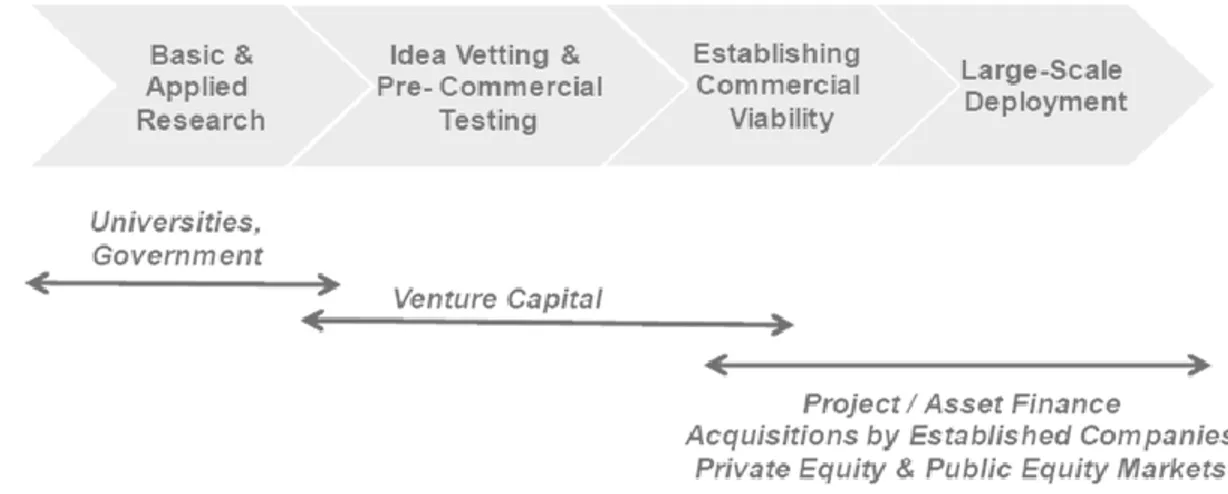
Finance (2012). ... 18 Figure 7 The Matrix Ranks At High Level The Relation Between Type Of Technology And Financial Actor. Source: Gosh And Nanda (2010). ... 22 Figure 8 Innovation Chain For A General Technology And Financial Actors. From Early Stages Through
Later Ones, The Financial Actors Involved Are Designed To Bear Decreasing Risk Levels. Source: Gosh And Nanda (2010). ... 23 Figure 9 Innovation Chain For A Cleantech Technology. It Provides Information About The Two Phases Of
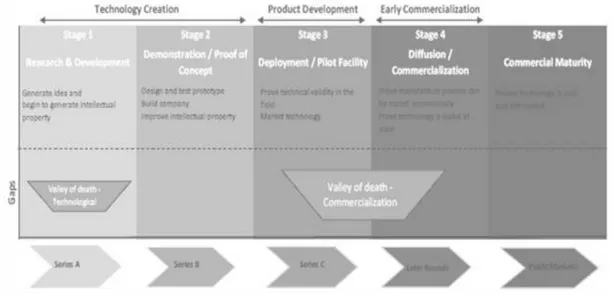
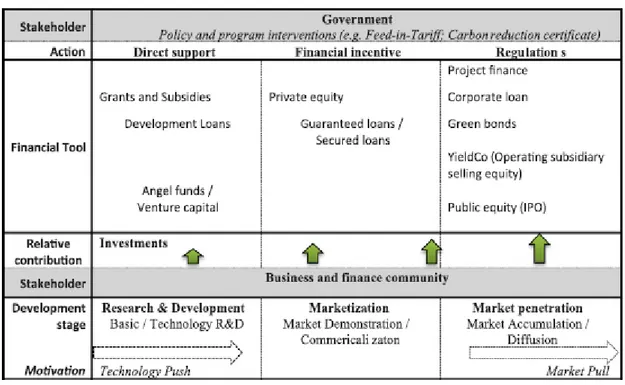
Shortage Of Funding For These Types Of Technologies. Source: Bloomberg, New Energy Finance, 2010. ... 24 Figure 10 Diagrammatic Model Of The Relations Between Stakeholders, Cleantech Projects Stages And
Financial Tools. Source: Law And Lam (2018) ... 25 Figure 11 Breakdown Of Vc Portfolio. This Analysis Is Carried Out By William Sahlman, Based On 468
Investments For The Fund From 1990-2006. Source: Gosh And Nanda (2010). ... 26 Figure 12 Portfolio Example For A $300m Vc Fund. Source: Gosh And Nanda (2010). ... 27 Figure 13 The Matrix Classifies Cleantech Technologies According To Level Of Technology Risk And
Capital Intensity. Source: Gosh And Nanda (2010) ... 28 Figure 14 Global Investment In Clean Energy By Region. Source: Bloomberg New Energy Finance (2018).
... 44 Figure 15 Investments In Clean Energy In Emea By Sectors. Source: Bloomberg New Energy Finance
(2018). ... 45 Figure 16 Global Clean Energy Investors. Source: Bloomberg New Energy Finance (2018). ... 45 Figure 17 Venture Capital Investments By Sector. Source: Oecd (2017). ... 46
List of Tables
Table 1 Cleantech Phases (O’rourke, 2009). ...6 Table 2 Main Actors Participating To The Cleantech Definition. ...11 Table 3 Descriptive Statistics On The First Vc Round. ...55 Table 4 Distribution Of The Matched Cross Section Sample And The Empirical Sample By Country,
Industry And Foundation Period. ...57 Table 5 Determinants Of The Likelihood Of Receiving Vc Investments. ...58 Table 6 Descriptive Statistics Of Performance Variables. Significance Is Defined As: * P<.15. ** P < .10.
*** P < .05 ...59 Table 7. Descriptive Statistics On Performances Difference Variables. Significance Is Defined As: *=
Significant At 15%; **= Significant At 10%; *** = Significant At 5%...60 Table 8 Descriptive Statistics For Selection. Significance Is Defined As: *= Significant At 15%; **=
Significant At 10%; *** = Significant At 5%. ...61 Table 9 Impact Of Vc On Firm's Likelihood To Grow. ...64 Table 10 Screening Results. *** = Significant At 1%; ** = Significant At 5%; * = Significant At 10%. ...67
Introduction
The last 15th March 2019, the global community was called by a sixteen Swedish girl, Greta Thunberg, to take to the streets and demonstrate against climate change. There is an urgent necessity to deal with issues regarding the mitigation of climate change and the relative effects, as warming temperatures, changes in precipitation and sea level which, in turn, will affect water supply and quality, habitat, and food production. Harmful effects of the human activity cannot be neglected anymore and compel the whole world to figure out a new technological and economic paradigm, based on cleaner and sustainable technologies.
Clean technologies started to arise in early 90s, as a subset of environmental ones, and entered into the mass market in the middle of ‘00s. Nonetheless, during the last 20 years, their adoption did not gain a foothold in the market, remaining stagnant and bogged down at an embryonal status. But now things seem to have turned around. People are asking more attention to the environment, more respect, along with sovra-national organizations that are goading single governments to give a momentum to cleantech innovations adoption. The time strikes as being ripe for change.
Since its dawn, venture capital firms have devoted a consistent amount of capital flow to finance cleantech high-growth potential ventures, identified as risky investments delivering highly profitable yields. In combination with governmental R&D and appealing policy schemes, venture capital looks like one of the crucial actors in charge of driving the transition.
The scope of this study is to assess to what extent VC’s engagement in cleantech equities will lead positive impact on performances. The focus is on a sample of 684 European cleantech firms, being VC-backed along the time period between 2005 and 2014.
The current state of research highlights some challenges peculiar to the sector that would dampen cleantech firms’ performance: the lack of managerial skills and undefined exit mechanisms, together with capital intensive projects, turn VC’s preferences towards other choices, as biotech and IT sectors. Also, the commodity nature of energy put VC under
ambiguous conditions prejudiced by political regulations. Academics agree on performances that VC brings value adding and monitoring services during the holding period, ensuring more efficient outcomes to investee companies. Instead, there is a mixed evidence on the capabilities of VC to screen the most promising enterprises, given the high number of failures.
The present work aims at bridging a gap in the literature, covering the VC impact on cleantech ventures performances both in the pre- and post-investment stages. The analysis is undertaken through an econometric approach: two models are developed to distinguish between the selection and the monitoring analysis, and test what accounting variables are more affected by VC’s intervention.
Overall, the work is developed as follows: in the literature review, the features bonding cleantech to venture capital are deeply discerned, with references to the major academic results. In section 2, we conceive the research question standing our study and afterwards, the econometric analysis on VC’s impact on performance is drafted. Once reported the results, they are discussed and compared to the literature. At the end of the work, conclusions are drawn together with some insights for further research.
1 Literature Review
1.1 Venture capital in a new emerging sector
1.1.1 Venture capital for innovation
The social sphere needs innovation, because new issues, such the environmental one, can be tackled with anything but new solutions. Schumpeter called for creative destruction for the market to work efficiently (Schumpeter, 1942). Radical innovation in general comes from Start-ups, ventures that deliver their value proposition with a new, unproven business model. Hockerts & Wüstenhagen (2010) state that incumbents are better at introducing incremental innovation, while start-ups are more suitable to introduce quantum-leap solutions. They are engine for innovation.
Venture capital (VC, hereafter) is a financial actor that helps new business models’ development across the different phases of the lifecycle (P. A. Gompers & Lerner, 2004). Therefore, VC plays a crucial role in the introduction of new technology, better than other alternatives. For instance, Kortum & Lerner (2000) find that venture capital is three to four times more powerful than corporate R&D in spurring innovation. Florida & Smith Jr (1990) and Kortum & Lerner (2001) state that experience and business cases across different industries demonstrated that VC and private equity investments can significantly accelerate the market diffusion of new technologies. Hall et al. (2005) argue that VC is the appropriate form of external capital to support innovative small-medium enterprises because specialized and knowledgeable VC investors can overcome information asymmetries. Moreover, since the firm (the entrepreneur provides technical expertise) needs also advising and strategic management capabilities, the expected value added that the investor brings in terms of business experience and network of contacts is valuable (Hellmann & Puri, 2000; Hsu, 2004; Zook, 2004).
Unfortunately, VC is both still underdeveloped at the aggregate level and unevenly distributed geographically. The biggest VC market are US, Canada and UK, while the European Union is striving to spur entrepreneurial finance. As Balboa et al. (2017) argue, VC markets did not evolve in Europe as they did in US due to the lack of some necessary conditions in the environment. The differences of culture and language between European countries are likely to raise important barriers, and information asymmetries. But also, as Teker et al. (2016) argue, country-specific factors for the development of VC are its cultural look over entrepreneurship, intellectual property protection, efficiency of capital markets, tolerance for failure and infrastructure for services. In Europe there is shortage of them.
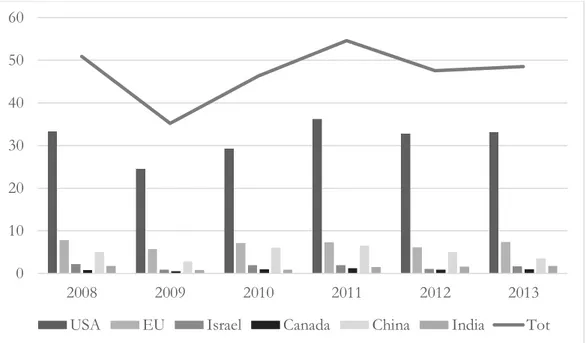
VC funds show several varieties of governance, they can be both public and private. In Europe, to counterbalance the lack of private investors, policymakers have been promoting the establishment of governmental VC (Colombo et al., 2016). As the graph below shoes, US is the biggest market for VC finance (Figure 1).
Concerning the industrial distribution, in US in 2014 $35,7bn were invested in software/IT (70% of total investments), $8,8bn in biotech/medial (17%), while just $5bn in non-high-tech sectors. Conversely, in Europe the most attractive sector is the consumer products one.
Figure 1 VC $bn investments around the world. Source: (Teker et al., 2016). 0 10 20 30 40 50 60 2008 2009 2010 2011 2012 2013
A new category of investments, transversal to traditional sectors, toward which VC has been channelling a relevant amount of capital in the last years, is cleantech. Pernick and Wilder define “clean tech” as “any product, service, or process that delivers value using
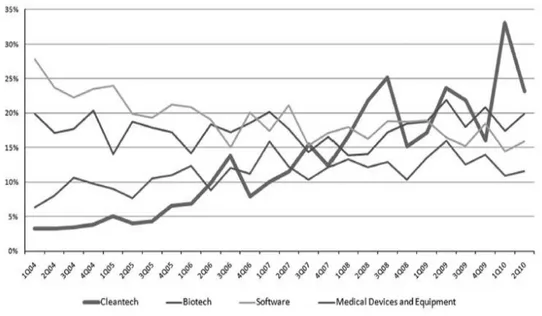
limited or zero non-renewable resources and/or creates significantly less waste than conventional offerings” (Pernick R. & Wilder C., 2007). Since 2004, the share of VC
investments in cleantech in US has soared from less than 5% to more than 20% in 2010 (Figure 2), while globally it has soared from 2% to more than 10% (Usher, 2008).
Figure 2 VC investments share in US for main sectors. Source: The Cleantech Group.
1.1.2 Brief historical account of the rise of cleantech
The concept of cleantech is relatively new, the limited timespan through which the concept of cleantech has taken form counts barely 20 years, since the beginning of 90’s to the first decade of the new millennium. O’Rourke (2009) portioned the evolution of the definition of cleantech into three distinctive phases (Table 1). Below, each single step is described.
At the beginning, cleantech innovations were categorized as other type of technologies because the category did not have a singular identity. But, before receiving substantial financial flows, cleantech waited to be introduced to the venture capital
community by the Cleantech Group (CG) and Clean Edge (CE). They showcased the new environmentally-friendly and economically worth technologies to funding providers and gave legitimacy to cleantech as a technology and an organizational field. The last phase of cleantech highlights an essential change: it was approached to environmental issues and so became an applicable solution to tackle global threats.
Phase Description Phase 1
1995-2000
At the very early stages, clean technologies did not constitute per se a legitimated and recognized category, but were part of a wider set of technologies, as environmental technologies, or indeed included in other investment categories, that, however, did not attract vast amounts of capital. Cleantech was a niche investment category.
Phase 2 2002-2004
From 2002 onwards, the concept took a breath outside technological contexts and was presented to the venture capital circle in North America, that made it a novel favourable financial area. In addition, the Cleantech Group and the Clean Edge linked it to other legitimate technology and organizational fields.
Phase 3 2005-2006
Cleantech attracted investors and a wider audience, cleantech was more actively linked to salient macro-issues and current events such as energy security, climate change, oil prices and job creation.
Table 1 Cleantech phases (O’Rourke, 2009).
The first time the word “cleantech” appeared in a press article was in 1990, in the annual report of the United Nations Economic and Social Commission for Asia and the Pacific (UNESCAP). The publication referred to the CLEANTECH 1990 Exhibition, an event held in Bangkok aimed to sensitize about contemporary developments in “clean, low-waste and pollution control technologies” (UNESCAP, 1990). After an event worth on international scale, the deployment of cleantech concept remained constrained to engineering and material science fields, with a very specific meaning. At that time, the financial landscape was hostile: the IT investing boom and the dot.com crisis, together with the seemed preconditions to enter the sector (i.e. specialized skills and a more patient capital) deflected the attention to other investment opportunities. During 90s’ Cleantech was a niche investment category.
The new millennium signed the emergence of cleantech as a novel investment category. By the end of 1990s it spread outside the scientific circles and reached business and economic contexts. In Figure 3 it is tracked the use of cleantech as a term in science, business and economics, medicine and pharmacology. As the brown line suggests, the term
adoption in business slowly continued to increase from ‘90s to 2010, with 2002 as turning point. In those years, discourses1 about the new category spread through conferences and publications, and the establishment of cleantech as an investment category flew into discursive arenas2, where its identity have been shaped. Cleantech narratives can thus be seen as “central in shaping the material reality of the sector” (Georgeson, Caprotti, & Bailey, 2014).
In fact, in 2002 the concept was introduced to the VC’s community in North America. The two major cleantech groups, Clean Venture Network (CVN) and CE, had the intuition to gather together technical expertise on clean technologies and venture capital. To give a chance to the novel idea to soar, it had to mark the difference between environmental technologies and cleantech ones, being the former just a regulatory driven market and the latter an opportunity for profits. In the subsequent years, several conferences and reports were promoted by CE and CVN to monitor venture capital deals; patterns, topics and standards adopted to measure profitability and progresses tended to imitate already existing VC’s categories.
O’Rourke (2009) argues that from 2002 onwards, cleantech was intentionally constructed and promoted as a new venture capital target category by the CTG and CE: they drew on a nebulous group of technologies and companies, renamed and promoted them by replicating existing VC norms. It was the mimicking of venture capital norms and conventions already existing for biotech and nanotech (names, routines, categories, presentation of data) to confer legitimacy to the new sector and make it larger and established. (Caprotti, 2012, 2016; O’Rourke, 2009)
1 “A discourse is an ensemble of ideas, concepts and categories through which meaning is given to
phenomena” (Hajer, M. A., 1995)
2 A discursive arena “is composed of political institutions, established and emergent markets, informal
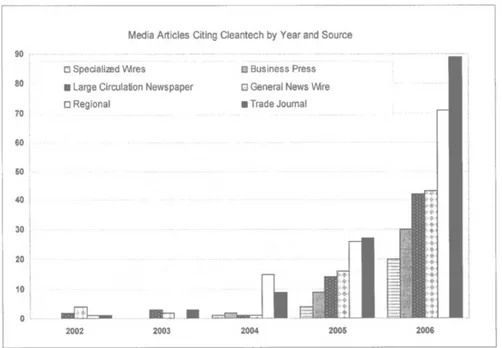
Figure 3 The adoption of ‘cleantech’ term in scientific, business and medicine researches (Caprotti, 2016). In 2005, very notable newspapers started publishing articles concerning cleantech arguments: the New York Time, The Wall Street Journal and The Economist paved the way to become confident to an even wider public. As well as news media, “clean goals” were launched by large and famous companies (e.g.: GE and Walmart).
The great entrance of cleantech into the mainstream media dates back to 2006 (Figure 4) and then continues throughout the following period.
In 2007, the founders of CE, Ron Pernick and Clint Wilder, endeavoured to define the category: “cleantech refers to any product, service, or process that delivers value using limited or zero non-renewable resources and/or creates significantly less waste than conventional offerings” (Pernick R. & Wilder C., 2007). They also introduced the ideas of “cleantech revolution”, as the increased interest in cleantech mated by a rise in capital flows.
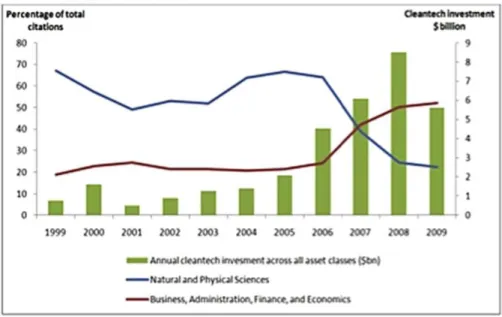
Figure 5 shows the increased term adoption in business disciplines: in 2007 the share of total usage of the term jumped to 42%, then to 50% in 2008, and to 52% in 2009. For what concerns investments, they peaked in 2008: it is worth noting that capital amounts into the new sector and the increasing use of the concept point to the co-constitution of an emergent sector by both capital and discursive mechanisms (Caprotti, 2012). De facto, the rapid development was exhorted by three determinants. First, the augmenting amount of capital spent in sectorial technologies. The amounts of capital invested in cleantech at the VC level increased from $590.1 million in 2000 to a peak of $8.4 billion in 2008 (Caprotti, 2012). Second, the greater number of utilities projects promoted by finance firms and corporations, outlining an enduring interest in cleantech as an established, mature and defined sector. Third, an increasing involvement of established investment firms in the sector remarks the passage of cleantech from a niche investment area to a more widely available targeted one (Caprotti, 2012). In other words, it can be said that the emergence of cleantech is nothing but a progressive increase in financial flows active in the sector, intertwined with discursive strategies.
As Figure 5 illustrates, the recessionary pressure of the global financial crisis was a standstill even for cleantech. Despite this, the novel industry reacted better than most with a fall in investment of just 6.6%, compared to 19% for the oil and gas industry (Caprotti, 2016).
Figure 5 Use of ‘cleantech’ in scientific and business disciplines, compared with capital flows trends, 1990-2009. Source: Caprotti (2016).
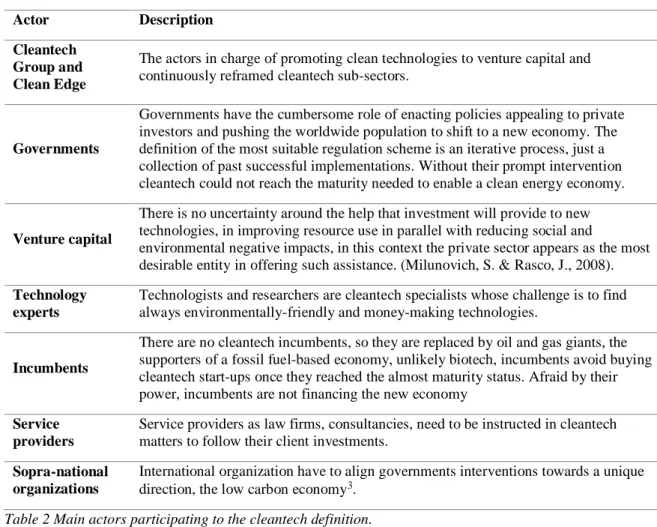
By tracing the major events through which the history of cleantech twisted and turned, it is straightforward the contingency on a dense and extensive network that gleaned a pool of actors from distinct areas. First, the breadth of the definition has involved many actors in shaping definitional boundaries; second, the nature of technologies, not targeting same markets but transversal to a plurality of industries, has engaged technological specialists from several fields to take part into the process. Third, the venture capital community, the promoter of cleantech development. In Table 2, the actors involved in cleantech network are discussed.
Actor Description Cleantech
Group and Clean Edge
The actors in charge of promoting clean technologies to venture capital and continuously reframed cleantech sub-sectors.
Governments
Governments have the cumbersome role of enacting policies appealing to private investors and pushing the worldwide population to shift to a new economy. The definition of the most suitable regulation scheme is an iterative process, just a collection of past successful implementations. Without their prompt intervention cleantech could not reach the maturity needed to enable a clean energy economy.
Venture capital
There is no uncertainty around the help that investment will provide to new technologies, in improving resource use in parallel with reducing social and
environmental negative impacts, in this context the private sector appears as the most desirable entity in offering such assistance. (Milunovich, S. & Rasco, J., 2008).
Technology experts
Technologists and researchers are cleantech specialists whose challenge is to find always environmentally-friendly and money-making technologies.
Incumbents
There are no cleantech incumbents, so they are replaced by oil and gas giants, the supporters of a fossil fuel-based economy, unlikely biotech, incumbents avoid buying cleantech start-ups once they reached the almost maturity status. Afraid by their power, incumbents are not financing the new economy
Service providers
Service providers as law firms, consultancies, need to be instructed in cleantech matters to follow their client investments.
Sopra-national organizations
International organization have to align governments interventions towards a unique direction, the low carbon economy3.
Table 2 Main actors participating to the cleantech definition.
1.2 Forces pushing VC to cleantech
This section reviews which are the most common determinants of VC deals in cleantech according to current academic literature. Public policy is considered a main variable in shaping a favourable environment, given the public good nature of the product. Along with government intervention, other variables are stock-market prices of energy commodities, media coverage, social awareness of sustainability and Hofstede cultural traits.
1.2.1 Public policy
Public intervention is recognized as the most commonly cited cleantech driver, especially policies and regulation designed to enhance firms’ competitiveness. The need for governmental intervention is rooted in the peculiar nature of cleantech business, which makes tailored incentives and regulations a fundamental pre-requisite for the success of the industry (Giudici et al., 2017). At the same time, public policy may play a determining role for VC both in shaping perceptions of prices (through fiscal intervention) and expectations for regulation.
The challenge for governments is to design the best fitting intervention, that should foster activity innovation and entrepreneurship by leveraging the private funding sector (e.g.: venture capital and private equity). “Technology push” and “market pull” are both necessary actions to stimulate technological advancement4. Supply side policies push technology supply, while demand side policies pull the demand of technology. An upstream action entails grants, loans, prized and R&D financial aid for very early stage investments via special programs. A downstream action concerns policies, regulations and tax or VAT reduction mechanisms to prompt demand. A suitable market would include “a stable, long-term, transparent and predictable regulatory environment” (European Commission, 2016). A case study by Klaassen et al. (2005) on public R&D support aimed at reducing cost of innovation for wind energy turbines compares solutions enacted by Denmark, Germany and UK. They point out the fact that doing R&D is a necessary, but not sufficient, condition for the development of cleantech business models.
Between 1979-1989 Denmark resorted to a system of subsidies, that entail a 30% discount on installation costs, to achieve a rapid expansion of wind turbines. Since 1985 it imposed a partial refund for energy and environmental taxes levied on electricity
4 Bloomberg New Energy Finance (2010) provides a wide description of the different supply and demand side
consumption. Parallel with subsidies it started an R&D development program that invested 10% of total energy research in renewables. The R&D scheme was the most successful in stimulating innovative solutions.
On the other side, Germany adopted a paralleled system comprised of feed in law, to regulate the purchase by public energy companies, tax breaks and low interest loans for renewable energy companies (1-2% below the market shares). The feed in law worked as an incentive to use efficient wind turbines in areas with favourable wind conditions. Unfortunately, the first attempt to invest in wind energy failed, so the program was recovered a second time. This time the wind turbines reached a successful result thanks to engineering and shipbuilding knowledge, together with technological Spillovers coming from Denmark. Overall, German and Danish subsidies for promoting capacity were effective solutions in supporting national innovation.
In the early 90s, UK started a two-tier strategy to expand renewable energy use in the country. The strategy consisted of promoting renewable energy through R&D and demonstration projects, and, with electricity sector privatization, guarantee a premium price of kWh for projects receiving the non-fossil fuel obligation (NFFO) subsidy. The NFFO obliged public electricity suppliers and regional companies to buy a certain amount of renewable energy. Even though the English scheme was helpful to drive down prices, it failed in improving the capacity of renewable energy because of the lack of public acceptance and R&D expenditures.
Concerning market pull policies, literature argues that markets can be established also by modelling market properties (Doganova & Karnøe, 2015). The architectures of already existing markets can be transformed and, in the case of cleantech, value metrics extended to include environmental performances. The case of Danish ammonia emissions shed light on regulations’ pivotal role in setting up a market space. From the Integrated Pollution Prevention and Control directive (IPPC) a new market arose in Denmark, with the aim to create demand for pollution-reducing solutions and encourage local farmers to invest
in the “best available techniques5”. In the stricter ammonia emissions regulations, CleanFarm6 entrepreneurs envisaged a market opportunity. By mobilizing Danish policy makers, to ensure the application of stricter measures, and scientists, to show the indisputable evidences of reduced ammonias emissions produced by its products, CleanFarm aimed at being installed in the ten biggest pig farmers in Denmark, to let farmers see the possibility to expand their pig breeding without harming the environment.
We review several papers that agree on the need for public intervention in cleantech investments on the light of empirical results. Menon and Criscuolo (2015) look at 29 countries (almost half of the deals concern US-based companies, UK and Canada following) in the period 2005-2010 and study the effect of different type of public policies on the number of VC deals in cleantech sector. They classify policies in supply and demand side ones, as we mentioned before, but also, according to timeframes, in long and short-term ones. In the analysis they consider regulation price policies (Feed-in tariffs), regulation quantity policies (renewable portfolio standards, tradable renewable certificates, public competitive bidding), sales tax reductions and fiscal incentives.In general, the results of the analysis show that long-term policies such as renewable portfolio standards and Feed-in Tariffs are preferred to short term-oriented policies as fiscal incentives. Fixing the price for energy and obliging to make up the portfolio of utilities with shares of renewable energy are perceived as stable policies. FITs are considered one among best solutions in other results as well. A study by the European Commission (2005) concludes that the most effective systems in wind energy are in Germany, Spain and Denmark with FITs systems. On the contrary, fiscal incentives, especially when renewed every short lapse of time, suggest instability and may deter investments. Finally, very generous incentives, for instance for FITs, are perceived in a negative way, raising concerns about sustainability.
5 defined as “as techniques that ensure the highest level of environmental protection without entailing
excessive cost” (Doganova & Karnøe, 2015).
6 fictitious name for a new venture commercializing innovative technology that reduces ammonia emissions
Nonetheless, evidence is mixed about the degree of appreciation of actors. For instance, Bürer & Wüstenhagen (2009) surveyed 60 European and North American VC and private equity professionals to understand which are (or at least perceived) the best policies to attract private investors in backing cleantech firms. Their results concerning technology push policies show that investors dislike government VC and programs of mentoring for entrepreneurs. “Government should not pick winners” is a sentence that perfectly evocates the bad feeling for intrusive public actors in market dynamics. Positive feedbacks were for government grants for demonstration plans (is considered to help through the technology Valley of Death along the innovation chain) as well as public R&D and grants for SMEs and communities (we show later that communities are a new dimension to consider when talking about the environmental transformation). Concerning market pull policies, FITs were considered the best, followed by the Technology Performance Standards and the reduction of subsidies for fossil fuel.
Many investors believe that a mix of technology push and demand-pull policies is necessary. But, when analysing surveys, it is important to highlight the danger in drawing conclusions on the light of the results quickly. Some factors account for a biased outcome of survey and were conditioning responses of investors (Bürer & Wüstenhagen (2009)). These are the clean energy exposure (more preference for FIT the more the investment level in cleantech), fund type, geographical provenience (in Germany, Spain and other countries that have an already running and developed public policy pattern the sensitiveness and the awareness of some incentives are surely different from other inexperienced countries) and stage of technology development. We add also that, given the broad spectre of cleantech technologies, the differences may be not just vertical (along stages of innovation chain) but also horizontal (a wind turbine is far different from a software for power usage optimization). The low appreciation level emerging for some policies (e.g. Wustenhagen and Teppo, 2006, quote a response from a VC telling that government would have better stay out of business) should warn for perils: targeting a segment with the wrong policy may be, not just useless and a waste of money, but also harmful, as it may also crowd out potential investments.
The shared conclusions of the papers are that public institution should intervene to tackle the externalities in cleantech sector, but how to do it and what are the best solutions have still to be defined. Moreover, along with cultural entrepreneurial disposition and appealing policy scheme boosting interactions, facilitating market and resource access and yielding capital (e.g. taxation discount, housing subsidies), a forceful legal institution that ensure intellectual property protection for innovative solutions is considered a driver to mobilize cleantech firms to relocate in low carbon cities (Kapsalyamova, Mezher, Al Hosany, & Tsai, 2014).
Another questionable thing about public policy and innovation, is to what extent foreign public policy affects domestic innovation effort. In other words, what are the boundaries of impact of a policy promoted by a country? One early signal in this direction is an eye-catching result of a report published by the World Intellectual Property Organization, according to which 44% of applications for patents filed in 2008 were filed by non-residents. Foreign market context does have an impact on innovators. Other studies have tried to explain dependence between strict foreign environmental regulation and domestic innovation. Moreover, results were conflicting. Lanjouw & Mody (1996) find positive correlation between regulation in US and innovation in Japan and Germany, while Pop (2006) does not find correlation between domestic innovation and foreign environmental regulation. Also, what are the feelings of entrepreneurs toward such issue? Was the policy supposed to benefit foreign competitors as well, domestic investors may dislike the increase of competition. Dechezleprêtre et al. (2013) answer this question looking at the wind industry. Their study focuses on patenting data in the period 1994-2005 for OECD countries. The question research, precisely, is how much public policies, both technology push and demand pull, affect innovation effort at home and abroad. The number of patents filed is a proxy for innovation effort of investors, while the annually added capacity of wind power is a proxy for the effort of public intervention. The approach resembles the PACE (Pollution Abatement and Control Expenditure) method, according to which the level of expenditures in devices to cut pollution should reflect policy effort. The authors argue that, given that the cost of generating power with traditional polluting sources is far lower (Bloomberg New Energy Finance, 2010, does the comparison between several
sources across time) than the one related to the production of electricity from wind power, the magnitude of added capacity should reflect the magnitude of public policies. The policies considered of demand-pull nature are FITs and renewable portfolio standards, while public support to R&D represents technology push policies.
Concerning patents, other studies have used them as a proxy for innovation effort. OECD (2009) provides an overview of upsides (availability of data and information on technology type) and downsides (there are other options to protect innovation) of this proxy. Besides, in OECD countries the enforcement of intellectual property rights should be strong, and this makes the analysis quite reliable. To give an idea of magnitudes, in 1994 360MW capacity were installed, while 9,700MW in 2005. The number of inventions grew accordingly. Public R&D in wind power grew by 70% between 1994 and 2005 (from USD108m to USD182m). The results infer that public policy does have an impact both on domestic innovation and foreign one. The marginal effect of installations at home is 28 times more effective than marginal effect of foreign installations. Demand pull polices look more effective, while public support to R&D does not have effect on foreign investors. The conclusions suggest there are barriers to technology diffusion across countries and that understanding and managing these barriers can help in the environmental transformation. Thus, public policy, both domestic and foreign, is acknowledged as a determinant in cleantech VC deals.
Before going on, we want also to make a point on how much pervasive public policy and regulation have been so far in cleantech. Regulatory risk management has become a business process within the firms of the sector. Bürer & Wüstenhagen (2009) surveyed a sample of investors to draw a framework that depicts the strategies developed to tackle and manage dynamically regulation risks. They show that managers opt for managing risk either/both in an active (inbound and outbound) or/and in a passive way (at firm level). Active approach means hiring experts with inherent competence (inbound) or influencing the policy makers (outbound). Passive approach is about diversifying across technologies and countries both at the firm and at the fund level. The conclusion is that rather than just market and technology risks, literature should focus also on the regulatory risk, to get a deeper understanding of the scenario.
1.2.2 Other economic, social and cultural forces Energy price & stock returns
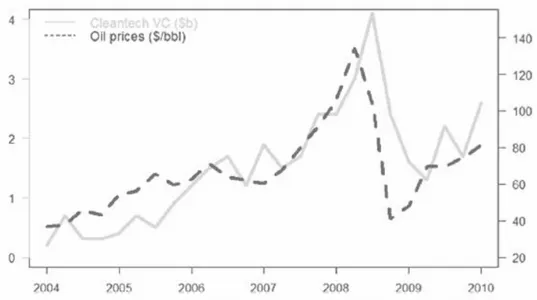
Stock market and commodity prices may be drivers for the investments in cleantech. Colombo et al. (2016) carry out an analysis of VC deals in cleantech in 31 countries for the period 1996-2010, trying to single out the determinants. A hypothesis validated by the analysis is that oil price and cleantech deals have a U-shaped correlation. Increasing oil price poses an incentive to invest in alternative sources of power. A particularly steep increase would otherwise make energy companies focus in their core business rather than in alternative (potentially cannibalizing) business models. The cleantech companies involved are the ones from energy production sector (as mentioned in the introduction, almost 70% of the whole cleantech, PWC, 2015). The picture (Figure 6) shows graphically the correlation between oil prices and cleantech VC deals for the period 2004-2010.
Figure 6 Correlation between oil price and cleantech investments. Source: Bloomberg, New Energy Finance (2012).
A complementary picture is provided by Kumar et al. (2012). They investigate the relationship between oil and carbon prices and alternative energy stock price. Had the oil price an effect on the stock price of clean energy firms (their result shows indeed that increasing in oil price and triggers a switching toward alternative energy, while there is no
correlation between carbon stock price and clean energy firms stock price), it would be reasonable to make a connection between VC deals and stock prices of clean energy firms.
Media coverage & cultural dimensions
Colombo et al. (2016) validate also the hypothesis that media coverage has a positive correlation with VC cleantech deals. Doing advertising and informing stakeholders and potential shareholders about benefits (but also to make the product fashion) help in building image and reputation of the sector. This dimension deals with basic marketing theories on any product and can be classified as a communication phase. From a cultural point of view, referring to the Hofstede model, uncertainty avoidance is negatively correlated with the number of deals. Clearly, it fits with the high risk associated to the technology and the inability to have a clean vision on future. Concerning public institution, a stronger rule of law is positively correlated with the number of deals. As mentioned before, the environmental regulation, to be effective, should be credible and sustainable in the medium-long term. Government may also play a role committing itself in the market, that is promoting private and public partnership.
Another attempt to understand which variables affect cleantech investments decisions is done by Masini & Menichetti (2012). For the field of behavioural finance, they draw a pattern of decision making of investors. They call for the necessity of addressing carefully the need of such investors. Because there is no lack of capital, but rather lack of understanding what are the appropriate policy packages to attract capital (Usher, 2008). This study belongs to the same front of Mazzuccato and Semeniuk (2016) work, in the scope of customizing policies to customers (investors), but with a different (and deeper) approach. The authors declare their awareness of the fact that in economics decision making does not always maximize utility in a rational way, because cognitive and irrational factors intervene. Leveraging smartly these soft variables can be a tool to promote investments that are considered too risky by rational decision-makers. Also Wüstenhagen et al. (2007) point out the increasing importance, to understand the effectiveness of public policy, of factors that influence socio-political and community acceptance. The analysis is carried out surveying a sample of European investors, made of private equity and VC, commercial banks and corporations. These investors had a portion of cleantech investments in their portfolio. The
framework developed assumes that the decision to invest in renewable energy depends upon three categories of behavioural factors: a priori beliefs (that are the result of personal previous experiences and background of the investor), a preference for some policies (depending on perceived stability and credibility) and the attitude to technological risk. Then, the share of renewable energy in the portfolio is supposed to improve the performance of the portfolio. An interesting point is that the business context resulted highly informed and rational in the decision making. A direct consequent is the preference on average for mature and less risky technologies. The proven reliability of a technology is far more influent than the design of public policies. It stands out also that the sample surveyed prefer short term-oriented incentives. This result conflicts with previous mentioned studies. Finally, a higher share of RE in the portfolio is associated with higher investment performance, and this may suggest a virtuous cycle after having entered the sector as a shareholder.
1.3 VC funding in cleantech
This section reviews in general the reasons that make VC, to some extent, still an underdeveloped mechanism of finance. Then, it digs deeper in describing the tricky aspects of VC financing in cleantech: the cash valley of death, the managerial valley of death, the uncertain exit mechanisms, along with the commodity nature of energy, are the recurrent problems in literature.
1.3.1 Inefficiencies in the market for VC capital
There are challenges to address that are VC-specific at a general level. The U.S. Small Business Administration (2012) find that 50% of the entrepreneurial IPOs in recent years are venture-backed despite only 0,2% of all firms receives venture funding. VC proved effective, but it still plays a marginal role at the aggregate level. If we envisage cash flowing through the chain made of investors backing VC (pension funds, insurance companies,
endowments and wealthy private investors are typical sources of venture capital, e.g. Limited Partners), VC and companies (that get capital from VC), we can single out several issues at the interfaces and bridges to mend.
One problem, stemming from corporate decisions, generally driven by cost and risks assessments, is the sceptical approach that business organizations have toward external sources of finance. The Pecking Order Theory discusses the firm’s demand for and use of finance (Myers & Majluf, 1984). The theory states that firms prefer to use internal sources first and then to fall into debt. Only if necessary, as a last resort, they consider equity-based finance. Looking at the UK landscape, Revest & Sapio (2012) comment that in UK, VC is hardly accessible to technology based small firms. According to Mason & Harrison (2004) most young ventures in the UK are not ready for investment. They lack solid plans. Nightingale et al. (2009) say that in UK entrepreneurs and VC find difficult to find each other. This is impressive if we think that UK is the country in Europe where VC is most developed.
Another known deadlock, when looking at VC, is the lack of information for stakeholders. Being private entities, they are not prone to doing disclosure. Kaplan & Lerner (2016) highlight also which are the challenges for VC given the lack of information about performances and quote databases and platforms to get data. They also conclude that VC is getting interest from policymakers and investors, but that the lack of data may be a problem.
The sub optimal exploitation of VC can have a double opportunity cost, because there is also a positive indirect effect of venture capital over innovation. Wüstenhagen et al. (2007) point out their importance in the commercialization of innovation, given the ability of VC to influence the expectation dynamics of other, less than fully rational investors. Messica (2008) tells that gut feeling plays a crucial role in the selection of the investments. Thus, VC is both a direct leverage to foster innovation and an indirect one in shaping a favourable environment by triggering additional investments.