This is an author version of the contribution published on
:
Forthcoming on the Journal of Social and Economic Geography (Tijdschrift voor economische en sociale
geografie)
The definitive version is available at:
La versione definitiva è disponibile alla URL:
IPRs and international knowledge flows:
Evidence from six large emerging
countries
Fabio Montobbio
⊗⊕, Annalisa Primi
∅, Valerio Sterzi
∮⊗
Dept. of Economics and Statistics " Cognetti de Martiis", University of Turin, Lungodora
Siena 100A, 10153 Torino, Italy – Italy. Ph: +390116704406; Fax: +390116703895. E-mail:
[email protected]
.
∅
OECD, Structural Analysis and Competitiveness Unit, OECD Development Centre
(Theopinions expressed in this paper are those of the author and do not necessarily reflect those of the Organization)
∮
GREThA - UMR CNRS 5113, University of Bordeaux, Avenue Léon Duguit, PESSAC
CEDEX 33608, France. E-mail:
[email protected]
⊕
CRIOS, Università Bocconi, Milan
ABSTRACT
This paper studies international knowledge flows looking at (1) patent citations that track codified knowledge and (2) technological collaborations between inventors that gauge knowledge transmitted through face to face contacts. It uses a gravity model for 13 countries (Brazil, Russian Federation, India, China, South Africa and Mexico and USA, UK, Japan, Italy, Germany, France and Canada) using EPO data. In the case of tacit knowledge flows it shows that IPRs reinforcement has no effect and that sharing a common legal origin and technological proximity are more important than geographical distance. In the case of codified knowledge flows IPRs reinforcement has a positive effect only when applicants’ citations are considered.
Jel Codes: O30, O10, O11
Keywords: Intellectual Property Rights, Knowledge flows, Emerging countries, Patent Citations, Inventors
Collaborations
Acknowledgments: We would like to thank Gianluca Tarasconi and Gemma Collotta for helpful research
1. Introduction
International research collaborations and joint international patenting have been rising globally. These trends multiply the opportunities for international knowledge flows through augmented possibilities of interaction between individuals and organizations. How those opportunities are translated into practice, and who is capturing the benefits depend, at the country level, on different factors, such as the accumulated capacities of the different agents, the prevailing specialization pattern, and also on the institutional management of innovation policy and intellectual property. As innovation goes global, there is a rising demand for global knowledge governance. Intellectual property (IP) protection is, probably, the domain in which policies have pioneered the extension of homogeneous standards across countries.
Different legal legislations, differences in patent exceptions, patent subject matters and enforcement conditions, just to name a few, are considered to drive firms decisions on the location of R&D facilities in given countries, to influence the willingness to undertake collaborative research projects and to search for joint patent protection. However, the prevailing legal framework is only one of the reasons that affect the decisions to collaborate for innovation with foreign partners. Usually, collaboration with foreign partners is manly determined by the need to access the capabilities (research or/and market based) and the knowledge (tacit or codified) embedded in the foreign partner. When the key motivation beyond collaboration is the uniqueness of the knowledge of the foreign counterpart and its value for the research or the business strategy of the partner, than asymmetries in IP regimes will tend to play a second order effect in agents’ choices of collaborations.
International collaborations in research and in inventive activity are extremely valuable for the transfer of tacit knowledge, routines and experience which derives from face-to-face interaction and from the development of common shared practices ensuing from research collaboration. International knowledge flows are unanimously seen as positive and necessary elements for supporting catching up and collaboration in research is one of the channels through which information, knowledge and to some extent know-how flow between partners. Usually, joint research projects involve not only the exchange of technical information, but also the voluntary and involuntary transmission of know-how, procedures and routines, issues which make those collaborations, and the associated learning processes, of extreme relevance for catching up countries which are in the process of strengthening their capabilities.
Knowledge transmission from more advanced countries supports the catching up with the technological frontier; on the contrary, technological isolation slows down the development process and it is conducive to technological and economic divergence. The possibility of significant spillovers in the
process of international knowledge diffusion has stimulated interest in technology transfer and has raised inevitably issues of intellectual property rights (IPRs) protection. However, developing countries encounter difficulties to “catch up” despite (and in some cases as a consequence of) the introduction of homogeneous and stronger IP regimes.
Know-how, routines and organizational capabilities, are to a great extent tacit in nature (Dosi, 1988); tacit knowledge is costly to transfer, and its transferability is limited by its embeddedness in individuals, teams and organizations. In this context particular attention is placed on the absorptive capacity, learning processes and the ability of the recipient country to evaluate and effectively use the transferred knowledge and technology. This is why research on knowledge diffusion through inter-personal links across countries has recently come to the fore. International collaboration for developing countries plays a key role in accessing knowledge and good technology practices from abroad, and in speeding up the learning process. Some evidence indicates that not only international collaboration between inventors is growing but also that international co-operation has a positive a significant effect on domestic innovative activity. In addition, developing countries seem to benefit significantly when domestic inventors collaborate with foreign inventors in developed countries (Montobbio and Sterzi, 2011).
TRIPS represent the biggest change in global IP regimes at the international level of the last two decades (Basheer, 2005; Cimoli et al. 2009). TRIPS require that WTO member nations enact and enforce laws on copyrights, trademarks and patents to protect intellectual property. Besides the special and differential treatment (SDT) provisions which confer specific rights to LDC (Least Developed Countries) and a series of flexibilities, the Agreement put the reform and strengthening of IP in the innovation policy agenda of developing and emerging economies.
The basic rationale for the international harmonization and reinforcement of IPRs is based on three arguments. (1) Stronger IPRs would support technology transfer by reducing the risks to establish multinational corporations operations in developing countries (2) would create more incentives to sell goods in these markets, (3) would enhance international knowledge transfer through the development of markets for technologies. Arguments against the reinforcement of IPRs emphasize the possibility of important welfare losses due to market power pricing, the costs of closing down infringing activities, higher imitation costs and other risks related to patenting indigenous knowledge, enforcement problems and the adverse impact on the trajectory of technological learning and catching up, as well as the mismatch between IP policies, innovation policy and industrial policy (Cimoli and Primi, 2008; Cimoli et al., 2009).
After the introduction of TRIPS, many scholars and policy analysts studied and assessed the impact of the agreement on developing countries. Various papers offered different measures of the effect of the 2
TRIPS on trade, FDIs and innovation, as well as access to drugs. Generally, this literature suggests that the extension of patent protections under TRIPS has nuanced effects that varied by product category, country, and development level1.
However, while it is increasingly recognized that international flows of technological knowledge and collaboration in innovation affect importantly countries’ ability to learn and innovate, few studies address the impact of IPRs on international knowledge flows (for a discussion see Montobbio and Sterzi, 2013). This paper goes in this direction. It examines whether the changes of IP regimes across countries, introduced in part by the implantation of the TRIPs agreements, has supported international knowledge flows and international collaboration in research, as it was supposed to do in theory. This paper measures knowledge flows by patent citations (which track the origin and direction of codified knowledge flows) and co-inventorship (as a proxy of technological collaboration that gauge knowledge that is transmitted through interpersonal and face to face contacts). The study is based on the international patent databases from the European Patent Office (EPO) and it covers 13 countries: the G7 (USA, UK, Japan, Italy, Germany, France and Canada) and a group of emerging economies, the BRICSM (Brazil, Russia, India, China, South Africa and Mexico). It uses a modified version of a gravity equation to model bilateral technological cooperation and bilateral knowledge flows to test the impact of the strengthening of IPRs.
Section 2 explains the two indicators used to measure knowledge flows. Section 3 explores the available empirical evidence on the impact of TRIPS on knowledge flows. Section 4 presents the data and the empirical model and, finally, Section 5 discusses the results of the econometric exercise. Section 6 concludes.
2 Measuring International Knowledge Flows: Patent Citations and Co-inventorship.
The economic literature has emphasized two ways of empirically tracking knowledge flows: patent citations and co-inventorship. This paper, in line with the literature, estimates the impact of IPRs reinforcement on both types of knowledge flows, which account for different types of knowledge flows and interactions between agents. Patent citations measure the transfer of codified and published knowledge. Collaboration via co-inventorship, i.e. the number of patents co-signed by inventors living in different countries, is a proxy of knowledge flows generated by interpersonal and social links deriving from joint collaborations. Patent citations measure flows of knowledge acquired by direct reading and comprehension
1 For example, McCalman; (2001), Kanwar and Evenson (2003); Allred and Park (2007); Qian (2007); Coriat et al (2006); Kyle
and McGahan (2009); Delgado et al. (2011).
3
of written and available documents2, while co-inventorship can be used to track the transfer of non-codified
knowledge (e.g. technical know-how, non-standardized production procedures etc.), which requires, at least periodically, face-to-face interactions.
In this paper we use patent citations at the EPO. At the EPO, patent citations are included in the patent document mainly by the patent examiners in their examination report, delimit the scope of the property right and point to the prior art that can possibly invalidate the patent (see section 4 for the methodological discussion). Citations have a legal value and they are considered a particularly reliable indicator. If, for example, a patent signed by a Brazilian inventor cites a patent signed by a Canadian inventor, it can be assumed that some knowledge created in Canada is used in Brazil and, as a result, patent citations could track the direction of knowledge spillovers among the two inventors and the two countries. Knowledge flows via direct collaboration in research and face to face contacts are also important for innovation activities. The recognition of the relevance of personal interaction for knowledge transfer led the literature to measure knowledge flows through co-inventorship. Actually, knowledge and know-how embodied in individuals and firms circulates mainly through informal and non-codified face-to-face interactions and it involves different spheres, such as mobility of workers and researchers, participation to executive boards, effective participation in joint research programs etc. Co-inventorship can be used as a proxy of direct interaction, and hence transfer of experience, routines and knowledge between co-inventors. Recently the literature shows that co-inventorship captures knowledge transfer between regions and countries (Breschi and Lissoni, 2009; Montobbio and Sterzi, 2013; Singh, 2005).
3 Does Patent Strength Facilitate International Knowledge Flows?
This paper studies the determinants of these two different types of knowledge flows using a gravity model. In particular we ask whether strengthening IPRs increases knowledge flows between advanced and emerging economies. We consider bilateral knowledge flows between G7 and BRICSM countries and assume
that they depend upon some joint characteristics of the two countries. Following the literature it studies whether variables such as the economic size and innovative activities of the two countries, their geographical distance, the presence of common cultural roots, the level of foreign direct investment and bilateral trade, have an impact on knowledge flows. However, in particular it tests whether the reinforcement of IP protection affects knowledge flows via patent citations and via co-inventorship.
2 There is a long tradition of studies that use patent citations to measure the value of the inventions and to map knowledge
spillovers (e.g. Griliches, 1990, Trajtenberg 1990; Hu and Jaffe, 2003).
4
Standard economic analysis suggests that stronger IPRs increase the incentives of foreign companies to invest in knowledge related activities and also create more incentives to innovate for domestic companies. Moreover the (indirect) link between IPRs and knowledge flows passes through the level and composition of innovative activities. The general intuition is that an exogenous change in IP legislation in developing countries could raise the innovativeness of domestic companies and increase their economic openness, via FDIs, imports and joint ventures. Generally the strength of IPRs in a developing country should reassure companies willing to invest and develop technologies in these countries and, indirectly, be conducive to increased level of domestic technological activity and technological collaborations. Moreover new harmonized legislation and stricter enforcement generate greater incentives to disclose technological knowledge. Likewise, as long as stronger IPRs stimulate trade, FDI and international joint ventures this may improve both the probability of direct international collaborations between inventors and the probability of international patent citations (Park and Lippoldt, 2008).
However it has also been suggested that increased patent protection could harm innovative activities in developing countries. Part of the explanation comes from the discussion on the possible different strategies that multinational companies may adopt. As long as multinationals (MNCs) use patents to prevent the use or import of a specific technology this could harm domestic production and innovation. Moreover with stronger IPRs and stricter enforcement we can expect less international knowledge flows through imitation and adoption and the closing down infringing activities. In addition, worries have also been expressed that stronger IPRs generate higher cost of access to imported technologies and difficulties in accessing basic scientific knowledge (McCalman, 2001; Grossman and Lai, 2004).
If stronger IPRs end up hindering the research activity of developing countries in particular (maybe high-tech) sectors and changing the structure and composition of their innovative activities we can expect a decline in the use of foreign technology in some fields and less international technological collaboration. Moreover strong domestic IPRs makes the local market more contendible and this may have an adverse effect on the domestic market structure, through mergers or acquisitions, and hence lead to a greater market concentration (Lesser, 1998), ultimately leading to the erosion of the local technical base.
Take now separately into account the effects on IPRs reinforcement on the two types of knowledge flows we consider in this paper. With respect to patent citations, we expect a positive impact of IP reinforcement on patent citations as long as this increases the use of foreign technology in the domestic
technological activity of the developing countries. IP reinforcements may increase directly the use of
technology facilitating the construction of domestic technological capabilities not only through higher incentives for domestic firms to perform R&D but also through technology markets, licenses, technology
outsourcing and contracts, enhancing also the overall capacity to absorb foreign knowledge. In parallel, there is an indirect effect through for example FDI and imports. At the same time stronger patent
protection may hinder the use of foreign technology in particular for the potentially infringing innovative activities. In this case we should observe a decrease in patent citations. Moreover potential limitations on the free use of foreign technology could lead to abandon innovative activities that eventually could have turned into an international patent application.
With respect to international patent collaborations, in principle IPRs should reduce the costs of contracting because they generate a clearer definition of the technologies and higher certainty about the enforceability of contracts. As a result of a reinforcement of IPRs, we should therefore observe more trade, FDIs and more R&D collaborations between developed and developing and emerging countries.
We note also that - when it comes to international technological collaboration - different channels of technology transfer may be used. Companies and research laboratories in order to make profits out of their discoveries may pursuit different innovative and collaborative strategies. These different innovative strategies keep into account not only the strength of IP but also a lot of other variables like market size, the degree of appropriability, the intensity of the competition, the type of knowledge base, power relationships and the degree of asymmetry in the technological capabilities. Some evidence shows that substantial technological collaboration takes place also when strong IPRs are not enforced (e.g. Lanjouw and Cockburn, 2001). In this context it is not obvious how an IP reform that generate stronger patents and greater enforceability in developing countries could affect international technological collaboration.
In particular, by making the local market more appealing and by increasing litigation and transaction costs, stronger IPRs may decrease the incentives to undertake technological collaboration.
Let’s assume for example that there are two countries (North and South). The North has stronger IPRs than the South. Assume also that there are two companies (A) and (B) with different level of technological capabilities. Company A is technologically more sophisticated and operates in the North and company B operates in the South. Company A could not want to share its tacit knowledge with a potential competitor: strengthening of IP makes the local market appealing and potentially profitable. Stronger IPRs and the creation of a market for technology may increase the incentive to license and decrease the incentives to undertake technological cooperation. With a weak patent legislation company A could find more profitable the cooperative solution (possibly with a fee or an access price), conversely with a strong patent legislation company A can always force company B to buy a license on its technology.
Moreover, Company A could not want to cooperate with company B simply because it does not want to spend time and resources to negotiate complex licensing agreement. Company A may wish to access 6
directly the market in the South that thank to IP reform is now more profitable. In many cases to cooperate technologically with a local company can provide increased appropriability because the local company can have important complementary assets, in particular the ability to adapt products to local needs and distribute them. Patent reform may change the appropriabilty strategy of foreign companies that can use stronger IP and stricter enforceability (instead of technological cooperation) to make profits out of their new products and processes.
4. Data and Methodology
Our patent data come from the EP‐KITES data set, which contains complete information on all patent applications to the European Patent Office (EPO). In particular we use all patent applications from 13 countries from 1990 to 20043. We consider six developing countries: Brazil, Russian Federation, India,
China, South Africa and Mexico (BRICSM) and 7 advanced countries (G7): Canada, France, Germany, Italy, Japan, UK and US4. Patents are assigned to countries using the addresses of the inventors and, in
particular, are assigned to a specific country i if there is at least one inventor resident in country i.
The inventors’ address is a more precise information than the applicant address because there are much more international collaborations if we look at international teams of inventors (with respects to patents that are co-applied by institutions in different countries) and secondly it is at the individual level that the real knowledge exchange takes place5.
We observe an international technological collaboration between country A (emerging) and country B
(advanced) when a patent is co-signed by at least one inventor resident in country A and at least one inventor resident in country B6. A possible noise in the data can be generated by individual inventors that
work abroad but keep on declaring the address of the home country (e.g. Montobbio and Sterzi, 2013 for a discussion). Although this is always a case of international knowledge flows7, we control for this by
excluding those patents where the number of domestic inventors is less than 20% of the total number of inventors in the team. For example if we observe a patent with 6 US inventors and one Brazilian inventor
3 In case of Russian Federation the panel goes from 1995 to 2004 due to missing information on IPR index till 1995 (Park,
2008).
4 The sample for the BRICSM countries is composed by 15035 patent applications, which have been signed by 30090 inventors. 5 Montobbio and Sterzi (2013) elaborates on this point.
6 If a patents is signed by three inventors from three different countries in our sample, we consider all three bilateral relations. 7 The individual inventor abroad could be seen as a form of knowledge brokerage between the technological network in the
advanced and emerging country.
7
we could argue that this is not an international collaboration between Brazil and the US but rather that there is a Brazilian inventor working in a US institution.
The second dependent variable is the number of bilateral patent citations. We consider the yearly
number of bilateral backward citations in patents signed by at least one inventor resident in the BRICSM to one of the G7 country. Moreover, since the EPO indicates the origin of each patent citation8, we can verify
whether the citation was added by the applicant/inventor or by the examiner. We consider two measures of patent citations: (1) the number of citations added by both the patent applicant/inventor and the examiner, and (2) the number of citations added only by the patent applicant/inventor. The latter can be considered to be closer to the idea of knowledge flows to the extent that it consider only prior knowledge directly introduced by the applicant/inventor9. Differently from the USPTO, where the "duty of candor"
rule imposes the disclosure of all prior art, at the EPO the majority of citations are introduced during the search by the patent examiner. For Brazilian and Indian patents in the sample the citations added by the applicant/inventor are around the half of those added by the examiner; one third for Chinese, Mexican, Russian and South African patents.
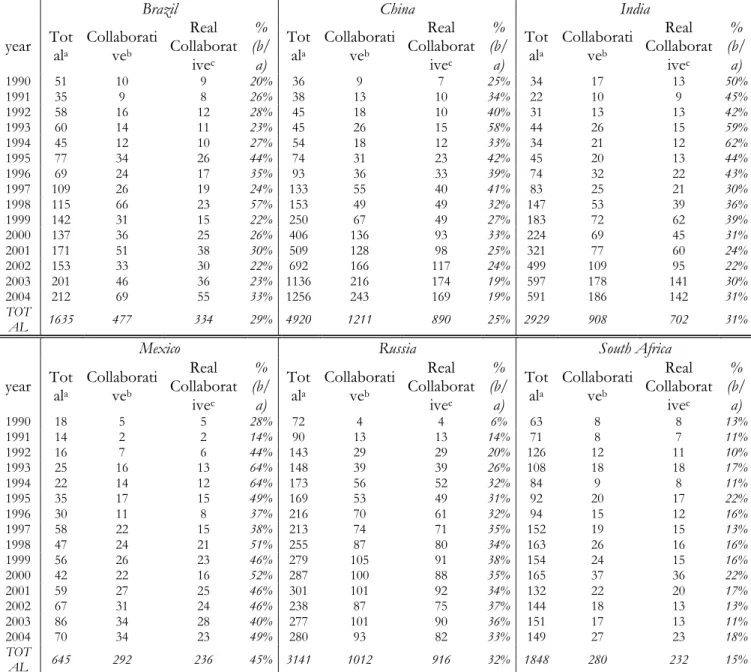
4.1 International knowledge flows in the BRICSM. A descriptive analysis
For each emerging country, Table 1 shows in each emerging country the total number of patents per year, the number of patents with at least a foreign inventor who resides in one of the G7 countries, and among the collaborative patents those with at least 20% of inventors residing in the emerging country. It shows that BRICSM countries have a substantial share of international patents which are co-invented with the G7 countries, especially if compared to G7 case.
While on average for the BRICSM the share of international collaborations range between 15% and 60% (higher for Mexico and smaller for South Africa) for the G7 countries the same share ranges between 0.2% and 4% (higher for Canada and smaller for Japan) 10. It is also important that this share is increasing
in all the 7 advanced countries while no clear patterns emerge from the BRICSM. The share of international collaborative patents seems to decline in China and India indicating a growing importance of
8 There are eight different origin types: citations introduced during search, citations introduced by the applicant, citations
introduced during examination, citations introduced during opposition, citations introduced according to Art 115 EPC, citations from the International Search Report, citations from the Supplementary Search Report, citations introduced during the Chapter 2 phase of the PCT. Recent literature suggests that examiners’ citations display different properties (for EPO data see Criscuolo and Verspagen, 2008).
9 We also acknowledge that it is however possible that the patent applicant/inventor cites prior art by searching after completing
the invention and only during the application: in this case we do not observe a knowledge flow (Thompson, 2006).
10 Detailed statistics for G7 countries are available upon request by the authors.
8
domestic technological activity in these two countries. At the same time it displays a positive trend in Brazil, Mexico and Russia with a peak in the mid-nineties and then either the trend remains flat or declines. Table 2 shows the number of patents with only national inventors, with at least an inventor from other BRICSM countries, the US, the EU (four countries) and Japan. If we consider two sub-periods, before and after 1996, it shows that the share of patents that have at least one inventor from the US tends to decrease for China, India and Mexico. The share of collaborative patents with the EU4 tends to decrease for all countries with the exception of Mexico and Russia.
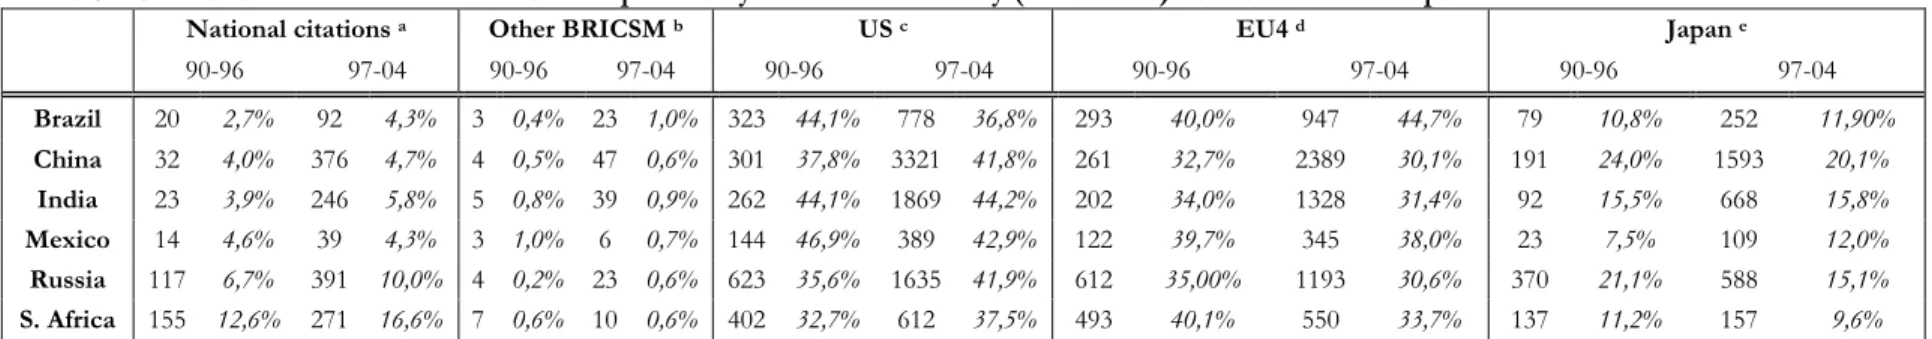
For what concerns the EPO backward citations, Table 3 shows that only a minority of them remain within the national borders, indicating still a lack of in-house technological capabilities. This is especially true for Mexico and China where only 2.7% and 3.1% are citations to domestic patents in 2004. Interestingly, data do not show any significant increase of domestic citations over the years considered. Table 3 displays the number of backward citations by destination country (and shares) before and after 1996. No major structural change occurs in the period observed. There is a slight increase in citations that stay within the same country, but the share of these citations remain very low with the exception of South Africa in recent years. Table 3 also shows that geographical distance may play a role since China, India and Russian Federation cite more frequently Japanese patents than Latin American countries ones. Interestingly, Mexico is closer to the United States, while Brazil more to the Europe: in the period 97-2003
40% of the citations of Mexican patents go to the US and 32% go to EU4 patents; while for Brazil we have a reversed picture with 39% of citations to the EU4 and 30% of their citations to US patents.
4.2 The Econometric model
We estimate the impact of IPRs reinforcement on the international technological collaborations and on patent citations using a gravity model (Picci, 2010; Montobbio and Sterzi, 2013). Gravity models have been widely used in explaining trade flows. Disdier and Head (2008) show that the negative impact of distance on trade flows began to rise after the 1950s and remains high. Taking into account in their meta-analysis of approximately 1400 distance effects estimated in 103 different econometric papers, they show that the mean bilateral trade flow elasticity to distance is equal to 0.9 and challenge significantly the idea that with globalization distance is becoming less relevant.
Peri (2005) analyses knowledge flows across region in a gravity framework using patent citations. He finds that knowledge flows go much farther than trade flow even if knowledge flows remain highly localized. Guellec and van Pottelsberghe de la Potterie (2001) study technological internationalization of the OECD countries and show that small and low tech countries are more open. They also find that 9
technological collaboration depends upon technological proximity and the presence of both a common language and a common border. Finally, Picci (2010) studies international collaboration using co-inventors and co-applicants of a set of patent applications at the European national patent offices and at the EPO and investigates the increased level of technological collaborations of the European countries. He finds that distance, common language and common borders explain a substantial part of the variation in bilateral collaborations.
This paper estimates the impact of IPRs reinforcement on different types of knowledge flows following a standard empirical implementation (e.g. Disdier and Head, 2008) represented in the following equation:
E[xijt]= AαitAβjtDθijexp(λORIGij+ δTijt) IMPijtν1 FDIitν2IPRγiteτt (1)
xijt is equal to (1) the number of collaborations, where the number of domestic inventor is at least
20% of the total number of inventors, between developing country i and developed country j at time t or,
alternatively, (2) the yearly number of bilateral backward citations in patents signed by at least an inventor resident in developing country i and citing a developed country j at time t.
The main variable under scrutiny is the general strength of the domestic intellectual system (IPRit).
This variable is the Ginarte and Park index (Ginarte and Park, 1997; Park and Wagh, 2002; Park, 2008). This index11 ranges from zero to five and its value is the un-weighted sum of five sub-indexes that range
from 0 to 1: (1) extent of coverage (subject matter and types of invention), (2) membership in international treaties, (3) duration of protection, (4) absence of restrictions on rights (e.g. degree of exclusivity), and, finally, (5) statutory enforcement provisions (e.g. preliminary injunctions). The IPR index is a broader variable and it is only in part affected by the adoption of the TRIPs agreements.
Secondly, in order to capture the TRIPs effect in the emerging countries we rely upon a treatment variable TRIPSt which is equal to one if t≥ 1996 and zero elsewhere., and we test whether it has a positive
impact on the bilateral technological collaborations and backward citations between country i and country j. This treatment variable however might catch only partially the effects of the TRIPs because the real
implementation level is different across countries.
11 Data are available for an average of 1960–90, for 1995, 2000, and 2005. The IPR observation for the year 1990 has been used
till 1995, when new information is available. The IPR observation for the year 1995 has been used for 1995, 1996, 1997, 1998, and 1999. The IPR observation for the year 2000 has been used for 2000, 2001, 2002, and 2003. Finally, the IPR observation of the year 2005 has been used for the year 2004.
10
Aαit and Aβjt measure specific characteristics of country i and j. Theyare the constant price gdp
(GDPit and GDPit respectively for emerging and advanced country) and PATENTSit and PATENTSit are
the total number of patent applications respectively of country i and country j, at time t. Dij is the
geographical distance (DISTANCEij)between them, where θ is the “distance effect” and represents the
(negative) elasticity of bilateral patent citations or technological collaborations with respect to geographical distance. Moreover we control for some further specific characteristics of developing countries i. We also
expect technological collaborations to be related to the inflow of foreign direct investments (FDIit). Finally
we augment the gravity model by including bilateral imports (IMPijt) which represents the value of country i
import from country j.
TPijt represents the technological proximity between emerging and advanced countries. It is
measured by the uncentered correlation of the two countries’ distribution vectors of patents across 30 technological classes (OST, 2004) at time t (Pi and Pj ), as follows: TPij = PiP’j/[(PiP’i)(PjPj)]1/2.This indicator
typically ranges between 0 and 1 for all other pairs of countries. It is equal to one for the pairs of countries with identical distribution of technological activities; it is equal to zero if the distributions are orthogonal (Jaffe, 1988). Finally a dummy indicating a common legal origin (ORIGij) which is equal to one if i and j
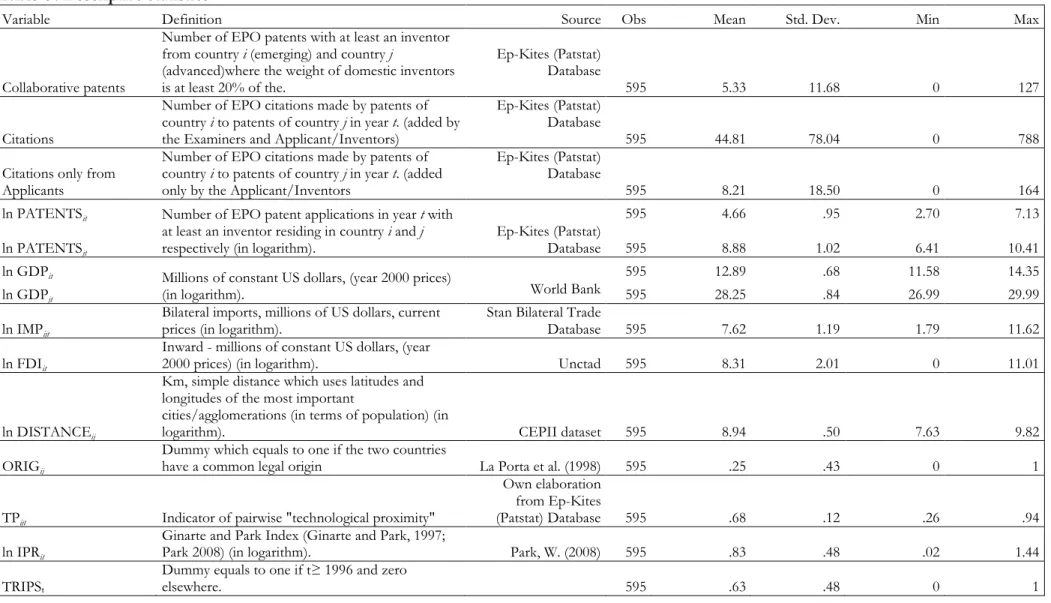
have a common legal origin (La Porta et al., 1998). Table 4 shows a description of the datasets used and their sources.
Our dependent variables are non-negative integers and challenge the use of linear regression models such as OLS12. Moreover, since their distribution is highly skewed and exhibits overdisperion, we
rely upon Negative Binomial (NB) models13 (Hausman et al., 1984) with clustered robust standard errors to
control for error correlation in the panel (Cameron and Golotvina, 2005), since observations in pairs of countries are likely to be dependent across years14. All the regressions contain a full set of time dummies (t
t)
to control for time varying un-observables that are common across countries. Moreover, to control for fixed effects we include either unobserved individual time constant effect specific to country i and country j (NB models), or time constant effect specific to each pair. Finally, we control for all the unobservable
12 A possible problem may arise from the endogeneity of the some variables (e.g. imports, FDIs, IPRs). Reverse causality may
result from self-selection. The countries with companies more willing to cooperate and use IPRs may accelerate trade, FDIs relations and the adoption of stricter IP rules. It could be that firms in high-tech or patent-intensive industries on the basis of collaborative strategies increases trade, FDIs and lobby for protection leading to reverse causality or, conversely, that governments decide to protect the best innovative companies, and so it is not clear which way the bias, if any, would go. However it is generally difficult to find valid instruments, and in a fixed effects model at country level it is unclear whether there is in fact a serious endogeneity issue.
13 According to the LR test, for both collaborations and citations models, we prefer the Negative Binomial rather than Poisson. 14 An alternative to Negative Binomial model is the Poisson pseudo-maximum likelihood (PPML) estimator as suggested by
Santos Silva and Tenreyro (2006), with the classical Huber and White sandwich estimator of variance (Huber, 1967, White, 1980). Moreover PPML estimator does not require that data be distributed as a Poisson and are consistent in the presence of fixed effects and when the frequency of zeros is quite important (Ben Shepherd, 2013).
11
factors which characterize each country-pairs and may have an impact on the propensity to collaborate and cite by using NB Fixed Effects models.
5. Results
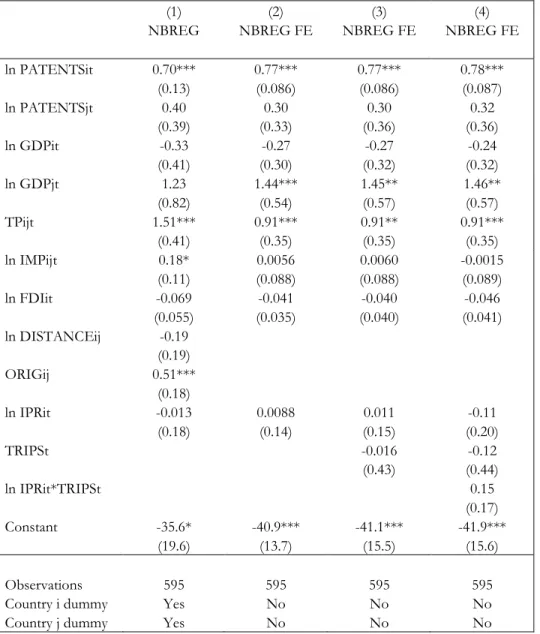
Tables 5 and 6 present the estimates of the gravity models. In column (1)-(3) in both tables we show simple NB regressions with individual time constant effects specific to emerging and advanced country; in column (4) and (5) we show fixed effects NB models which include fixed effects relative to each specific pair of countries. Moreover all models contain a full set of time dummies which capture any time shock that is common to all bilateral relations.
First we estimate the effect of our selected determinants on knowledge flows measured by patterns of co-inventorship (Table 5). Secondly we ask how the same determinants affect the transfer of knowledge captured by patent citations (Table 6). A group of results are common in the two sets of regressions. The estimates show that the gravity model is asymmetric because the masses measured by patenting activity and GDP have different effect according to emerging and advanced country. In particular patenting activity has a positive and significant effect only in the case of patent applications by emerging countries (ln PATENTSit). Moreover, the size of the economy is positively correlated to the number of patent
collaborations and patent citations only in case of advanced countries (ln GDPij), indicating that emerging
countries tend to interact more with the largest economies.
Secondly, differently from to the international trade theory where bilateral trade and FDIs decrease with geographical distance (Disdier, Head; 2008), we find that geographical distance (DISTANCEij) is
negative but slightly significant only for patent citations. It can be noted that contrary to the usual assumption we find that examiner citations are more localized than inventor citations (see Criscuolo and Verspagen, 2008; Bacchiocchi and Montobbio, 2010). Rather than geographical distance, other forms of distances, such as technological and cultural distances, play a more important role, especially for patent collaborations. In fact other forms of distances - such as having a common legal origin (ORIGij) and
similarity in the technological distribution of the inventive activity (TPijt) - have still a significant effect.
In particular, the difference in the logs of expected patent collaborations is expected to be 0.51 units higher for countries sharing a common legal origin, while holding the other variables constant in the model. The effect is positive but not significant for patent citations. Technological proximity is positive and significant both for technological collaborations and patent citations, bilateral imports and FDIs do not display any significant correlation with patent collaborations. A positive and significant correlation for trade is found only in the case of patent citations (column 2-4, Table 7).
Our results do not highlight any positive effect of strengthening IPRs on technological
collaborations neither in NB models nor in fixed effects NB models. However, as suggested in Montobbio and Sterzi (2013), this may depend on the fact that IPRs may have different effects on the technological collaborations to the extent that these originate from multinationals’ subsidiaries, domestic firms, or single inventors.
For BRICSM countries, variations in the IPR variable can be directly related to the compliance to the TRIPS agreements in 1996. To control for this possibility we introduce also the variable TRIPSt (a
dummy variable that is equal to 1 for the year 1996-2004 and zero otherwise) in order to control for that portion of variation that can be attributed to this agreement. Table 6 shows that the estimated coefficient of the TRIPS agreement on international technological collaborations is negative but still not significantly different from zero (column (3)). Altogether these results do not provide any signal of a positive effect of IPRs reinforcement on knowledge flows captured by international patenting collaborations.
Table 6 shows that in the case of patent citations, strengthening IPRs, similarly to the international collaborations case, has a non-significant impact on the international knowledge flows (Columns 1-4). However we observe different results when we consider only citations which are added from the applicants (or inventors) during the application procedure (Columns 5-8). The idea is that a citation is able to track the direction of knowledge to the extent that it has been added, and so it is known, by the patent applicant/inventor. This is particularly important for EPO patents, where the majority of patent citations are added by the examiners rather that the applicants (or inventors). In this case, stronger IPRs turn out to be positively correlated with the number of backward citations. This result is robust to the control of the dummy variable TRIPS. Results in Columns 7 and 8 show that the implementation of the TRIPS agreements does not have an additional positive impact on the patent citations15.
6. Conclusion
As innovation goes global, there is a rising demand for global knowledge governance. This issue is at the center of the political debate in advanced, as well as in emerging and developing economies. However, which mix of policies better supports the generation and diffusion of knowledge in global economies on a fair basis is still an open debate. Innovation is increasingly the result of the combination of knowledge, know-how, competences and techniques whose generation and diffusion occur usually involving international counterparts. In developing countries access to foreign technologies, collaboration with
15 However, by consider 1 year lag for independent variables, the effect of the TRIPS variable and its interaction with IPR turn
out to be negative and significant (p<0.01)
13
foreign counterparts, both in the domestic country and abroad is a hot political issue. Scientific research increasingly involves international counterparts and mobility of researchers is on the rise. Collaborative links with foreign laboratories rely more on relational and capability proximity than on geographical distance. Also, multinationals are increasingly delocalizing R&D activities in host countries, spurring a debate on which are the conditions under which the local community of researchers and firms can learn by tapping into foreign collaborative networks. Governments, for example in Brazil, in Mexico as well as in India, set up different types of incentives for their researchers to build close interpersonal collaboration with foreign researchers, and encourage local firms to collaborate with foreign subsidiaries to access foreign knowledge, or support delocalization of firms to learn from foreign practices in foreign markets.
In this context our paper contributes in two ways. First of all we compare the economic and institutional determinants of two types of knowledge flows. The ones that flow disembodied and codified and the ones that, since technical knowledge is in many aspect specific and tacit, are transmitted through face to face contacts. We show that geographical distance (e.g. communications and transport costs) does not have a strong direct effect on knowledge flows. Still it could have an indirect effect in particular through trade. Conversely technological proximity favors the transfer of knowledge. In addition knowledge flows are stronger when developing countries have accumulated a larger stock of patents and when they interact with the largest advanced economies. Our results show also that when knowledge is tacit, the economic and institutional determinants of knowledge flows have a stronger impact. The impact of sharing a common legal origin is positive and significant in the case of international technological collaborations.
Secondly we discuss the impact on knowledge diffusion of IP reinforcement in emerging countries. Our evidence suggests that there is not a strong and positive effect on knowledge flows generated by the reinforcement of IPRs in emerging economies and in particular by the TRIPs agreements. In particular our estimates show that IPRs reinforcement has not a positive effect on knowledge flows between the BRICSM countries and the G7 countries when international collaborations and the total number of patent citations are considered. We find however a positive effect of IPRs when only applicants’ citations are considered. An interesting challenge for further work is to explore whether this relation depends upon new IPRs based knowledge markets or formal economic relationship via trade or FDIs.
References.
Allred, B. and Park, W., (2007). Patent Rights and Innovative Activity: Evidence from National and Firm-level Data. Journal of International Business Studies 38(6), 878–900.
Bacchiocchi, E. and Montobbio, F., (2010). International knowledge diffusion and home-bias effect. Do USPTO & EPO patent citations tell the same story? Scandinavian Journal of Economics 112(3), 441-470.
Basheer, S., (2005). India’s tryst with TRIPS: the patents (amendment) Act 2005. The Indian Journal of Law and Technology 1, 15-43.
Breschi, S. and Lissoni, F., (2009). Mobility of skilled workers and co-invention networks: an anatomy of localized knowledge flows. Journal of Economic Geography 9(4), 439-468.
Cameron, A.C., & Golotvina, N., (2005). Estimation of Country-Pair Data Models Controlling for Clustered Errors: with International Trade Applications. Working Papers 06-13, University of California at Davis, Department of Economics.
Cimoli, M., Coriat, B. and Primi, A., (2009). Intellectual property and industrial development: a critical assessment, in Cimoli, M., G. Dosi and J. E. Stiglitz, (2009), Industrial Policy and Development: the political economy of capabilities accumulation, Oxford University Press, chp. 19.
Cimoli, M. and Primi, A., (2008). Technology and intellectual property a taxonomy of contemporary markets for knowledge and their implications for development. LEM Working Paper Series, 2008/06.
Coe, D.T. and Helpman, E., (1995). International R&D Spillovers. European Economic Review 39, 859-887.
Coriat, B., Orsi, F. and d’Almeida, C., (2006). TRIPS and the international public health controversies: issues and challenges. Industrial and Corporate Change 15(6), 1033-1062.
Criscuolo, P., and Verspagen, B. (2008), Does it Matter where Patent Citations Come From? Inventor vs. Examiner Citations in European Patents, Research Policy 37, 1892– 1908.
Delgado, M., Kyle, M., and McGahan, A.M., (2011). The influence of intellectual property protection on the geography of trade in knowledge-intensive goods. Mimeo.
Disdier, A.C. and Head, K., (2008). The Puzzling Persistence of the Distance Effect on Bilateral Trade. The Review of Economic and Statistics 90(1), 37-48.
Dosi, G., (1988). Sources, procedures and microeconomic effects of innovation. Journal of Economic Literature 26, 1120-1171.
Disdier, A. C. and Head, K., (2008). The Puzzling Persistence of the Distance Effect on Bilateral Trade.
The Review of Economics and Statistics 90(1), 37-48.
Griliches Z., (1990). Patent Statistics as Economic Indicators: A Survey. Journal of Economic Literature 18,
1661-1707.
Grossman, G.M. and Lai, E., (2004). International Protection of Intellectual Property. American Economic Review 94(5), 1635-165.
Guellec, D. and van Pottelsberghe de la Potterie, B., (2001). The internationalisation of technology analysed with patent data. Research Policy 30(8), 1253-1266.
Hausman, H. and Griliches, Z., (1984). Econometric Models for Count Data with an Application to the Patents-R&D Relationship. Econometrica 52(4), 909-938.
Hu, Albert G. Z. & Jaffe, Adam B., (2003). "Patent citations and international knowledge flow: the cases of Korea and Taiwan," International Journal of Industrial Organization, Elsevier, vol. 21(6), pages 849-880,
June.
Huber, P. J., (1967). The behavior of maximum likelihood estimates under nonstandard conditions. In Proceedings of the Fifth Berkeley Symposium on Mathematical Statistics and Probability. Berkeley, CA: University of California Press, vol. 1, 221–233.
Kanwar, S. and Evenson, R., (2003). Does Intellectual Property Protection Spur Technological Change?
Oxford Economic Papers 55, 235-264.
Kyle, M.K., and McGahan, A.M., (2009). Investment in Pharmaceuticals before and after the Trips. NBER Working Paper 15468.
La Porta, R., Lopez de Silanes F., and Shleifer A., (1998). Law and Finance. Journal of Political Economy,
106(6), 1113-1155.
Lanjouw, J. O. and Cockburn, I., (2001). New Pills for Poor People?: Empirical Evidence After GATT.
World Development 29(2), 265-89.
Lesser, W., (1998). Intellectual Property Rights and Concentration in Agricultural Biotechnology.
AgBioForum 1(2), 56-61.
McCalman, P. (2001). Reaping what you sow: an empirical analysis of international patent harmonization.
Journal of International Economics 55, 161-186.
Montobbio, F. and Sterzi, V., (2011). Inventing Together: Exploring the Nature of International Knowledge Spillovers in Latin America. Journal of Evolutionary Economics 21, 53-89.
Montobbio, F. and Sterzi, V., (2013). The globalization of technology in emerging markets: a gravity model on the determinants of international patent collaborations. World Development 44, 281-299.
OST (2004), “Indicateurs de sciences et de technologies”, Rapport de l’Observatoire des Sciences et des Techniques, Paris: Economica;
Park, W.G., and Ginarte, J.C., (1997). Intellectual Property Rights and Economic Growth,” Contemporary Economic Policy 15, 51-61.
Park, W. G. and Lippoldt, D. C., (2008). Technology Transfer and the Economic Implications of the Strengthening of Intellectual Property Rights in Developing Countries. OECD Trade Policy Working Papers 62, OECD Publishing. doi:10.1787/244764462745.
Park, W., (2008). International patent protection: 1960-2005. Research Policy 37, 761-766.
Peri, G., (2005). Determinants of Knowledge Flows and Their Effect on Innovation. The Review of Economics and Statistics, 87(2), 308-322.
Picci, L., (2010). The Internationalization of Inventive Activity: A Gravity Model Using Patent Data. Research Policy 39(8), 1070-1081.
Qian, Y., (2007). Do National Patent Laws Stimulate Domestic Innovation in a Global Patenting Environment? A Cross-Country Analysis of Pharmaceutical Patent Protection, 1978-2002. Review of Economics and Statistics 89(3), 436–453.Santos Silva, J.M.C. and Tenreyro, S., (2006). The Log of
Gravity. Review of Economics and Statistics 88(4), 641–658.
Shepherd, B., (2013). The Gravity Model of International Trade: a user guide. United Nations publication, Available from : http://www.unescap.org/tid/publication/tipub2645.pdf.
Singh, J., (2005). Collaborative networks as determinants of knowledge diffusion pattern. Management Science
51, 756-770.
Thompson, P., (2006). Patent citations and the geography of knowledge spillovers: evidence from inventor – and examiner – added citations. Review of Economics and Statistics 88, 383–388
Trajtenberg, M., (1990). A Penny for Your Quotes: Patent Citations and the Value of Innovations”. The RAND Journal of Economics 21(1), 172-187.
White, H., (1980). A heteroskedasticity-consistent covariance matrix estimator and a direct test forheteroskedasticity. Econometrica 48 (4), 817–830.
TABLES
Table 1. Patents, collaborative patents and real collaborative patents (by inventors), BRICSM countries, EPO patents
Brazil China India
year Totala Collaborativeb CollaboratReal ivec % (b/ a) Tot ala Collaborativeb Real Collaborat ivec % (b/ a) Tot ala Collaborativeb Real Collaborat ivec % (b/ a) 1990 51 10 9 20% 36 9 7 25% 34 17 13 50% 1991 35 9 8 26% 38 13 10 34% 22 10 9 45% 1992 58 16 12 28% 45 18 10 40% 31 13 13 42% 1993 60 14 11 23% 45 26 15 58% 44 26 15 59% 1994 45 12 10 27% 54 18 12 33% 34 21 12 62% 1995 77 34 26 44% 74 31 23 42% 45 20 13 44% 1996 69 24 17 35% 93 36 33 39% 74 32 22 43% 1997 109 26 19 24% 133 55 40 41% 83 25 21 30% 1998 115 66 23 57% 153 49 49 32% 147 53 39 36% 1999 142 31 15 22% 250 67 49 27% 183 72 62 39% 2000 137 36 25 26% 406 136 93 33% 224 69 45 31% 2001 171 51 38 30% 509 128 98 25% 321 77 60 24% 2002 153 33 30 22% 692 166 117 24% 499 109 95 22% 2003 201 46 36 23% 1136 216 174 19% 597 178 141 30% 2004 212 69 55 33% 1256 243 169 19% 591 186 142 31% TOT AL 1635 477 334 29% 4920 1211 890 25% 2929 908 702 31%
Mexico Russia South Africa
year Totala Collaborativeb CollaboratReal ivec % (b/ a) Tot ala Collaborativeb Real Collaborat ivec % (b/ a) Tot ala Collaborativeb Real Collaborat ivec % (b/ a) 1990 18 5 5 28% 72 4 4 6% 63 8 8 13% 1991 14 2 2 14% 90 13 13 14% 71 8 7 11% 1992 16 7 6 44% 143 29 29 20% 126 12 11 10% 1993 25 16 13 64% 148 39 39 26% 108 18 18 17% 1994 22 14 12 64% 173 56 52 32% 84 9 8 11% 1995 35 17 15 49% 169 53 49 31% 92 20 17 22% 1996 30 11 8 37% 216 70 61 32% 94 15 12 16% 1997 58 22 15 38% 213 74 71 35% 152 19 15 13% 1998 47 24 21 51% 255 87 80 34% 163 26 16 16% 1999 56 26 23 46% 279 105 91 38% 154 24 15 16% 2000 42 22 16 52% 287 100 88 35% 165 37 36 22% 2001 59 27 25 46% 301 101 92 34% 132 22 20 17% 2002 67 31 24 46% 238 87 75 37% 144 18 13 13% 2003 86 34 28 40% 277 101 90 36% 151 17 13 11% 2004 70 34 23 49% 280 93 82 33% 149 27 23 18% TOT AL 645 292 236 45% 3141 1012 916 32% 1848 280 232 15%
a: number of patents by inventor at the EPO; b: number of patents with at least on inventor residing in one of the selected advanced countries; c: number of patents with at least on inventor residing in one of the selected advanced countries where the domestic inventors are at least the 20%.
Table 2. Geographical distribution of EPO patents by address of inventors before and after Trips. Number of patents and shares by region.
Only national co-inventors a Other BRICSM b US c EU4 d Japan d
90-96 97-04 90-96 97-04 90-96 97-04 90-96 97-04 90-96 97-04 Brazil 394 73,50% 1025 73,50% 3 0,60% 4 0,30% 43 8,00% 126 9,00% 70 13,10% 149 10,70% 2 0,40% 8 0,60% China 382 67,60% 3257 74,50% 4 0,70% 5 0,10% 74 13,10% 473 10,80% 43 7,60% 229 5,20% 26 4,60% 65 1,50% India 283 64,50% 2038 73,80% 2 0,50% 3 0,10% 87 19,80% 390 14,10% 42 9,60% 161 5,80% 6 1,40% 15 0,50% Mexico 161 63,90% 411 66,10% 1 0,40% 3 0,50% 52 20,60% 113 18,20% 17 6,70% 61 9,80% 2 0,80% 3 0,50% Russia 1006 71,80% 1846 66,80% 2 0,10% 5 0,20% 103 7,30% 300 10,90% 136 9,70% 306 11,10% 15 1,10% 25 0,90% S. Africa 642 84,50% 1055 83,10% 4 0,50% 2 0,20% 24 3,20% 57 4,50% 64 8,40% 94 7,40% 1 0,10% 1 0,10%
a: number of patents with only national inventors; b: number of patents with at least an inventor from another BRICSM country; c: number of patents with at least one US inventor; d: number of patents with at least one inventor from the EU4 countries; e: number of patents with at least a Japanese inventor. Percentages have been rounded and my not total to 100%.
Table 3. Number of backward citations to EPO patents by destination country (and shares) before and after Trips
National citations a Other BRICSM b US c EU4 d Japan e
90-96 97-04 90-96 97-04 90-96 97-04 90-96 97-04 90-96 97-04 Brazil 20 2,7% 92 4,3% 3 0,4% 23 1,0% 323 44,1% 778 36,8% 293 40,0% 947 44,7% 79 10,8% 252 11,90% China 32 4,0% 376 4,7% 4 0,5% 47 0,6% 301 37,8% 3321 41,8% 261 32,7% 2389 30,1% 191 24,0% 1593 20,1% India 23 3,9% 246 5,8% 5 0,8% 39 0,9% 262 44,1% 1869 44,2% 202 34,0% 1328 31,4% 92 15,5% 668 15,8% Mexico 14 4,6% 39 4,3% 3 1,0% 6 0,7% 144 46,9% 389 42,9% 122 39,7% 345 38,0% 23 7,5% 109 12,0% Russia 117 6,7% 391 10,0% 4 0,2% 23 0,6% 623 35,6% 1635 41,9% 612 35,00% 1193 30,6% 370 21,1% 588 15,1% S. Africa 155 12,6% 271 16,6% 7 0,6% 10 0,6% 402 32,7% 612 37,5% 493 40,1% 550 33,7% 137 11,2% 157 9,6%
a: number of citations from a selected BRICSM country to patents of the same BRICSM country; b: number of citations from a selected BRICSM country to another BRICSM country; c: to US; d: to EU4 countries; e: to Japan. Percentages have been rounded and my not total to 100%.
Table 4 . Descriptive Statistics
Variable Definition Source Obs Mean Std. Dev. Min Max
Collaborative patents
Number of EPO patents with at least an inventor from country i (emerging) and country j
(advanced)where the weight of domestic inventors is at least 20% of the.
Ep-Kites (Patstat) Database
595 5.33 11.68 0 127
Citations
Number of EPO citations made by patents of country i to patents of country j in year t. (added by
the Examiners and Applicant/Inventors)
Ep-Kites (Patstat) Database
595 44.81 78.04 0 788
Citations only from Applicants
Number of EPO citations made by patents of country i to patents of country j in year t. (added
only by the Applicant/Inventors
Ep-Kites (Patstat) Database
595 8.21 18.50 0 164
ln PATENTSit Number of EPO patent applications in year t with
at least an inventor residing in country i and j
respectively (in logarithm).
595 4.66 .95 2.70 7.13
ln PATENTSjt
Ep-Kites (Patstat)
Database 595 8.88 1.02 6.41 10.41
ln GDPit Millions of constant US dollars, (year 2000 prices)
(in logarithm).
595 12.89 .68 11.58 14.35
ln GDPjt World Bank 595 28.25 .84 26.99 29.99
ln IMPijt
Bilateral imports, millions of US dollars, current
prices (in logarithm). Stan Bilateral Trade Database 595 7.62 1.19 1.79 11.62
ln FDIit
Inward - millions of constant US dollars, (year
2000 prices) (in logarithm). Unctad 595 8.31 2.01 0 11.01
ln DISTANCEij
Km, simple distance which uses latitudes and longitudes of the most important
cities/agglomerations (in terms of population) (in
logarithm). CEPII dataset 595 8.94 .50 7.63 9.82
ORIGij
Dummy which equals to one if the two countries
have a common legal origin La Porta et al. (1998) 595 .25 .43 0 1
TPijt Indicator of pairwise "technological proximity"
Own elaboration from Ep-Kites
(Patstat) Database 595 .68 .12 .26 .94
ln IPRit
Ginarte and Park Index (Ginarte and Park, 1997;
Park 2008) (in logarithm). Park, W. (2008) 595 .83 .48 .02 1.44
TRIPSt
Dummy equals to one if t≥ 1996 and zero
elsewhere. 595 .63 .48 0 1
Table 5. The impact of IPRs on Collaborative Patents
(1) (2) (3) (4)
NBREG NBREG FE NBREG FE NBREG FE
ln PATENTSit 0.70*** 0.77*** 0.77*** 0.78*** (0.13) (0.086) (0.086) (0.087) ln PATENTSjt 0.40 0.30 0.30 0.32 (0.39) (0.33) (0.36) (0.36) ln GDPit -0.33 -0.27 -0.27 -0.24 (0.41) (0.30) (0.32) (0.32) ln GDPjt 1.23 1.44*** 1.45** 1.46** (0.82) (0.54) (0.57) (0.57) TPijt 1.51*** 0.91*** 0.91** 0.91*** (0.41) (0.35) (0.35) (0.35) ln IMPijt 0.18* 0.0056 0.0060 -0.0015 (0.11) (0.088) (0.088) (0.089) ln FDIit -0.069 -0.041 -0.040 -0.046 (0.055) (0.035) (0.040) (0.041) ln DISTANCEij -0.19 (0.19) ORIGij 0.51*** (0.18) ln IPRit -0.013 0.0088 0.011 -0.11 (0.18) (0.14) (0.15) (0.20) TRIPSt -0.016 -0.12 (0.43) (0.44) ln IPRit*TRIPSt 0.15 (0.17) Constant -35.6* -40.9*** -41.1*** -41.9*** (19.6) (13.7) (15.5) (15.6) Observations 595 595 595 595
Country i dummy Yes No No No
Country j dummy Yes No No No
Standard errors in parentheses; in models (I) standard errors are clustered at pair level. All models include year dummies. *** p<0.01, ** p<0.05, * p<0.1.
Table 6. The impact of Trips on Patent Backward Citations
(1) (2) (3) (4) (5) (6) (7) (8)
NBREG NBREG FE NBREG FE NBREG FE NBREG NBREG FE NBREG FE NBREG FE Citations from Applicants and Examiners Citations only from Applicants
ln PATENTSit 1.09*** 1.03*** 1.03*** 1.02*** 1.19*** 1.14*** 1.09*** 1.07*** (0.049) (0.043) (0.043) (0.043) (0.20) (0.098) (0.10) (0.10) ln PATENTSjt 0.23 -0.17 -0.14 -0.13 1.23 -0.26 -0.31 -0.30 (0.27) (0.13) (0.14) (0.14) (0.88) (0.22) (0.22) (0.22) ln GDPit -0.27 -0.32** -0.29** -0.34** 1.55 -0.45* -0.43* -0.44* (0.21) (0.14) (0.14) (0.14) (1.14) (0.24) (0.24) (0.24) ln GDPjt 0.57** 0.60*** 0.60*** 0.58*** 0.41 0.64*** 0.64*** 0.63*** (0.26) (0.16) (0.16) (0.16) (1.40) (0.21) (0.21) (0.21) TPijt 0.82*** 0.71*** 0.73*** 0.75*** 0.41 2.12*** 2.03*** 2.03*** (0.23) (0.20) (0.21) (0.20) (0.82) (0.57) (0.57) (0.57) ln IMPijt 0.00014 0.12** 0.13** 0.13** 0.11 0.14 0.16 0.16 (0.037) (0.053) (0.053) (0.053) (0.086) (0.11) (0.11) (0.11) ln FDIit -0.032 -0.033** -0.022 -0.0078 0.097 0.10 0.048 0.054 (0.023) (0.017) (0.021) (0.021) (0.100) (0.069) (0.077) (0.077) ln DISTANCEij -0.16* -0.052 (0.084) (0.14) ORIGij 0.088 -0.38*** (0.061) (0.095) ln IPRit -0.17 -0.018 0.0076 0.16 0.38 0.52*** 0.49** 0.69** (0.11) (0.081) (0.085) (0.11) (0.37) (0.20) (0.20) (0.35) TRIPSt -0.18 -0.041 14.0 14.2 (0.20) (0.21) (564) (579) ln IPRit*TRIPSt -0.21** -0.24 (0.094) (0.34) Constant -16.3*** -15.1*** -15.8*** -14.9*** -50.2 -20.4*** -33.5 -33.5 (5.99) (4.07) (4.14) (4.17) (31.4) (5.90) (564) (579) ln alpha -2.63*** -0.79*** (0.18) (0.17) Observations 595 595 595 595 595 595 595 595 Country i
dummy Yes No No No Yes No No No
Country j
dummy Yes No No No Yes No No No
Standard errors in parentheses; in models (1) and (5) standard errors are clustered at pair level. All models include year dummies. *** p<0.01, ** p<0.05, * p<0.1.