Alteration of optical anisotropy by adsorption of
volatile molecules on ordered metalloporphyrins layers
Gianlorenzo Bussetti,
aD. D’Ercole,
aS. Cirilli,
aA. Violante,
aC. Goletti,
aP. Chiaradia,
aLuca Tortora,
bR. Paolesse,
bE. Martinelli,
cC. Di Natale,
cA. D’Amico,
cand Ludovoico Valli
da Università di Roma "Tor Vergata," Dipartimento di Fisica e CNISM, Via della ricerca scientifica, I-00133, Roma, Italy
b Università di Roma "Tor Vergata,” Dipartimento di Scienze e Tecnologie Chimiche, Via della ricerca scientifica, I-00133, Roma, Italy
c Università di Roma "Tor Vergata," Dipartimento di Ingegneria Elettronica, Via del Politecnico, I-00133, Roma, Italy
d Università di Lecce, Dipartimento di Ingegneria dell’Innovazione, Via Monteroni, 73100, Lecce, Italy
Abstract. Reflectance anisotropy spectra of porphyrin thin films (30 monolayers) show a
permanent change in their line shape when porphyrins are exposed to some specific analytes (e.g., amines). From this experimental evidence, we concluded that a molecular package adjustment occurred in the film upon interaction with the volatile compound, most likely in the outermost layers. This result is of paramount importance for the consequent application of these films in optical gas-sensors. Consequently, this system could be used as a prototype for optical gas-sensing of aggressive analytes or, more ambitiously, to investigate the porphyrin-analyte interaction.
Keywords: optical anisotropy, porphyrins, organic ordered layer, volatile organic compound,
molecule-molecule interaction, sensor.
1 INTRODUCTION
Porphyrin-based compounds can be used as active elements for gas-sensing devices [1,2]. This choice is mainly founded on three reasons: i) synthetic chemistry of porphyrins is well developed [3], offering nowadays versatile preparation pathways and substance purification methods simple, reliable and usually cheap; ii) the electronic and optical properties of molecules can be easily tuned by chemical manipulation; iii) specific metal porphyrin derivatives (e.g. magnesium and iron), play a key role in important biological processes (e.g. chlorophyll and heme group in, respectively, photosynthesis and animal breathing), characterized by working mechanisms exploitable in sensing applications [4].
The interaction of porphyrins with gases and/or volatile organic vapour compounds (VOCs) can be detected by different techniques, using the related effect for gas sensing. Among these we mention: i) frequency variation of a quartz balance whose vibrating plate has been covered with a porphyrin layer (micro-balance method, QCM) [5]; ii) optical transmission during the gas exposure [6]; iii) optical cavity resonance, to enhance the organic film reflection [7-9].
Quite recently, we demonstrated that is possible to follow the analyte binding equilibria of a Langmuir-Blodgett (LB) porphyrin thin film by using Reflectance Anisotropy Spectroscopy (RAS) [10], an optical technique usually applied in surface physics investigation, assessing a good sensitivity to gas. However, the interpretation of the measured RAS line shape as well as of its evolution during the exposure to VOCs has been not definitively explained. As an hypothesis, we related the optical anisotropy variation to structural changes occurring in the layer, in its turn yielding a modification of the π-π stacking arrangement on neighbouring porphyrin molecules [11]. Following this idea, a theoretical paper by the group of B. Mendoza presented a model to explain RAS spectra of molecular layered systems [12,13]: it was suggested there that well defined RAS structures are related to specific molecular arrangements. To test the model, we performed a combined Scanning Tunnelling Microscopy (STM) and RAS investigation of porphyrin layers obtained by sublimation in ultra-high-vacuum [14]. As a result, the relation between layer morphology and optical line shape was experimentally settled: a change in the RAS line shape is actually related to a partial re-arrangement of the upper most organic layer, as pointed out by Mendoza [12,13]. In this view, the interaction of LB films with analytes could perturb our sample, changing the RAS signal measured during the exposure to VOCs.
In our previous experiments with ethanol, we have shown that this change is not permanent: the original RAS signal can be recovered after purging the layer in nitrogen flux for several minutes [10]. But in other cases (an example is reported here), the modification of the RAS spectrum is permanent. This means that the original porphyrin package, biased by LB preparation, is irreversibly modified upon interaction with some volatiles. The lack of a complete RAS signal recovery after purging the sample from gases and vapours, represents an important factor to take in account for sensor measurement protocols, where calibration and reversible interaction are actually requested.
In this paper we describe some experiments where thin porphyrin films have been exposed to particularly aggressive VOCs, as triethylamine (TEA) and trimethylamine (TMA), also to explore the perspective of the development of gas-sensors based on RAS to monitor the active film contamination to VOCs.
2 EXPERIMENTAL DETAILS
In a RAS spectrometer, linearly polarized light -alternatively directed along two orthogonal directions (α and β)- impinges on a surface at near normal incidence [15,16]. The modulation of light polarization is accomplished via the transparent optical head birefringence of a Photo-Elastic-Modulator (PEM), oscillating at the resonance frequency ν (∼50 kHz) [17]. The reflected beam is collected and focused in a detector, producing a signal analysed by a lock-in amplifier. In this way, one measures the variation ∆R of reflected light, modulated at frequency 2ν (∼100 kHz) [18]. The ratio between ∆R and the mean reflectivity value R expresses the result of the measurement:
,
R
R
R
R
2
∆R/R
S
β α β α+
−
=
=
(1),where Rα (Rβ) is the intensity of light reflected from the sample, respectively for light polarized along α (β). S is related to the anisotropy of the sample reflectance.
When an organic layer of thickness d<<λ (λ being the wavelength of light) is deposited on a solid substrate, ∆R/R can be expressed in terms of the complex dielectric function anisotropy
∆ˆ
ε
l of the growing layer [19], by:[
]
,
π
8
∆R/R
'' ' l lB∆
A∆
d
ε
ε
λ
−
=
(2), where∆
ε
l′
and∆
ε
l′′
are respectively the real and imaginary part of∆ˆ
ε
l. The coefficients
,
)
1
(
1
2 " 2 ' ' s s sA
ε
ε
ε
+
−
−
=
' 2 "2 ")
1
(
s s sB
ε
ε
ε
+
−
=
(3) contain the dependence upon the substrate dielectric function (in our case, polycrystalline gold), and can be computed from experimental optical data. In particular, A (B) mainly depends upon the dispersive (dissipative) part ofε
ˆ
s.∆R/R spectra presented in this paper were measured in the visible-near UV range (370-490 nm, or 2.5-3.4 eV), by using a compact spectrometer consisting of a Xenon lamp, a grating monochromator, CaF2 lenses to collect and focus light, a home-made PEM and a multi-alkali photomultiplier. The electronic apparatus of our set-up uses a real-time feed-back to maintain a constant photocurrent from the detector.
Two different samples have been prepared, both of them based on Zn 10,15,20-tetrakis(4-heptyloxyphenyl)porphyrin (Zn-HepOTTP), prepared by the Adler method [20]: sample #1 and sample #2 were deposited onto quartz and gold respectively, by Langmuir-Blodgett (sample #1) and Langmuir-Schaeffer (sample #2) techniques. Film depositions were carried out using a KS5000 System 3 apparatus. The value of barrier pressure was 25 mN/m for both samples, while the dipping speed was 10 mm/min for the LB film. The nominal sample thickness in both cases is 30 monolayers (ML).
The sample has been inserted in a little plastic chamber with inlet and outlet gates for the gas flow. A home-made glass window (with Viton O-ring) allows the optical access to the sample: the possible optical signal due to the window birefringence in principle can be subtracted from data measuring the spectrum from a reference sample put inside the chamber and exhibiting an almost null anisotropy in the whole energy range (usually Si(001)). The sample #1 and sample #2 were exposed respectively to two different types of amines: triethylamine (TEA) and trimethylamine (TMA). Saturated vapours of TEA (7.5 × 10⁴ ppm) were obtained bubbling a nitrogen carrier into a liquid sample of TEA whereas the TMA concentration (1.8 × 10³ ppm ) was obtained diluting a nitrogen calibrated tank by mass flow controller apparatus. The sample has always been kept at room temperature.
It has been already demonstrated that LB and LS porphyrin thin films show evident changes in their optical anisotropy spectra when exposed to VOCs [10]. Moreover, the interaction of porphyrins with some specific compounds (ethanol, in Ref. 10), even at high concentrations (saturated vapours, about 2x10⁴ ppm), is completely reversible after purging the sample in N2. This means that it is possible to recover the original optical anisotropy spectrum, that is before exposure to VOCs, by fluxing nitrogen for a few minutes. Both these findings (i.e. the signal variation detected by RAS and the signal recovery) are even demonstrated for samples very similar to those used in this work, as showed in Fig. 1 of Ref. 21, where the usual exposure/recovery cycle is shown together with their selectivity properties, after the exposure to different VOCs (Fig. 2 in Ref. 21). Consequently, our RAS measures on specific porphyrin films can be considered a good optical gas-sensing prototype.
2 RESULTS AND DISCUSSION
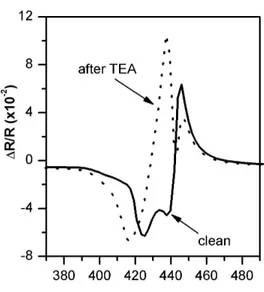
As briefly described in the introduction, RAS spectra of LB/LS porphyrin films are strictly related to the molecular package of the uppermost sample layers. It is possible that specific analytes induce permanent changes in RAS optical spectra due to a rearrangement of the layer. In Fig. 1, we compare the spectra of sample #1 before (clean spectrum, full line) and
after (contaminated spectrum, dotted line) the exposure to saturated vapours of triethylamine (7.5 × 10⁴ ppm).
Fig. 1. ∆R/R spectra measured on a Zn-HepOTTP LB thin film (sample #1), before (solid line) and after (dotted line) the exposure to saturated vapours of triethylamine (7.5 × 10⁴ ppm). See text for details.
The original spectrum shows three main structures: i) a negative peak at around 425 nm, ii) a second negative peak at 440 nm, iii) a sharp positive peak at 445 nm. We note that both the negative peaks are in the so called Soret region, where the main porphyrin HOMO-LUMO electronic transition lies. Since no significant changes of the clean spectrum were observed with time after its preparation, the porphyrin film is stable in air and the original molecular package, induced by LB, has been preserved. In contrast the exposure to TEA dramatically modifies the optical line-shape: the clean positive structure, at about 445 nm, reduces its intensity, while the energy position is stable. The negative peak intensity at 425 nm is enhanced by a few RAS units (1 RAS unit = 1x10⁻³) and a clear peak position blue-shift is observed. The most significant change is the sign flip of the 440 nm peak from negative to positive. Per Refs. 12 and 13, the porphyrin package of the uppermost layer should have been significantly rearranged after exposure to TEA. The resultant RAS spectrum is stable: the
clean layer signal cannot be recovered by fluxing the sample in nitrogen, dry air or in other
vapours, commonly used to purge sensors. This significant variation of all the clean RAS pristine structures upon interaction with the volatile molecules (in position, intensity and sign), should be taken into account looking at the application of such a film for the detection of aggressive VOCs. For example a careful QCM sensor calibration needs to be carried out after a first cycle of measurements; furthermore, although RAS cannot be used as transducer for this lack of reversibility, the RAS-based device could be used as dosimeter to monitor the presence of some specific compounds, such as for example TMA in food analyses.
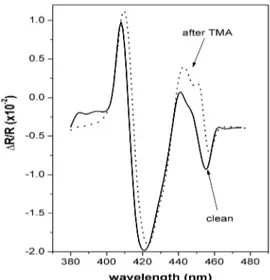
The second porphyrin film (sample #2) has been used to monitor the RAS signal variation during its exposure to a lower concentration of TMA (about 1.8 × 10³ ppm). The starting RAS line-shape is different with respect to sample #1 (see Fig. 2), as a likely consequence of the different deposition technique (LS instead of LB). Also in this case, the exposure to TMA has produced a permanent modification in the spectrum. However, a significant difference exists when Figs. 1 and 2 are compared: although the modification is still irreversible, the line shape variation can now be described in terms of an intensity attenuation (in the wavelength range 435-465 nm: elsewhere the spectrum is nearly not modified) rather than a heavy spectral change as in Fig. 1. We have tried to recover the original spectrum by heating sample #2 after exposure to TMA by a 250W halogen lamp (distance: 50 cm, time: 15 minutes), if the original layer morphology could be obtained supplying sufficient thermal energy to the molecular assembly.
Fig. 2. ∆R/R spectra measured on a Zn-HepOTTP LS thin film (sample #2), before (solid line) and after (dotted line) the exposure to 1.8 × 10³ ppm of trimethylamine vapors. See text for details.
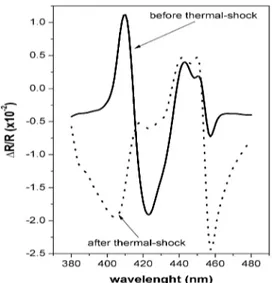
In Fig. 3, we report the result obtained after this thermal treatment. We observe that, even in this case, the original RAS spectrum, that is the one measured before exposure to TMA, is definitely lost. The positive peak at 410 nm is negative and appears broader than before. The further negative structure at around 425 nm is instead completely disappeared. Also in this case, the spectral line shape does not undergo any detectable modification with time.
Comparing different methods used to monitor the contamination of organic films, we observe that the information contained in RAS data is rich and complex: it does not relate simply to the total amount of adsorbed gas, as in the micro-balance method, but "measures" the rearrangement of porphyrin molecules that occurred during the exposure to VOCs, in its turn strictly related to molecular dipole-dipole interaction [11-13] and, consequently, to the molecular package. This fact offers the opportunity for a more complete investigation of a complex event as the interaction of the analyte molecules with the sensing film. For its
particular characteristics, RAS offers a particularly high sensitivity to enhance very minute changes occurring in deposited thin films.
Fig. 3. ∆R/R spectra measured on sample #2, before (full line) and after (dotted line) the sample annealing (about 15 minutes under a 250W halogen lamp). This method is usually employed to purge an organic gas sensor after a heavy contamination from analytes.
3 CONCLUSIONS
In conclusion, RAS spectra are a signature of the porphyrin molecular arrangement in the upper most layers of LB and LS thin films. We have shown that exposing these films to TEA and TMA the RAS signal changes irreversibly. This experimental result is evidence for a permanent rearrangement of the porphyrin package occurring during the exposure to aggressive VOCs, and points to a possible application for investigating the porphyrin-analyte and porphyrin-porphyrin interaction. A forthcoming Atomic Force Microscopy (AFM) experiment to study in real space the morphology changes caused by the exposure of LB films to contaminants, will strengthen our analysis of data, in the actual lack of a satisfactory theoretical model.
References
[1] A. D’Amico, C. Di Natale, A. Macagnano, F. Davide, and A. Mantini, "Techonologies and tools for mimicking olfaction: status of the Rome 'Tor Vergata,' nose," Biosens. Bioelectron. 13, 711-721 (1998) [doi:10.1016/S0956-5663(98)00026-8].
[2] A. Legin, A. Rudnitskaya, Yu. Vlasov, C. Di Natale, E. Mazzone, and A. D’Amico, "Application of electronic tongue for qualitative and quantitative
analysis of complex liquid media," Sens. Actuat. B: Chem. 65, 232-234 (2000) [ doi:10.1016/S0925-4005(99)00324-X].
[3] K. M. Kadish, K. M. Smith, and R. Guilard, Eds., The Porphyrin Handbook, Vols. 1-10, Academic Press, San Diego (2000).
[4] K. M. Kadish, K. M. Smith, R. Guilard, Eds., The Porphyrin Handbook, Vols. 11-20, Academic Press, San Diego (2003).
[5] J. A. J. Brunink, C. Di Natale, F. Bungaro, F. Davide, A. D’Amico, R. Paolesse, T. Boschi, M. Faccio, and G. Ferri, "The application of metalloporphiryn as coating material for quartz microbalance-based chimica sensors," Anal. Chim.
Acta 325, 53-64 (1996) [doi:10.1016/0003-2670(96)00017-7].
[6] T. H. Richardson, C. M. Dooling, O. Worsfold, L. T. Jones, K. Kato, K. Shinbo, F. Kaneko, R. Tregonning, M. O. Vysotsky, and C. A. Hunter, "Gas sensing properties of porphyrins assemblies prepared using ultra-fast LB deposition," Coll.
Surf. A 198, 843-857 (2002) [doi:10.1016/S0927-7757(01)01011-1].
[7] L. De Stefano, L. Moretti, I. Rendina, and A. M. Rossi, "Time-resolved sensing of chemical species in porous silicon optical microcavity," Sens. Actuat. B: Chem.
100(1-2), 168-172 (2004) [doi:10.1016/j.snb.2003.12.044].
[8] V. Mulloni and L. Pavesi, "Porous silicon microcavities as optical chimica sensors," Appl. Phys. Lett. 76, 2523-2525 (2000) [doi:10.1063/1.126396].
[9] H. Ouyang, C. Striemer, and P. M. Fauchet, "Quantitative analysis of the sensitivity of porous silicon optical bio-sensors," Appl. Phys. Lett. 88, 163108 (2006) [doi:10.1063/1.2196069].
[10] G. Bussetti, C. Corradini, C. Goletti, P. Chiaradia, M. Russo, R. Paolesse, C. Di Natale, A. D’Amico, and L. Valli, "Optical anisotropy and gas sensing of ordered porphyrins films," phys. stat. sol. (b) 242, 2714-2719 (2005)
[doi:10.1002/pssb.200541104].
[11] C. Goletti, R. Paolesse, E. Dalcanale, T. Berzina, C. Di Natale, G. Bussetti, P. Chiaradia, A. Froiio, L. Cristofolini, M. Costa, and A. D’Amico, "Thickness dependence of the optical anisotropy for porphiryns octaester Langmuir-Schaefer films," Langmuir 18, 6881-6886 (2002) [doi:10.1021/la025756l].
[12] C. Castillo, R. A. Vàzquez-Nava, and B. S. Mendoza, "Reflectance anisotropy for octaester Langmuir Schaefer films," phys. stat. sol. (c) 0(8), 2971-2975 (2003) [doi:10.1002/pssc.200303859].
[13] B. S. Mendoza and R. A. Vàzquez-Nava, "Model for reflectance anisotropy spectra for molecular layered systems," Phys. Rev. B 72, 035411 (2005) [doi:10.1103/PhysRevB.72.035411].
[14] M. Scarselli, G. Ercolani, P. Castrucci, D. Monti, G. Bussetti, M. Russo, C. Goletti, P. Chiaradia, R. Paolesse, and M. De Crescenzi, "A combined scanning tunneling microscopy and reflectance anisotropy spectroscopy investigation of tetraphenilporphirin deposited on graphite," Surf. Sci. 601, 2607-2610 (2007) [ doi:10.1016/j.susc.2006.12.003].
[15] D. E. Aspnes and A. A. Studna, "Anisotropies in the above-band-gap optical spectra of cubic semiconductors," Phys. Rev. Lett. 54, 1956-1959 (1985) [doi: 10.1103/PhysRevLett.54.1956].
[16] V. L. Berkovits, I. V. Makarenko, T. A. Minashvili, and V. I. Safarov, "Anisotropy of the optical reflection of cubic semiconductor due to surface band-bending," Sov. Phys. Semicond. 20, 654-657 (1986).
[17] J. C. Kemp, "Piezo-optical birefringence modulators: new use for a long-known effect," J. Opt. Soc. Am. 59, 950-953 (1969) [doi:10.1364/JOSA.59.000950]. [18] C. Goletti, G. Bussetti, P. Chiaradia, A. Sassella, and A. Borghesi, "The
application of reflectance anisotropy spectroscopy to organic depositions," Org.
[19] S. Selci, F. Ciccacci, G. Chiarotti, P. Chiaradia, and A. Cricenti, "Surface differential reflectivity spectroscopy of semiconductors surfaces," J. Vac. Sci.
Technol. A 5, 327-332 (1987) [doi:10.1116/1.574154].
[20] A. D. Adler, F. R. Longo, J. D. Finarelli, J. Goldmacher, J. Assour, and L. Karsakoff, "A simplified synthesis for meso-tetraphenylporphine," J. Org. Chem.
32, 476 (1967) [doi: 10.1021/jo01288a053].
[21] G. Bussetti, S. Cirilli, A. Violante, P. Chiaradia, C. Goletti, L. Tortora, R. Paolesse, E. Martinelli, A. D’Amico, C. Di Natale, G. Giancanel, and L. Valli, "Optical anisotropy readout in solid-state porphyrins for detection of volatile compound," Appl. Phys. Lett. 95, 091906 (2009) [doi:10.1063/1.3202400].