UNIVERSITÀ DEGLI STUDI DI ROMA
"TOR VERGATA"
FACOLTA' DI INGEGNERIA
DOTTORATO DI RICERCA IN
INGEGNERIA DELL'ENERGIA - AMBIENTE
CICLO DEL CORSO DI DOTTORATO
Titolo della tesi
Simulazione numerica di sistemi di celle a combustibili ad ossidi solidi
Nome e Cognome del dottorando
DANIELE COLOCCINI
A.A. 2009/2010
Docente Guida/Tutor: Prof. V. Rocco
- Contents
Introduction……….3
1 Solid Oxide Fuel Cell...……….4
1.1 Introduction…....……….4
1.2 Fuel Cell Stacking………...6
1.3 Auxiliary components……….7
1.4 Fuel Cell Types………....8
2 3D SOFC Model………10
2.1 Introduction……….…10
2.2 Fuel Cell Description………..…10
2.3 Experimental Setup……….12
2.4 Numerical Model………...14
2.5 Model validation and results………...25
2.6 Using Syngas as Fuel………...34
2.7 Model validation and results………49
3 SOFC System……….67
3.1 Introduction……….67
3.2 Description of the system………70
3.3 Plant configuration feed with methane (CASE A)………..……81
3.4 Plant configuration feed with anode recirculation (CASE B)… ………..……94
3.5 SOFC system feed by biogas………107
4 Stack of SOFC………..119
4.1 Introduction………...…119
4.2 General aspect………...120
4.3 Thermal consideration………...121
4.4 Assembling criteria………...132
4.5 Contact issues………144
4.6 Conclusion………...155
5 After burner integration………..157
5.1 Geometry of the model………..…157
5.2 Chemical model……….159
5.3 Model Description……….…163
5.4 Results Analysis……….173
Appendix: Arrhenius law coefficient calculation………...173
6 Conclusions……….…174
Introduction;
With the rising concern about greenhouse gas emissions, many countries are pursuing efforts to develop more sustainable energy systems to replace conventional combustion heat engines. Solid oxide fuel cell (SOFC) power generation shows great promise to serve as an alternative in the near future. Since SOFC operation relies on electrochemical reactions, its electrical efficiency is not limited by temperature as in the case of conventional heat engines. Therefore, the electrical efficiency obtained from a SOFC is typically greater and more stable than that obtained from conventional heat engines. Furthermore, additional efficiency can be gained by incorporating a steam/gas turbine cycle to recover heat from the hot gas exhausted from SOFCs because they operate at high temperatures between 800 and 1000°C. Fuel flexibility with SOFCs also presents advantages over other types of fuel cells such as polymer electrolyte membrane fuel cells (PEMFCs). In fact, the carbon monoxide present in the fuel gas is not harmful to SOFCs, and it can also act as a fuel. Therefore, a variety of hydrocarbon-based fuels or their syngas derivatives, such as natural gas, biomass and coal, can efficiently be used in SOFCs. Biomass and coal are gasified to form syngas, essentially containing a mixture of H
2, CO, CO2, H2O, N2 and eventually H2S. This syngas can then be used as a fuel in
SOFC. However, H
2S must be scrubbed before the syngas is fed to the SOFC to prevent rapid degradation of the SOFC
performance. Depending on the type of coal and biomass, the composition of syngas strongly varies so affecting the SOFC performance. Moreover, carbon formation is a problem that can limit SOFC performance when fed with syngas. This is due to the Boudouard reaction which converts CO to carbon on the anode surface. Therefore, properly operating strategies to limit carbon formation have to be considered.
In this work a mathematical model of hydrogen and syngas fed solid oxide fuel cells (SOFC) under stationary regime is presented. It is well known that diffusion, ohmic and activation overpotentials affect the fuel cell ideal efficiency, during cell operation. Hence, the aim of this thesis is to provide, for a given set of data describing the geometry of the cell and the operating conditions, an estimate of the losses and where they occur. Moreover, it is possible to develop a sensitivity analysis, allowing the definition of the influence on the cell performance of the most affecting parameters. Accordingly, the numerical tool can be considered as a design tool.
Several 2D and 3D numerical simulation of SOFCs have already been described, based on mathematical models under different simplifying assumption. In these works, as in the present work, the temperature distribution, concentration of the species and electrical current are obtained in the unit cell itself.. The originality of the present work is that it allows the evaluation of the local distribution of temperature, electric potential and concentration on a three dimensional computational domain, representing an anode-supported solid oxide fuel cell. The overall SOFC model consists of three sub-models:
- the fluid dynamic sub-model; - the electrochemical sub-model; - the thermal sub-model;
and the solution technique of both the electrochemical sub-model and the overall model is innovative, using a finite element discretization scheme to do it.
5
1. Solid Oxide Fuel Cell
1.1. Introduction
Fuel cells are electrochemical devices that directly convert chemical energy stored in fuels into electrical energy. Power generation is theoretically produced with high efficiency and low environmental impact. Fuel cells are not limited by thermodynamic limitations of heat engines such as the Carnot efficiency. Moreover, as combustion is avoided, fuel cells produce power with very low pollutant emission. However, unlike batteries the reductant and oxidant in fuel cells must be continuously replenished to allow continuous operation. Fuel cells bear significant resemblance to electrolysers. In fact, some fuel cells operate in reverse as electrolysers, yielding a reversible fuel cell that can be used for energy storage.
Fuel cells could, in principle, operate with a wide variety of fuels and oxidants. Of particular interest are the fuel cells that use common fuels (or their derivatives) or hydrogen as reductants, and air the oxidants.
Fuel cell power systems are usually constituted by:
- Unit cells, in which the electrochemical reactions take place;
- Stacks, in which individual cells are modularly combined by electrically connections to form units with the desired output capacity;
- Auxiliary components as, for example, reformer, air compressor, etc…
1.1.1. Unit cells
Unit cell is the core of a fuel cell. These devices convert the chemical energy electrochemically stored in a fuel into electrical energy. The basic physical structure of a fuel cell consists of an electrolyte layer in contact with an anode and a cathode on either side (PEN). A schematic representation of a unit cell with the reactant/product gases and the ion conduction flow directions through the cell is shown in Figure 1-1.
In a typical fuel cell, fuel is fed continuously to the anode and an oxidant is fed continuously to the cathode. The electrochemical reactions take place at the electrodes to produce electric current through the electrolyte. Although a fuel cell is similar to a typical battery for many aspect, it is very different. The battery is an energy storage device in which all the energy available is stored within the battery itself (at least the reductant). The battery stops to produce electrical energy when the chemical reactants are consumed (i.e., discharged). A fuel cell, on the other hand, is an energy conversion device to which fuel and oxidant are supplied continuously. In principle, the fuel cell produces power as long as fuel is supplied.
Fuel cells are classified according to the choice of electrolyte and fuel, which in turn determines the electrode reactions and the type of ions that carry the current across the electrolyte. Appleby and Foulkes [1] observe that, in theory, any substance which can be chemically oxidised and that can be continuously supplied can also be galvanically burned as fuel at the anode of a fuel cell. Similarly, oxidant can be any fluid that can be reduced at a sufficient rate. Though the direct use of conventional fuels in fuel cells would be desirable, most of the fuel cells today under development use gaseous hydrogen, or a synthesis gas rich in hydrogen, as a fuel. Hydrogen has a high reactivity for anode reactions, and can be produced chemically from a wide range of fossil and renewable fuels, as well as via electrolysis. The most common oxidant is gaseous oxygen, available from air.
The most critical part of the fuel cell is the three phase interface (TPB) where reactions occur. This area must be exposed to the reactant, be in electrical contact with the electrode, be in ionic contact with the electrolyte, and contain sufficient electro-catalyst for the reaction to proceed at the desired rate. The density of these regions and the nature of these interfaces play a critical role in the electrochemical performance of both liquid and solid electrolyte fuel cells:
- In liquid electrolyte fuel cells, the reactant gases diffuse through a thin electrolyte film that wets portions of the porous electrode and electrochemically reacts on the electrode surface. If the porous electrode contains an excessive amount of electrolyte, the electrode may "flood" reducing the transport of gaseous species in the electrolyte phase to the reaction sites. The consequence is a reduction in electrochemical performance of the porous electrode. Thus, a balance has to be respected among the electrode, electrolyte, and gaseous phases in the porous electrode structure.
- In solid electrolyte fuel cells, the challenge is to engineer a large number of catalyst sites into the interface that are electrically and ionically connected to the electrode and the electrolyte, respectively. In most successful solid electrolyte fuel cells, a high-performance interface requires the use of an electrode characterized by a mixed conductivity (i.e. it conducts both electrons and ions).
Over the past twenty years, the unit cell performance of at least some of the fuel cell technologies has been dramatically improved. These developments resulted from improvements in the three-phase boundary, obtained reducing the thickness of the electrolyte, and developing improved electrode and electrolyte materials which broaden the temperature range over which the cells can be operated.
Moreover, the electrolyte not only transports dissolved reactants to the electrode, but also conducts ionic charge between the electrodes, and thereby completes the cell electric circuit as illustrated in Figure 1-1. It also provides a physical barrier to prevent the fuel and oxidant gas streams from directly mixing. The functions of porous electrodes, other than to providing a surface for electrochemical reactions, are:
- conduct electrons from or into the three-phase interface once they are formed (so an electrode must be made of materials that have good electrical conductance);
- ensure that reactant gases are equally distributed over the cell;
- ensure that reaction products are efficiently led away to the bulk gas phase.
As a consequence, the electrodes are typically made of porous material. At low temperatures, only a few and relatively rare and expensive materials provide sufficient electro-catalytic activity. Accordingly, catalysts are deposited in small quantities at the interface. In high-temperature fuel cells, the electro-catalytic activity of the bulk electrode material is often enough.
Though a wide range of fuel cell geometries has been considered, most fuel cells under development now are either planar (rectangular or circular) or tubular (either single or doubleended and cylindrical or flattened).
7
1.1.2. Fuel cell stacking
For most practical fuel cell applications, unit cells must be combined in a modular fashion into a cell stack to achieve the voltage and power output level required for the application. Generally, the stacking involves connecting multiple unit cells in series via electrically conductive interconnects. Different stacking arrangements have been developed.
Planar-Bipolar Stacking
The most common fuel cell stack design is the so-called planar-bipolar arrangement (Figure 1-2). Individual unit cells are electrically connected with interconnections. Because of the configuration of a flat plate cell, the interconnection becomes a separator plate with two functions:
- to provide an electrical series connection between adjacent cells, specifically for flat plate cells;
- to provide a gas barrier that separates the fuel and oxidant of adjacent cells.
In many planar-bipolar designs, the interconnection also includes channels that distribute the gas flow over the cells. The planar-bipolar design is electrically simple and leads to short electronic current paths (which helps to minimize cell resistance).
Planar-bipolar stacks can be further characterized according to arrangement of the gas flow:
- Cross-flow. Air and fuel flow perpendicular to each other;
- Co-flow. Air and fuel flow parallel and in the same direction. In the case of circular cells, this means that the gases flow radially outward;
- Counter-flow. Air and fuel flow parallel but in opposite directions. Again, in the case of circular cells this means radial flow.
Figure 1-2 Expanded view of a basic fuel cell unit in a fuel cell stack
The choice of gas-flow arrangement depends on the type of fuel cell, the application, and other considerations. Finally, the manifolding of gas streams to the cells in bipolar stacks can be achieved in various ways:
- Internal: the manifolds run through the unit cells.
- External: the manifold is completely external to the cell, much like a wind-box.
Stacks with Tubular Cells
Especially for high-temperature fuel cells, stacks with tubular cells have been developed (Figure 1-3). Tubular cells have significant advantages in sealing and in the structural integrity of the cells. However, they represent a special geometric challenge to the stack designer to achieve high power density and short current paths. In one of the earliest tubular designs, the current is tangentially conducted around the tube. Interconnections between the tubes are used to form rectangular arrays of tubes. Alternatively, the current can be conducted along the axis of the tube, in which case interconnection is done at the end of the tubes. To minimize the length of electronic conduction paths for individual cells, sequential series connected cells are being developed. The cell arrays can be connected in series or in parallel.
Figure 1-3 Orientation of a tubular SOFC in a cell stack
To avoid the packing density limitations associated with cylindrical cells, some tubular stack designs use flattened tubes.
1.1.3. Auxiliary components
In addition to the stack, practical fuel cell systems require several other sub-systems and components; the so-called balance of plant (BoP). Together with the stack, the BoP forms the fuel cell system. The arrangement of the BoP strongly depends on the fuel cell type, the fuel choice, and the application. In addition, specific operating conditions and requirements of individual cell and stack designs determine the BoP characteristics. Furthermore, other components are:
- Fuel preparation system. Except when pure fuels (such as pure hydrogen) are used, fuel preparation is required, usually involving the removal of impurities and thermal conditioning. In addition, many fuel cells that use fuels other than pure hydrogen require fuel processing, such as reforming, in which the fuel reacts with some oxidant (usually steam or air) to form a hydrogen-rich anode feed mixture.
9
- Thermal management system. All fuel cell systems require careful management of the fuel cell stack temperature.- Water management system. Water is needed in some parts of the fuel cell, while overall water is a reaction product. A water circuit is often requested.
- Electric power conditioning equipment. Since fuel cell stacks provide a variable DC voltage output that is typically not directly usable for the load, electric power conditioning is typically required.
Figure 1-4 Fuel cell power plant major processes
Figure 1-4 shows a scheme of a fuel cell power plant. Beginning with fuel processing, a conventional fuel (natural gas, other gaseous hydrocarbons, methanol, naphtha, or coal) is cleaned, then converted into a gas containing hydrogen. Energy conversion occurs when dc electricity is generated by means of individual fuel cells combined in stacks or bundles. A varying number of cells or stacks can be matched to a particular power application. Finally, power conditioning converts the electric power from dc into regulated dc or ac for consumer use.
1.1.4. Fuel cell types
The most common classification of fuel cells is by the type of electrolyte used in the cells and includes:
- polymer electrolyte fuel cell (PEFC)
- alkaline fuel cell (AFC)
- phosphoric acid fuel cell (PAFC)
- molten carbonate fuel cell (MCFC)
- solid oxide fuel cell (SOFC).
Broadly, the choice of electrolyte dictates the operating temperature range of the fuel cell. The operating temperature and useful life of a fuel cell dictate the physicochemical and thermo mechanical properties of materials used in the cell
components (i.e., electrodes, electrolyte, interconnect, current collector, etc.). Aqueous electrolytes are limited to temperatures of about 200°C or lower because of their high vapor pressure and rapid degradation at higher temperatures. The operating temperature also plays an important role in dictating the degree of fuel processing required. In low-temperature fuel cells, all the fuel must be converted to hydrogen prior to entering the fuel cell. In addition, the anode catalyst in low temperature fuel cells (mainly platinum) is strongly poisoned by CO. In high-temperature fuel cells, CO and even CH
4 can be internally converted to hydrogen or even directly oxidized electrochemically.
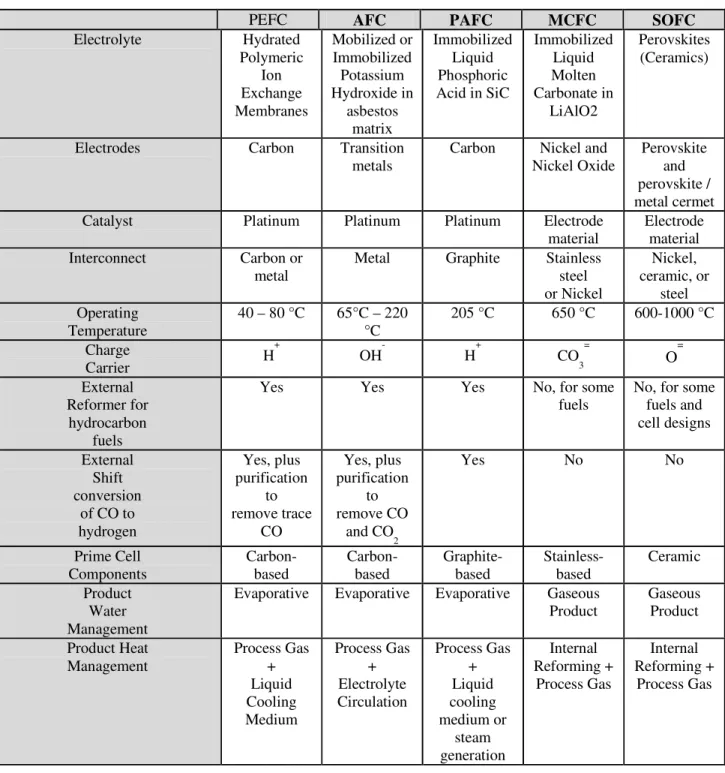
Table 1-1 provides an overview of the key characteristics of the main fuel cell types.
PEFC
AFC
PAFC
MCFC
SOFC
Electrolyte Hydrated Polymeric Ion Exchange Membranes Mobilized or Immobilized Potassium Hydroxide in asbestos matrix Immobilized Liquid Phosphoric Acid in SiC Immobilized Liquid Molten Carbonate in LiAlO2 Perovskites (Ceramics)
Electrodes Carbon Transition
metals
Carbon Nickel and Nickel Oxide
Perovskite and perovskite / metal cermet
Catalyst Platinum Platinum Platinum Electrode
material
Electrode material
Interconnect Carbon or
metal
Metal Graphite Stainless
steel or Nickel Nickel, ceramic, or steel Operating Temperature 40 – 80 °C 65°C – 220 °C 205 °C 650 °C 600-1000 °C Charge Carrier H + OH- H+ CO 3 =
O
= External Reformer for hydrocarbon fuelsYes Yes Yes No, for some
fuels
No, for some fuels and cell designs External Shift conversion of CO to hydrogen Yes, plus purification to remove trace CO Yes, plus purification to remove CO and CO 2 Yes No No Prime Cell Components Carbon-based Carbon-based Graphite-based Stainless- based Ceramic Product Water Management
Evaporative Evaporative Evaporative Gaseous Product Gaseous Product Product Heat Management Process Gas + Liquid Cooling Medium Process Gas + Electrolyte Circulation Process Gas + Liquid cooling medium or steam generation Internal Reforming + Process Gas Internal Reforming + Process Gas
11
- 2. 3D SOFC Model
2.1. Introduction
In the anode supported disk-shape SOFC study, the main objective was to have a better understanding of the phenomena occurring within the cell. For this reason, an extensive analysis of all the physical variables of each domain was performed. For sake of simplicity, the model was implemented in a 2D-simplified domain, and some limitations of such simplification were underlined, thus a 3D simulation was already identified as the next step for a better understanding of the operational-related phenomena.
The main objective of the present work is to improve anode-supported SOFC study, implementing it in a 3D domain, thus obtaining more accurate results, and, in addiction, attaining in-depth understanding of some operational-related phenomena, not analyzable in the 2D domain. In particular, an extensive analysis of the fluid-dynamics within the gas channel, and the related implication for the fuel cell performance are performed.
While in the 2D implementation, reported in [4], there was no prediction of the cell temperature, and an iso-thermal condition was assumed, in the present study, the energy balance within the fuel cell is also considered, and the temperature distribution is deduced.
Furthermore, while in [4], the model was validated by comparison with one polarization curve experimentally obtained, in the present study, the model results are compared with more than one experimental J-V curve.
2.2. Fuel cell description
The fuel cell analyzed in the present study is a disk-shape anode-supported SOFC, currently produced by InDec B.V. As illustrated in Figure 4-1, anode material is a cermet of Ni and YSZ, nickel oxide doped with yttrium stablilized zirconia, 8% yttrium (NiO/8YSZ). Cathode is composed of two layers: one made of 8YSZ with strontium-doped LaMnO
3 (8YSZ/LSM) and one of LSM. The electrolyte consists of dense 8YSZ.
The main geometrical characteristics of the fuel cell are reported in Table 4-1, while a schematic of the whole apparatus is depicted in Figure 4-2.
The single cell is arranged in sealess. Through the use of two alumina tubes perpendicular to the fuel cell plane, not shown in Figure 4-2, anodic and cathodic gases come in contact, respectively, with the anode and cathode in a small circular region, where the flux configuration changes into radial. Then, anodic and cathodic flows merge together at the cell outlet, where, due to the high temperature, combustion of the unoxidized hydrogen is takes place. Although cell cylindrical geometry leads to consider the gas flow as purely radial, this is an idealized condition that does not take place in the cell. The gas channels, in fact, are not realized in a radial configuration, but as a channel grid, as described in details in Section 4.3.
The deviation of the flux from a pure radial configuration, can lead to several consequences on the operational conditions of the fuel cell, thus affecting the resulting performance.
- First of all, if the gas is not well distributed within the cell surface, some parts of the cell are characterized by a higher reaction rate, compared to other surface zones. This implies the existence of preferred zones for the electrochemical reaction, and, consequently, of local high current density, which reduces the overall cell voltage.
- Secondly, a high reaction rate in some parts of the cell causes temperature gradients and, consequently, thermal stresses, which can cause the mechanical failure of the cell itself [5,6,7].
- Finally, the existence of some preferred zones for the electrochemical reaction implies that a part of the fuel cell is not completely exploited.
13
2.3. Experimental setup
The single cell described in Section 4.2. is embedded in a cell housing made of alumina. The surfaces of the cell housing are in contact with the fuel cell, and act as gas channels, i.e. they guide the gas from the internal part of the disk towards the outlet. Figure 4-3 shows the gas channels details. The geometry of the gas channels, as already mentioned, does not allow the gas to follow a pure radial direction, thus the effect of the preferred reactions zones needs to be quantified. Manufacturing a gas channel with an increasing cross-section would be more complex and more expensive than the present solution, thus it is highly desirable to understand the consequence on the fuel cell performance of the present geometry. The results of such analysis are presented in Section 4.5. As illustrated in Figure 4-4, the current is collected on the electrode surface through a mesh, which is interposed between the electrode surface and the pins delimiting the gas channels. The mesh is made of Platinum at the cathode side and of Ni at the anode side.
The cell housing is embedded in an electric furnace, which guarantees the desired fuel cell operating temperature. Figure 4-5 depicts the complete test-rig employed at the University of Perugia for testing the single cell. The electric load applied to the single cell is varied through the use of a potentiometer. Anodic and cathodic gas mixtures are obtained from laboratory-quality hydrogen, oxygen and nitrogen stored in gas cylinders outside the laboratory. Before
entering the single cell, hydrogen is saturated at room temperature, and then heated-up to 110 °C to avoid water condensation in the gas line. The test rig is also equipped with a peristaltic pump, a water mass flow controller, and an evaporator apparatus for dedicated tests where the water content in the anode needs to be varied. However, for the present study, hydrogen is saturated at room temperature. Mass flow controllers, electrical load, gas and furnace temperature are controlled through an in-house software realized in Visual Basic, and the results are stored in a dedicated file. Experimental results obtained at University of Perugia testing laboratory are shown in Figure 6 and 4-7.
15
2.4. Numerical model
The single cell described in Section 4.2. is schematically considered to be composed of five domains, namely the flow channels (air and fuel), two porous electrodes (cathode and anode), and the electrolyte. In this work, a detailed numerical model is applied to each sub-domain where the governing equations are directly solved applying appropriate interface conditions.
Hydrogen is considered as the only fuel, thus the following reaction takes place at the anode:
(1)
H
2+
O
2−→
H
2O
+
2
e
−where the oxygen ion is made available by the following oxidant reduction reaction that occurs at the cathode side:
(2)
+
−→
2− 22
2
1
O
e
O
Reactions occur at the so-called triple-phase-boundary (TPB) where there is the simultaneous presence of electrons, ions and gases. In the present model the TPBs is regarded as an infinite thin layer between the electrode and the electrolyte interface.
The electrons released from reaction (1) flow from the reaction zone (typically very close to the anode/electrolyte interface) to the current collector, through the anode. At the cathode side, these electrons flow from the current collector to the cathodic reaction zone, where reaction (2) takes place. The main processes within the fuel cell are drawn in Figure 4-8.
slice which can be considered the smallest non-repeating geometrical pattern, as reported in Figure 4-9. Accordingly, as better explained in Section 4.4.4., periodic boundary conditions have been set.
The presented model is based on the following assumptions:
1. steady state conditions;
2. ohmic losses within the current collectors are neglected;
3. laminar and incompressible flow in the flow channels
4. radiation heat exchange is neglected ;
5. the electrochemical reactions are confined to the electrode-electrolyte interface ;
Assumption 2 is justified by the high electrical conductivity of the current collectors, compared to those of the electrodes. Assumption 3 is justified by the fact that gas speed in SOFC gas channels is wherever very low [14] and the density variation is not related to compression [3] Radiation heat exchange between gas and solid can be neglected if compared to convective heat transfer phenomena, as shown in [15], while assumption 5 is due to the high ionic conductivity of the electrolyte compared to the electrodes, which reduces the ability of oxygen ions to migrate through the electrodes.
In Figure 4-10 a schematic representation of the different domains together with the governing equations is reported. The overall SOFC model consists of three sub-models:
- the fluid dynamic sub-model;
- the electrochemical and mass transfer sub-model;
17
2.4.1. Fluid dynamic sub-model
Gas Channels. The task of the gas channel is to uniformly deliver the gas on the electrode surface. The fuel flow in the gas channels is modeled applying the equation of state and the mass and momentum conservation principles, i.e..
(3) (4) → → → →
∇
+
−∇
=
∇
⋅
=
∇
u
p
u
u
u
20
µ
ρ
where →u
is the velocity vector, p the pressure, ρ and µ fluid density and viscosity, respectively. Since gases in SOFCs are far from the critic conditions, perfect gas equation of state is employed;Electrodes. Considering that the total pressure change within the electrodes is negligible (dp/dz ≈ 0), it is assumed that the mass transport through the porous media is driven only by diffusion [17].
2.4.2. Electrochemical sub-model
Mass balance
The electrochemical reaction ideal voltage depends on the reactants partial pressure at the triple phase boundaries through the Nernst law. The reactants concentration at the electrode/electrolyte interface (assumption 5) is evaluated through the species balance as follows:
(7)
c
iu
=
−∇
N
i+
R
i
∇
→ →where i denotes the generic i-th specie (hydrogen, oxygen or water), N is the molar diffusive flux, and R the volume specie source term.
Gas channels. The molar flux is mainly convective in the gas flow direction and diffusive from the channel to the porous media. The diffusive mass flux is modeled through the Fick’s law:
(8)
N
i=
−
D
ij+
R
i →where D
ij is the mass diffusion coefficient, which is calculated through the Fuller-Schettler-Gidding correlation:
where :
(10)
11
1
2
−
+
=
j i ijm
m
M
vi and miare the species Fuller diffusion volume and the molecular weight, respectively.
Electrodes. As discussed before, the molar flux is mainly diffusive [17]:
(11)
N
iD
aieffc
i → →∇
−
=
The diffusion coefficient in the porous medium is composed of a binary diffusion coefficient
D
aieffand of the Knudsen diffusion coefficientD
ikneff [16](12)
+
=
eff iKn eff ij eff aiD
D
D
1
1
1
where the binary diffusion coefficient depends on the porosity (ε), and tortuosity (τ):
(13)
D
ijeffD
ijτ
ε
=
and Knudsen diffusion coefficient can be calculated through [16]:
(14) i p eff iKn
m
T
r
D
97
τ
ε
=
Charge balanceElectrodes. Since the electrochemical reactions are considered to take place at electrode/electrolyte interface, only electron transport takes place in the electrode domain. The electric potential (scalar), φ, and the current density (vector), J, are related each other by the Ohm’s law:
(15)
σ
φ
→ →∇
−
=
J
where σ is the conductivity of the electrode. Charge conservation is coupled with expression (15) :
(16)
∇
=
0
→
J
Electrolyte. In this domain, no mass transport takes place, thus only the ionic potential and current density need to be calculated. Expressions (15) and (16), defined for the electrode, are employed also for modeling the ionic flux within the electrolyte.
19
Interface electrochemical reactionsElectrochemical reactions are specified here as boundary conditions at electrode-electrolyte interfaces for the balance equations (7) and (15). The local current density distribution is given by the Bulter-Volmer equation:
(17)
−
−
=
⋅
→ A ACT C ACTRT
F
RT
F
J
n
J
0exp
ϑ
η
exp
ϑ
η
where ϑi is the product of the number of transferred electrons in the single elementary rate-limiting step (ηBV) and the
charge-transfer coefficient (α), J
0 is the exchange current density, and
η
ACT is the activation overpotential. The two keyparameters are the charge-transfer coefficient and the exchange current density. The first ones are defined following the approach reported in [10] for a LMS cathode and a Ni/YSZ cermet anode. The exchange current density is expressed as a function of the local species partial pressure. A preliminary evaluation of different approaches has shown that the model proposed by Costamagna et al.[10] best interprets the cell behavior. The model proposed by Yamamura et al.[12] is considered to evaluate the anodic exchange current:
(18)
−
⋅
⋅
=
−RT
E
p
p
p
p
J
H H O actA A Aexp
5 . 0 2 2 0γ
The cathodic exchange current is defined according to the formulation reported in [13] :
(19)
−
⋅
=
RT
E
p
p
J
O actC C Cexp
25 . 0 2 0γ
The activation overpotential
η
ACT is calculated as the local difference between the relative electrode potential and the same value evaluated under ideal conditions.(20)
η
ACT=
(
φ
electrode−
φ
electrolyte)
−
V
id Vid is the reversible potential for the semi-electrochemical reactions (1) and (2), respectively:
(21) 2 2 ,
ln
2
H O H A idp
p
F
RT
V
=
(22) , 0,ln
(
2)
0.52
O T C idp
F
RT
E
V
=
+
Where: (23)F
G
E
T T2
, 0 , 0−
∆
=
TE
0, and∆
G
0,T are respectively the ideal potential and the Gibbs free energy at standard pressure p and temperature T, F is the Faraday constant and 2 are the electrons transferred. Finally, the Faraday’s law is used to evaluate the molar flux at the anode/electrolyte interface:(24)
=
−
=
F
J
N
F
J
N
A O H A H2
2
2 2and at the cathode/electrolyte interface: (25)
F
J
N
C O4
2−
=
Electrochemical sub-model solution algorithm
The electrochemical sub-model solution algorithm is based on charge conservation, which imposes the equality between anode/electrolyte and cathode/electrolyte interface consumption or formation of charge. This can be described by the anodic and cathodic current density J. Once assigned a test value to the Nernst voltage (species concentration at the TPB) and to the electrode potential (electric problem), the fluctuating electrolyte potential allows determining, in an iterative process, the local activation overpotential (Eq. 20). By this way the equality of the anodic and cathodic local current density is obtained. In Figure 4-11 a comprehensive representation of all the governing equations solving the electrochemical problem in the different domains together with the boundary conditions is reported.
2.4.3. Thermal sub-model
The thermal sub-model allows calculating the local temperature distribution, which affects the fuel cell performance by means of the electrochemical reaction rate, the electrode overpotential, the electrical and ionic conductivity and fluid properties.
Heat is generated inside the solid structure and is predominantly removed by convection heat transfer with the air and fuel flowing in the channels. Even if the operating temperature is high, we assume that radiation is negligible in comparison with the other heat transfer mechanisms [15].The temperature profile is obtained through the energy equation: (26)
c
vu
⋅
∇
T
=
−∇
q
+
Q
→ → →ρ
where q is the conductive heat flux, and Q is the ohmic heat source given by:
(27)
σ
φ
φ
→ →∇
∇
=
Q
The conductive heat flux is expressed by the Fourier’s law:
(28)
q
k
T
→∇
−
=
(
)
=
=
solids
k
k
channels
gas
k
k
s fFinally, the interface electrochemical reactions introduce the following boundary heat sources:
- reversible heat generation at the anode:
(29)
∆
=
F
J
S
T
q
rev2
- irreversible heat generation at both the anode and the cathode:
(30)
q
irr=
η
actJ
23
2.4.4. External boundary conditions
The external boundary conditions on V, T, c
i and →
u
are defined as follows:Inlet: Inlet conditions are defined by the operating conditions, summarized in Table 4-3
Lateral: Periodic conditions are considered on the lateral boundary as the analyzed geometry is the smallest non-repeating geometrical pattern of the whole cell (see Figure 4-9).
Top/bottom: No slip condition is imposed to the velocity field and as the SOFC ceramic support is considered at thermal equilibrium with the external furnace then giving a constant temperature value.
Outlet: Convective fluxes are considered at the cell outside. The convection and radiation heat exchange mechanisms between the solid structure and the external furnace are considered:
(31)
q
conv=
h
c(
T
f−
T
)
(32)q
rad=
f
σ
rad(
T
f4−
T
4)
where hC, f, and σrad are, respectively, the convective heat transfer coefficient, the total emissivity, and the Stefan–
Boltzmann constant. T
f is the furnace temperature. Furthermore, the combustion of the non-oxidized fuel mass as it
meets oxygen at the cell outlet provides another heat source.
Afterburning - The afterburning heat source is evaluated as follows:
(33)
(
)
anode i Out ng afterburniS
H
H
q
=
2−
Where: (34)=
−
F
I
H
H
out in2
2 2ρ
Therefore, on the polarization curve basis, starting from the knowledge of the total current and of H
2in, the afterburning
Inlet gas temperature – Inlet hydrogen temperature is directly available on the basis of the experimental measurements as a thermocouple is located close to the SOFC inlet. On the other hand, air inlet temperature is not measured. Accordingly, a 0D model has been developed. Air is delivered to the cathode from the external ambient through a pipe of 4 mm diameter and 9 cm length, embedded in the furnace. The air heating is evaluated through a simple 0D thermal balance that leads to [18]:
(35)
(
)
−
−
−
=
⋅ p c in f f outc
m
A
h
T
T
T
T
exp
where the thermo-physical properties are evaluated in function of temperature through an iterative way. Results are summarized in Table 4-2 and it is worth of noting that air reaches the equilibrium with the furnace at 800°C.
25
2.4.5. Solution technique
A finite element computational package, FEMLAB, is used to solve the described non-linear system of equation. A 3D unstructured triangular mesh is considered in the present calculations. The mesh is composed of 43785 elements and is sketched in Figure 4-14. The results have been checked for grid sensitivity and the trends are observed to be consistent in all the investigated cases in terms of polarization curve as the numerical results are included within a 3% of difference when increasing the grid detail level.
The iterative solution algorithm is reported in Figure 4-15. As it is possible to notice, even if the model sub-problems are fully coupled, to perform an efficient management of computer resources and to reduce the computational time, the numerical convergence is reached in an iterative way, called “frozen fields”. The electrochemical sub-model is firstly solved starting from a tentative velocity and a temperature profile, so evaluating species distribution and electrochemical quantities. These data are exchanged with the fluid dynamic sub-model and the thermal sub-model. This process is repeated until convergence is reached.
2.5. Model validation and results
This section presents the comparison between the numerical data provided by the 3D numerical code
and the experimental data of the single cell ASC1.
4.5.1. Model validation
As deeply discussed literature [10], the open-circuit voltage (OCV) calculated through the Nernst equation on the basis of experimental reactant concentrations is slightly higher than the experimental one. Therefore, the updating phase is started by imposing the experimental value of the open-circuit voltage (OCV). The difference between the experimental and calculated open circuit voltage is 7.8% and is kept as a constant for all of the calculations.
Then the numerical model has been updated on the basis of the experimental characteristic curve at constant fuel and oxidant flow rates (H
2=24 Nl/h; O2=12 Nl/h) so that different points along the curve correspond to different utilization
factors. In this phase the best performing species diffusion and current exchange formulations have been chosen. As already mentioned, the Fick’s law (Eq.11) and the Costamagna approach for the exchange current (Eq. 18 and 19) allowed to correctly predict the actual fuel cell operation. The adjustable parameters were the constants γA and γC in the
anodic and cathodic exchange current (Eq. 18 and 19) and the diffusion coefficients by means of the porous microstructure characteristics, it being understood that the tuning process has been performed by varying the parameters within literature values. The whole set of input parameters is reported in Table 4-4.
Figure 14 demonstrates that the experimental and numerical polarisation profiles are mostly coincident, as the difference between experimental and numerical cell total current is everywhere lower than 0.6A, so clearly indicating a proper updating phase. However this is not enough to declare that the developed numerical model is valid and reliable. To establish the range of validity and the accuracy of the code it is necessary, in fact, to verify that the numerical simulation allow to predict the fuel cell behaviour at different operating conditions, without changing the adjustable parameters values found in the updating phase.
27
Therefore, the code validation has been carried out by comparing numerical and experimental data varying both fuel flow rate and utilisation coefficient, defined as follows:t f
J
J
U
=
being J the actual current density (on the basis of the amount of reactants consumed) and J
t the theoretically expected
current density assuming that the overall reaction in the fuel cell is complete. Since each mole of hydrogen that reacts in the anode frees two moles of electrons, the fuel utilisation factor can be correlated to the inlet hydrogen flow rate as:
(
2
F
)
H
2J
U
f=
Using the inlet oxygen flow rate, the oxidant utilization coefficient:
(
4
F
)
O
2J
U
ox=
has been kept constant to 0.4 that ensure enough oxygen at the highest current density.
Figure 4-17 presents the comparison between numerical and experimental results for three current density-voltage curves with constant fuel and oxidant utilization coefficients (U
f = 0.3,0.4,0.5 and Uox = 0.4) and variable flow rates.
The agreement between numerical and experimental data is excellent in most cases. Larger differences can be observed at high current densities for U
numerical one. The percentage errors between numerical and experimental is everywhere within 5% and less than 2% for U
f=0.4, thus demonstrating a wide range of validity of the numerical code.
It is important to underline that the polarisation curves of Figure 4-17 used to validate the present code represent a hard and important benchmark test. Even if the characteristic curve of Figure 4-16 it is usually used to benchmark different cell types, in fact, it cannot be used to analyse cell performance like the increase in voltage internal losses. This happens because by increasing the current flow with fixed gas input, the cell is forced to work with increasing utilization factors, thus mixing the effects of fuel and losses on voltage variations. On the other hand, the performance analysis at constant fuel utilisation factor is of particular interest since it allows to quantify the portion of voltage decrease only due the increasing losses.
Moreover, the polarisation curves at constant fuel utilisation factor allow the identification of the cell optimal operating range. It is, in fact, worth of noting, that the curves linear theoretical slope is modified because of thermal effects at the higher current densities and because of humidification effects at the lower current densities. It is important to observe that for a current greater than 30 A the polarization effects become significant in comparison to the non reacted hydrogen afterburning effect. This heat source is quickly dispersed in the furnace, so producing only a remarkable edge effect. On the other hand, also the humidification effects can be highlighted, as they are strictly connected with the hydrogen velocity when enters in the hydrogen humidifier.
4.5.2. Analysis of results
Once validated the model, the advantages of a multidimensional numerical approach can be exploited observing the following maps.
Flow field: Flow field streamlines are reported in Figure 4-18. The presence of the ribs strongly affects the flow field. In fact, preferential flow directions can be observed along the x and y directions. In the central zone, due to the cell geometry, the flow is mostly broken so reducing the reactants feeding efficiency.
Species concentration: Hydrogen and oxygen concentration along the gas channels are reported in Figures 4-19. Highest values are located at the cell inlet, while a progressive O
2 and H2 concentration decreasing is observed moving to the
cell outlet.
In Figure 4-20 and 4-21, respectively, hydrogen and oxygen concentration at the electrode/electrolyte interface are shown. It is worth of noting that a lower concentration of the reacting species is observed under the ribs. This
29
phenomenon can be explained considering that the diffusion in the porous electrodes can be considered as the combinations of two effects:- cross-plane diffusion.
- in-plane diffusion .
Under the ribs the species diffusion in the direction orthogonal to the cell plan, i.e. cross-plane diffusion, is obviously impossible. Hence, the reactants concentration on the electrode/electrolyte interface locally decreases, so reducing the overall cell performance. The ribs effect is significant at any operating condition, but it becomes predominant at high fuel utilization.
For better accuracy, in Figure 4-22 and 4-23 a slice view of reactants concentration along the 0°, 22,5° and 45° angular direction is given. Moreover, comparing the figures, it can be observed that cross-plane and in-plane diffusion effects are more important at the cathode than at the anode because of the lower diffusivity.
31
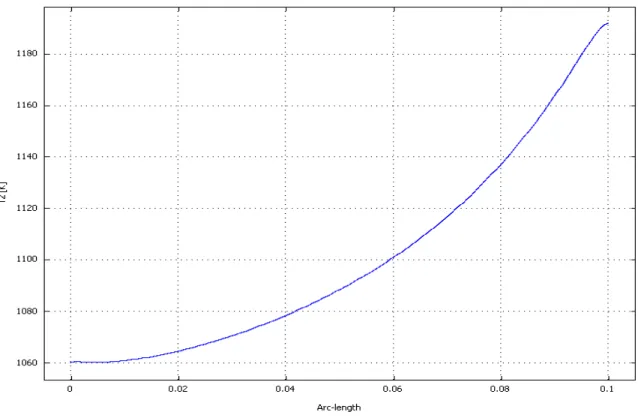
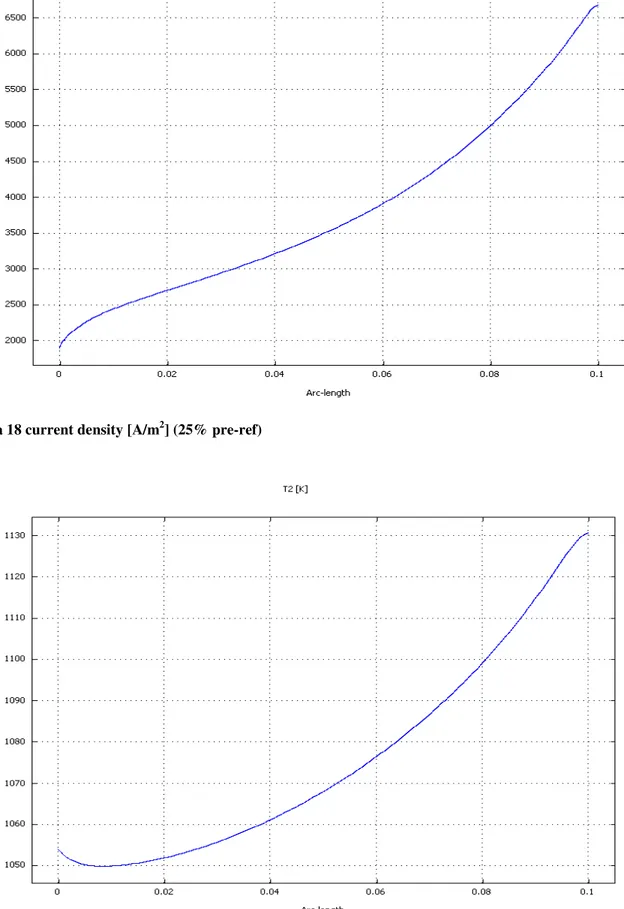
Current density: Figure 4-24 shows the current density distribution at the cathode/electrolyte interface. The current density is not uniform being affected by the hydrogen and oxygen distributions and by the electrolyte resistance which is, in turns dependent on the temperature. Because of the previously discussed reasons, under the ribs the produced current is smaller than elsewhere. Furthermore, around the ribs, it is possible to observe that the produced current is characterized by a local increase. This effect is related to the local flow deceleration which, in turn causes a local increase in the species concentrations together with greater species diffusion perpendicularly to the cell plane.Temperature distribution: In Figure 4-25 and 4-26 the temperature distribution at the cell middle plane is reported for two operating conditions. It can be seen that the fuel cell does not work at uniform temperature but a difference between maximum and minimum temperature of appreciatively 25°C is detectable. The highest temperature is located towards the cell outlet. This information is of primarily importance in SOFC as it allows getting information for thermally-induced stresses due to steady state thermal gradients.
33
Furthermore, the high is the overall temperature the higher is the current density. The temperature non-uniform distribution is enhanced by the non reacted hydrogen afterburning reaction. Comparing the two operating conditions, it can be observed that the temperature rise at the cell outlet is higher for lower current densities, that imply poorer reactants consumption and higher after-burn thermal flux.In the following tables, the cell operating parameters for the polarization curve and model input parameters found in the updating phase are summarized.
35
2.6 Using Syngas As Fuel
An attractive and practicable way of biomass utilization for energy production is gasification integrated with solid oxide fuel cell. This technology seems to have the possibility to reach high efficiencies based on a fundamentally clean and renewable fuel. Nowadays, the main interest of wood waste gasification is the production of syngas fuel (CO and H
2). Syngas is of particular interest if used as fuel in the high temperature fuel cell like SOFC. SOFC, in
fact, is a high temperature fuel cell in which CO can be directly used as fuel, because of the rapid electrode kinetics and the lower need for high catalytic activity. Accordingly, it offers fuel flexibility and high efficiency [9].
The great part of models in literature [16, 15, 2] suppose that only H
2 is oxidized at the anode while CO and/or CH4,
if existing, are respectively shifted and reformed to produce H
2. On the contrary, Khaleel [9] and Petruzzi [17], for
example, introduced the direct oxidation of the carbon monoxide using the parallel electrical circuit analogy. Petruzzi [17] adopted empirical correlations as reported by Achenbach [8] to estimate the anodic and cathodic polarization assuming a low activation polarization in addition of a neglected concentration polarization. Whereas Khaleel [9] used analytical expressions for activation and concentration polarizations, assuming the same concentration polarization for H
2–H2O and CO–CO2 systems to determine a relation between H2 and CO currents. Zhu [18]
elaborated a general mathematical model which accommodates arbitrary gas mixtures using iterative procedure to determine the pressure and concentration gradients.
The present study is the evolution of the hydrogen fed SOFC model, described in Chapter 4. The main objective of this work phase is to implement, in the hydrogen SOFC model, the chemical reactions occurring in the anode channel (i.e. water gas shift) and the direct oxidation of the carbon monoxide at the TPB. By this way, it is possible to predict SOFC performance when fed with pre-reformed fuel containing at least H
2 CO H2O, and CO2.
Like hydrogen fed SOFC model, the syngas fed one is applied on 3D domain, thus obtaining accurate results. In particular, it allows calculating the amount of current produced by CO oxidation and by H
2 oxidation. The
fluid-dynamics within the gas channel is again deeply analyzed, and temperature distribution is influenced by polarization effects, afterburning reactions and chemical reaction inside the fuel channel.
The lack of experimental data and literature reports about simultaneous oxidation of CO and H
2, prevents a rigorous
validation of this model. Some studies have to be still performed, but this work, whose results are compared with more than one experimental J-V curve, goes in that direction.
2.6.1 Experimental setup
Experimental J-V curves, obtained at University of Perugia testing laboratory, are shown in Figure 5-2. The SOFC apparatus described in detail in Section 4.2. and 4.3. is embedded in an electric furnace, which guarantees the desired fuel cell operating temperature. The electric load applied to the single cell is varied through the use of a potentiometer. Anodic and cathodic gas mixtures are obtained from laboratory-quality H
2, CO, CO2, O2, and N2
stored in gas cylinders outside the laboratory. The water content in the anode is varied through the use of a peristaltic pump, a water mass flow controller, and an evaporator apparatus. Mass flow controllers, electrical load, gas and furnace temperature are controlled through an in-house software realized in Visual Basic, and the results are stored in a dedicated file.
In Figure 5-2, the red line limits the region where experimental data are consistent, as better explain in Section 5.4.1.
2.6.2 Numerical model
For the single cell described in Section 5.2., a detailed numerical model was carried out. As discussed in Section 4.4., the set of mathematical equations describing the electrochemical and physical phenomena has been solved on a disk slice which can be considered the smallest non-repeating geometrical pattern (see Figure 4-9).
The single cell is again schematically considered to be composed of five domains, namely the flow channels (air and fuel), two porous electrodes (cathode and anode), and the electrolyte, as shown in Figure 5-3. The governing equations applied to each sub-domain have been directly solved applying appropriate interface conditions.
37
During SOFC operation, oxygen from the air channel diffuses through the porous cathode to the electrons, ions and gases three-phase boundaries where is reduced to oxygen ion (O
2-). In the present model the TPBs is regarded as an infinite thin layer between the electrode and the electrolyte interface.
(1) 2
+
2
−→
2−2
1
O
e
O
Oxygen ion is then transported to the anode/electrolyte interface through the ion-conducting electrolyte. Simultaneously, H
2 and/or CO fuel diffuses through the porous anode to the anode/electrolyte interface, where it is
oxidized electrochemically to produce H
2O and/or CO2.
(2)
H
2+
O
2−→
H
2O
+
2
e−(3)
CO
+
O
2−→
CO
2+
2
e−These products are then transported back to the fuel channel through the porous anode structure. The electrons released from reaction (2) and (3) flow from the reaction zone to the current collector, through the anode. At the cathode side, these electrons flow from the current collector to the cathodic reaction zone, where reaction (1) takes place.
As the fuel is syngas (H
2, H2O, CO, CO2) the water gas shift reactions take place within the anode gas channel as
follows:
(4)
CO
+
H
2O
→
CO
2+
H
2(
∆
H
WGSR=
−
41
kJ
/
mol
)
The presented model is based on the following assumptions: 1. steady state conditions;
2. ohmic losses within the current collectors are neglected; 3. laminar and incompressible flow in the flow channels 4. radiation heat exchange is neglected
5. the electrochemical reactions are confined to the electrode-electrolyte interface 6. the water gas shift reactions occur only at the fuel channel.
Assumption 2 is justified by the high electrical conductivity of the current collectors, compared to those of the electrodes. Assumption 3 is justified by the fact that gas speed in SOFC gas channels is wherever very low [9] and the density variation is not related to compression [1] Radiation heat exchange between gas and solid can be neglected if compared to convective heat transfer phenomena, as shown in [10], while assumption 5 is due to the high ionic conductivity of the electrolyte compared to the electrodes, which reduces the ability of oxygen ions to migrate through the electrodes. Due to the inlet syngas composition, reported in Table 5.1, and to the cell anode supported structure, in previous numerical tests it was found that the anode layer shift reactions are negligible in comparison whit fuel channel ones.
In Figure 5-4 a schematic representation of the different domains together with the governing equations is reported. The overall SOFC model consists of three sub-models:
- the fluid dynamic sub-model;
- the electrochemical and mass transfer sub-model; - the thermal sub-model.
2.6.3 Fluid dynamic sub-model
Gas Channels. The task of the gas channel is to uniformly deliver the gas on the electrode surface. The fuel flow in the gas channels is modeled applying the equation of state and the mass and momentum conservation principles, i.e..
39
(5) (6) → → → →∇
+
−∇
=
∇
⋅
=
∇
u
p
u
u
u
20
µ
ρ
where is the velocity vector, p the pressure, ρ and µfluid density and viscosity, respectively. Since gases in SOFCs are far from the critic conditions, perfect gas equation of state is employed
→
u
Electrodes. Considering that the total pressure change within the electrodes is negligible (dp/dz ≈ 0), it is assumed that the mass transport through the porous media is driven only by diffusion [12].
2.6.4. Electrochemical sub-model
Mass balance
The electrochemical reaction ideal voltage depends on the reactants partial pressure at the triple phase boundaries through the Nernst law. The reactants concentration at the electrode/electrolyte interface (assumption 5) is evaluated through the species balance as follows:
(9)
c
u
=
−∇
N
i+
R
i
∇
→ →where i denotes the generic i-th specie (H
2, H2O, CO, CO2, O2), N is the molar diffusive flux, and R the volume
specie source term.
Gas channels.
The molar flux is mainly convective in the gas flow direction and diffusive from the channel to the porous media. The diffusive mass flux is modeled through the Fick’s law:
(10)
N
iD
imc
i → →∇
−
=
where the mixture diffusion coefficient D
im takes into account of the diffusion of each species in the gas mixture. The
mixture diffusion coefficient of each species k, which derives from the Stefan–Maxwell relation, is calculated as [3]:
(11)
(
)
∑
≠−
=
i j j j i m iDi
y
y
D
,1
(12) where (13) 1
1
1
2
−
+
=
j i ijm
m
M
vi and mi are the Fuller diffusion volume and the molecular weight of the species i, respectively.
Electrodes. As discussed before, the molar flux is mainly diffusive [12]:
(14) i eff ai i
D
c
N
→ →∇
−
=
The diffusion coefficient in the porous medium is composed of a mixture diffusion coefficient and of the Knudsen diffusion coefficient
D
ikneff [11]
+
=
eff iKn eff ij eff aiD
D
D
1
1
1
where the binary diffusion coefficient depends on the porosity (ε), and tortuosity (τ):
ij eff ij
D
D
τ
ε
=
and Knudsen diffusion coefficient can be calculated through [11]:
i p eff iKn
m
T
r
D
97
τ
ε
=
Water-gas shift reaction (WGSR)
Since, in a SOFC, the shift reaction takes place at high temperatures, it can be assumed to occur very quickly and to be almost in equilibrium [14]. Lehnert et al. [14] reported experimental results for the forward velocity constants k
S +
and the backward velocity constants k
S -
for the chemical reactions at three different temperatures. Habeman and Young [15] developed empirical correlations for velocity constants with Arrhenius curve fitting technique using experimental data of Lehnert et al. [14] in the temperature range 900<T<1300K
.
The rate expression R
WGSR for shift reaction (reaction 4) can be defined as [13, 11]:
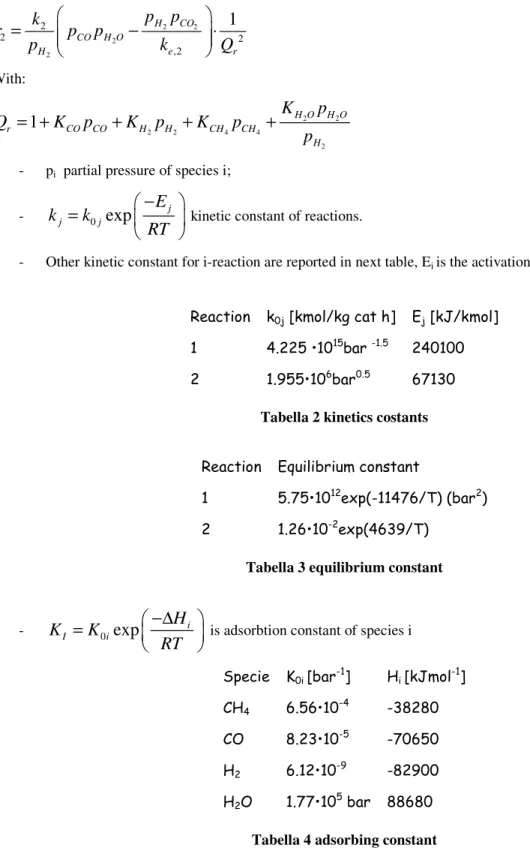
(18)

![Figura 15 current density [A/m 2 ] (35% pre-ref)](https://thumb-eu.123doks.com/thumbv2/123dokorg/7601093.114348/87.918.151.798.570.998/figura-current-density-m-pre-ref.webp)