MUSEUM LIGHTING
PhD thesis
In Energy and Environment
Faculty of Engineering
Dept of Astronautical Electrical and Energetic Engineering - DIAEE
MUSEUM LIGHTING: An holistic approach Dionysia Drakou Tutor Fabio Bisegna
“To play with light is to play with magic”
For my parents,
to my daughter
Abstract 2 Introduction 4
State of the Art 7
Historical development of museum lighting 7
the lux laws 8
damage of exposure 13
metrics 17
control of damage 26
Ongoing research 30
LED performance on Art 34
Energy-saving 34
Visual aspects 36
Color Quality Metrics 41
Towards ‘dynamic’ guidelines 44
Novelties in museum recommendations 47
Daylight 50
Climate-based daylight modeling 56
Daylight performance in museums 59
Lighting Quality 62
Visual perception 63
Visual performance 64
Metrics towards quality 68
Brightness-based lighting design 70
Luminance-based recommendations 73
Methodology 77
Daylight ‘filter’ zone in roadway tunnels 82
First study – Scale model 86
Second Study – Optimization of filtering 91
Third Study - Exploring the daylight simulation 96
CaseStudy: MIBAC - La Quadriennale Di Roma - 102
Conclusions 109 Appendix 110 Bibliography 115
Abstract
Among the environmental parameters that effect exhibited artifacts, light is the most complex and the only essential for the observer as to appreciate the artifacts, thus being one of the most critical variables of art exposure. Research on strategies for energy saving and the renovation of light destined to Heritage is examined by daylight admission and Light-Emitting Diode (LED) technology.
The extended review of the literature presented below, over museum lighting, evi-denced the parallel advance of lighting principles with lighting design, concerning what determines visual quality and perception. Lighting quality is an interdisciplin-ary field of research affecting human activity and under a requested task, visual performance, while at the same time improving well-being. In this sense, the role of the lighting designer is to match and rank human needs with economic and en-vironmental aspects as to architectural principles and to translate the results into a feasible design and an efficient installation.
Quality factors for art exposure, involving color fidelity and damage, along with visual perception necessitate of useful metrics through established criteria. The challenge for the museum for a holistic design of natural and artificial light is still missing of substantial metrics, even though recent findings provide some insight on the workflow to establish.
Luminance-based design metrics and contrast criteria are used in this study as key strategies for museum lighting, combining comfort and viewing fine arts through advanced computer rendering. The exploration of the transition inside a daylit
gal-Keywords: museum lighting, dosage, artificial lighting, holistic,
day-light, Climate-Based Daylight Modeling, workflow, visual perception,
road lighting, daylight filters
lery where moving in the museum environment offers an experience for a series of adaptation changes through photopic, mesopic and dark-adapted scotopic func-tion, along with change on the sensitivity of the spectrum.
The luminance appearance and the transition adaptation in the museum field lack of research examination; the relationship of prescriptive requirements and lumi-nance-based design has been explored initially in the field of road lighting, where the relative visual performance has been evidenced to be in the center of the CIE standard for tunnel lighting. Daylight simulation via climate-based modeling, intro-ducing daylight filters as solar shading devices, has been proposed as the object of experimental research, connecting light “filtering” with luminance; this workflow could be applied in several fields of research considering museum environment and give responses in the preservation of artwork involving daylight.
The subject of this thesis is the proposal of a ‘trama’ surface installed on windows to reduce and control daylight, studying how energy and conservation targets can be achieved. New light sources and smart control systems will integrate to a holistic approach for museum lighting design.
Introduction
Symbiosis between art, science and the strings connecting nature’s
geometry matrix with architectural design, has been the inspiration
for the research on the field of lighting as physical and aesthetical
phenomenon; lighting conditions and luminous quality are not
an-alyzed as targets, by means of recommendation standards, but as
results of both methodological and sensitive approach.
The symbiotic state of art and science above the major multidisciplinary fields con-sidering architecture issues has been broadly accepted as a crucial node of modern research and design, while recently, in the field of lighting design, gained a unique ally utilizing lighting simulations engines. Computer processing has made possible what used to be the result of difficult calculations or applied rules of thumbs, by rendering images of new spaces, now predicting illumination, lighting distribution and daylight control systems by modeling.
In this thesis the field of lighting design that has been chosen is the museum light-ing, representing an environment with significant complexity of real needs and pre-scriptive specification; minimize light damage by minimizing the energy absorbed by artifacts, to guaranty at the same time architectural integration, viewing, and circulation.
The lighting industry has been subjected to an unprecedented era of change, driv-en by changes in legislation and advances in lighting technology since Solid-state lighting won much acceptance for energy saving issues while improving and re-elaborating the majority of LED’s quality characteristics. Both of these factors offer attractive advantages for museums and galleries, in particular, the potential for consumption and maintenance costs.
The demands created by CIE 157:2004 publication of non-visible effects of expo-sure [1] shifted the focus of the illumination of artworks from illumination levels to total exposure over time, and reassessed energy use and reduction in museums as 4
a critical factor. Targets are expressed as recommended maximum annual lighting dosages, correlating display time with the expected life of light-sensitive materials and are quoted in lux hours of exposure. Widening adoption of dosage, as the pri-mary target for lighting conservation, provided both opportunities and challenges for curators, designers, and lighting specialists.
As far as exposure from artificial lighting, which in any terms can be easily con-trolled, dosages can be predicted or measured in an ongoing installation; a far more difficult task is related with daylight, which, up to this “holistic” evaluation, most museums ignore as earlier techniques did not permit it. Overpassing Gary Thomson’s preventive conservation recommendations on low levels of Daylight Factor [2], today’s targets to maximize building’s passive performance allows ar-chitects to introduce daylight again in the building envelope design, accomplish-ing prescription criteria for both energy and standards for museum environmental control.
Introduced by John Mardaljevic in CIBSE National Conference 2006 Climate-Based Daylight Modeling (CBDM) is a computer-based analysis of daylight in interiors that uses realistic sky and sun conditions to simulate the amount and distribution of light accurately. This type of modeling is founded on standardized climate files and is location specific. It enables the prediction of absolute values of illuminance and luminance and permits the calculation of cumulative periods of daylight levels to exceed or does not achieve user determined targets. Recent studies on damage limitation of light-sensitive materials in galleries through climate-based simulations show that a daylight exposure strategy could be undertaken. A similar workflow will be therefore analyzed as the basis for a techno-scientific approach that consists of the mathematical path of the current project.
Standard compliance of lighting an art gallery remains though part of a more com-plicated task that includes visual quality and non-objective sensations; curators often propose a museum route, telling a story, enhancing sentiments, creating contrasts and unexpected hierarchies. Lighting is mentioned as the key to viewing scenes and general visitor’s visual perception. Luminance and contrast are rarely considered from the designers and are poorly mentioned on guidelines. In this perspective, the research of luminance-based design metrics and contrast criteria as key strategies for museum lighting will be therefore analyzed as parameters
connected with comfort related to the viewing of fine arts. Advanced computer rendering provides the opportunity to an investigation of luminance distribution not neglecting daylight contribution; this permits a preliminary hypothesis of the relationship among background luminance and target contrast requirements for the perceived visual performance of a museum collection.
The relationship of prescriptive requirements and luminance-based design has been investigated in the field of road lighting where the relative visual performance has been evidenced to be in the center of the CIE standard for tunnel lighting. Daylight simulation via climate-based modeling has been explored, introducing daylight filters as solar shading devices, and has been the object of innovative re-search connecting light “filtering” with luminance. This workflow could be applied in several fields of research considering museum environment and give responses to the preservation of artwork involving daylight.
State of the Art
Historical development of
museum lighting
The environmental parameters that effect exhibited artifacts
consid-ered as a unique physical system that interacts and evolves through
time have been objects of scientific research in the different fields
of applied physics in the last centuries, defining and monitoring the
“museum micro-climate.” Among them, light exposure is arguably
the most complex and the only one that is essential to the observer
as to appreciate the cultural heritage making lighting one of the most
critical variables of art exposure.
Color fading is probably the most common indication of
light-in-duced damage to cultural heritage by photochemical effects and is
due to at least four main factors: the irradiance, the exposure time,
the spectral distribution of the light and the spectral response of the
exposed material. Depending on the nature of the exhibit the latter
factor and is by far the most difficult to determine [3]. Quantification
of fading rates and recommended techniques to slow deterioration
historically evolved into controlling illumination levels; discussion
though has been raised recently in different fields of lighting design
as lux recommendation maybe be limited for the complex task of
visual performance as a holistic approach.
the lux laws
The first modern scientific study of light damage is considered a series of experi-ments on the influence of light on watercolors published by Russell and Abney in 1888. Samples were exposed on Whatman Paper to mixed sunlight and equivalent daylight, simulating 480 years of exposure. They used the spectrophotometric de-scription of change stating the reciprocity law in its modern form meanwhile effects of light filtration have been reported [4]. In their investigations concluded that damage of exposure of blue and near violet bands of light is the most definitive; the exposure to various other parameters such as dry air, wet air, hydrogen, under vacuum, under colored glass, has been examined noting that fading presence of humidity and oxygen is, in general, essential for fading.
Bunsen and Roscoe previously in-troduced the concept of the pro-posed exposure reciprocity law for photochemical reactions in 1923; a property is directly dependent on its exposure dose, as the product of the irradiation intensity and expo-sure time, though independent of ir individual values of the. Deterio-ration factor in photography where the blackening of photographic film is only dependent on the exposure dose established the concept of the law.
Figure 1 plot of the transmission of daylight under the colored glasses of the roof
The application took place in many different fields since that time where incident radiation is used to generate a response; the law assumes that light intensity is pro-portional to the rate of the overall photochemically process and uniquely depend on the dose. While this is true for most primary photochemical processes (e.g., absorption) at reasonable light intensities, subsequent processes are not generally described by the same relationship. [5].
The law is expressed as:
H =
∫
tEe dt Wh / m ^ 2(
)
Where Ee is irradiance incident on the surface and t is time in hours (h)
For artificial light where Ee is constant the equation is H = E t
Based on the report of Russell and Abney, a worth to mention experiment took place in one of the top-lighted galleries in South Kensington Museum with the encouragement of Captain Abney. With the aim of modifying the light to render it harmless to watercolors, while still enabling them to be seen, the roof has been modified and in 1894 Raphael Cartoon Gallery was moved there, see Figure 18. The roof consisted of an equal number of alternate strips of green and orange glasses of the same size and below this composite, a lay light of colorless diffusing Mila-nese glass. The transmission curves of the glasses and the quality of the light mod-ified by the combined effect of them has been calculated for blue skylight and as shown in Figure 1the modification brings a progressive reduction in transmission below 500 nm which without any doubts has been a useful insight for preservation meanwhile flux was reduced by about 80% [6]. However, Abney’s conviction that the public did not notice the yellowish color of light was not real, raising critics and finally in1923 the Cartoons were removed to a space of the museum in luck of daylight.
Daylight illumination in the museums in the later nineteenth century was
predom-1Capt. W. de W. Abney was attached to the Science and Art Department of South
Kens-ington and an important figure in all matters treating on photography and its kindred sciences; for several years occupied the chair of the Physical Section of the British As-sociation.
inant, with the increasing need for artificial light being mostly provided by gas lighting and later by electric incandescent lamps; in the latter case, light radiation is emitted by heating at very high temperature when electric current flows through a wire filament. The naturally evolved perception of color in human beings and the continuous spectrum of the visible light by incandescent lamp have an optimum quality of color reproduction though it exhibits a shift towards the red range of the radiation spectrum. This inclination, with its maximum radiation lying in the infra-red range of the spectrum while decreasing toward the blue wavelengths, makes typical incandescent bulbs comparatively as low potential for damage, hardly pos-sessing any radiation component in the UV range, a fact that accounted for their vast popularity and wide dissemination in museums [7].
The first recommendations for museum light intensity appeared in the July 1930 issue of Burlington Magazine; Robert L. Feller presented thirteen sets of recom-mendations for low, medium and high illumination levels in average 57, 142 and 258 lux, respectively. His laboratory focused on building up the foundations of preventive conservation science using a clear research base in the paint and textile industries, which continued for several years and Unesco published a complete vol-ume of his work in 1964. An extensive review of recent literature of photochemical deterioration was included and among his recommendations, the concept of total annual exposure for the first time appeared as seen Figure 2 as a consequence of the Bunsen-Roscoe law.
Close to Feller’s recommendations for illuminance levels, Garry Thomson publishes The Museum Environment, perhaps the first complete guide to preventive con-servation, presenting in detail lighting recommendations. His suggestion of spec-ifying the limit values governing illuminance for paintings at 150–200 lux and for graphical objects at 50 lux has been globally accepted. Moreover, objects that are light sensitive should only be illuminated as long as the actual opening times of an exhibition requires [8].
During the 1970s, preservation advantages of incandescence have been slowly abandoned in favor of the coated fluorescent tubes with a significant economic benefit. Meantime, the effects of UV radiation on fugitive and permanent colors were determined, and industrial fading-standards became widely accepted in ex-posure studies in the paint industry and were later adopted in conservation re-search. Already in 1956 ICOM publication has investigated the deleterious effects of the discharge lamps that emit mainly in UV range but enriched of fluorescent substances convert radiation into visible light. The plurality of choices as for size, 10
color of light, and color reproduction, and the four to eight times higher output than that of an incandescent lamp with the same wattage have established their use against the technological disadvantages involved [7]; discontinuous spectrum instead to special products, not suitable to create clear-cut shadows, UV compo-nent and as result screening measures to reduce it.
In the following decades the scientific studies continiued and a summary of vital points gathered from a variety of publications is given below [7] [9]:
• high moisture rate accelerates fading of natural coloring agents;
• color changes are not constant concerning speed; they are more marked with unexposed material than with material that has already suffered light-induced
Figure 2 Recommended light levels and annual exposure [11]
damage;
• the yellowing and fading of the paper are both possible phenomena, depend-ing on the temperature involved.
Since these insights, actions have been taken on board in museums with instruc-tions for exhibition recommendainstruc-tions. The research of both Feller and Thomson led to the prescription of rules or “lux laws” and prohibitions on ultraviolet and infrared radiation. Concepts of risk management will only appear later parallel to a more in-depth investigation of the parameters of preventive conservation and the control of the museum environment as a unique system.
damage of exposure
Light is radiant energy, and exposure to both artificial and natural light gradually causes permanent damage to many museum objects. Indeed, most organic and many inorganic substances change with time and with light action, as can be ap-preciated in processes in nature. The absorbed energy of the exposed material can promote two distinctly different processes; radiant heating and photochemical reaction. In the first case, temperature rises at the surface of the exposed material as a consequence the surface of the object expands relativly to the body, causing surface cracking, lifting of surface layers, and loss of color. The symptoms of photo-chemical action can be similar, but the process is entirely different and often more severe: chemical change occurs when a molecule irreversibly changes its structure, this may include fading or darkening of colors, yellowing, loss of strength, fraying of fabrics, and even dramatic color changes of some pigments [10].
Photochemical reaction is triggered by photons traveling as steam by the radiant flux which includes ultraviolet (UV), visible and infrared (IR) wavebands. Their ener-gy level is directly proportional to frequency and expressed as:
E = hv Joule
(
)
where h is Planck’s number h = 6,626 x 10−34 Js , a number that relates units of fre-quency to energy and v is frefre-quency (hz) which is inversely proportional to wave-length λ so the equation could be expressed:
E = h c
( )
/ λwhere c is the velocity of light in vacuum, showing that short wavelength luminous flux, i.e., blue light has higher photon energy making ultraviolet radiation, wave-lengths under 400 nm, responsible for the reaction.
After the Second World War, the concerns of screening light destined to sensi-tive cultural assets were the subject of extensive investigations: in the USA the National Bureau of Standards (NBS), examined systematically light in a variety of wavelengths and scrutinized protection methodology. During the course of these tests, the Relative Damage Factor Dλ
( )
was defined for the first time based on Harri-son’s computational method [11] with the intent to compare damage protentional of alternative light sources and filter combinations. The factor could thereby be used to determine a Damage Index DI for incident radiation:DI = F _ dm,rel
(
)
/ F _ v,rel( )
The relative damage flux is given by:Fdm,rel=
∫
λΦ λ( )
T λ( )
D λ( )
d λ( )
where Φ λ
( )
is the spectral radiant power, T λ( )
spectral transmittance of the filter, D λ( )
is damage function and( )
λ the wavelength and the relative luminous flux:Fv,rel=
∫
λΦ λ( )
T λ( )
V λ( )
d λ( )
where is the spectral luminous efficiency of photopic vision.Although Harrison’s observations where interesting and other authors recognized the effectiveness of the index [8] [11], his proposal failed to gain the scientists’ community acceptance. Later will be evidence that the index is a simple logarithmic function with a slope of -1,25 log D λ
( )
units per 100 nm of wavelength [12]. Changes in color observed in materials illuminated by fluorescent tubes was ex-amined in 1983 at the University of Applied Sciences in Berlin by the Institute of Lighting Technology. During the study the term ‘relative spectral sensitivity’ s λ( )dm,rel
was introduced to define the response of a material to monochromatic light as a function of wavelength and made meaningfully interpreted the many insights gained from the study of artificial exposure [7] expressed by:
s λ
( )
dm,rel= a λ( )
λ1 f λ( )
where a λ
( )
is the spectral absorptance and f λ( )
a function determined by there-ceiving material.
The principle of this model is that firstly energy has to be absorbed to cause dam-age; secondly, the photochemical response is related to the photon energy level which is proportional to the reciprocal of wavelength; and lastly, a function of wave-14
length will be determined by the inherent properties of the material. For a given wavelength absorptance is described by:
α λ
( )
= 1− ρ λ⎡⎣( )
+τ λ( )
⎤⎦where ρ λ
( )
and τ λ( )
are spectral reflectance and transmittance, respectively.The deterioration studies of Feller [11] also involved the radiant heating effect when surface temperature rises above environment temperature due to absorption of in-cident radiant flux putting in evidence that the maximum attainable temperature of an irradiated object is defined as:
Tmax= Ta + kAEe
hc
where Ta is ambient temperature, k is a proportionality constant A is the
absorp-tance of the object Ee is irradiance in (W/m2) and hc a coefficient of convention
heat loss.
As described the rise of temperature on the surface of an object above ambient temperature is proportional to irradi-ance and independent of an object’s thermal capacity, density or thickness. The effects may be of smaller evidence that those of photochemical damage but still relevant to dimension change and deformation with particular stress when materials of different coefficients of expansion are in contact. Moreover, relative humidity variations cause the migration of moisture. The result of heating cause hardening, discoloration, and cracking. Damage is particularly likely in materials that are hygroscopic such as organic materials or where the surface clusters layers of dissimilar materials, such as varnish over pigment, or pigment over a substrate. IR radiant flux is apparently associated with incandescent lamps, even if their UV content is lower than for most other types of lighting.
Given the three distinct bands of radiation, light, ultraviolet, and infrared the
signif-Figure 3 Harrison’s damage function D λ
( )
icant general deterioration could be organized as follows [13]:
• Light fades: colors that fade can disappear even in some hours of direct day-light, or just a few years under low level of museum lighting. Among the materials that do not fade, some may last centuries in direct sunshine like Minoan frescoes. All colored objects fall somewhere between these two extremes.
• Ultraviolet causes yellowing, chalking, weakening, as also disintegration of ma-terials. Chalking of paint media is often mistaken for pigment fading.
• Infrared heats the surface of objects, and thus becomes a form of incorrect tem-perature, with all the damage possibilities outlined.
Nonetheless, relating light exposure to damage led museum professionals to de-fine reliable measures of damage and this way prevent deterioration.
metrics
ASTM Description
I Excellent lightfastness. Blue wool #7-#8, unchanged pigment for more than 100 years
II Very good lightfastness. Blue wool# 6, unchanged pigment for 50 to 100 years III Fair lightfastness (Impermanent). Blue wool #4-#5, unchanged pigment for
15 to 50 years
IV Poor lightfastness (Fugitive). Blue wool #2-#3, the pigment begins to fade in 2 to 15 years
V Very poor lightfastness (Fugitive). Blue wool #1, the pigment begins to fade in 2 years or less
Table 1 ASTM lightfastness categories as described by Colby [14]
Recommendations to reduce light damage of color fading by Ultraviolet (UV) radi-ation and potentially reduce or introduce daylight in galleries have been described in Blue Wool Scale that measures and calibrates the permanence of coloring dyes. Initially, Blue Wool cards where used by the textile industry and later adopted by the printing industry as a comparison to “lightfastness” quality of ink colorants. Described as lightfastness the chemical stability of the pigment or dye under pro-longed exposure to light is primarily used today also in the polymer industry for measurement of pigment and color stability.
The comparison takes place with two identical dye or pigment samples where one is placed in the dark, and the other is exposed to sunlight, or equivalent, for three months. The by comparison to the original color and the amount of fading is mea-sured, and a rating between 0 and 8 is awarded. A score of eight #8 is supposed not to have been altered from the original and thus credited as being lightfast while zero #0 denotes extremely poor colorfastness.
Described by Colby K. [14] for Montreal Museum of Fine Arts in 1991 a policy for fine arts that associates Blue Wool scale to fastness levels, from #1_fugitive to #8_extremely lightfast, designating the amount of light exposure required to pro-duce a color change at each level and the approximate match between the eight blue wool and five ASTM lightfastness categories shown in Table 1. This table is a guide for the selection of artist paints though the relationship with exposure hours is a primarily accepted applied rule. Exposure to average indirect indoor lighting - 120 to 180 lux- for an average of 12 hours a day equals from 0.53 to 0.79 megalux hours each year.
Another approach to convert Blue Wool rating scales into an estimated time of light exposure that will cause just noticeable fading is provided by the Canadian Conservation Institute - CCI, based on Michalski’s report of 1987 [9] and shown in Table 2.
The exposure is considered for a daily period of eight hours, and the year for 3,000 hours. By this means “just noticeable fade” is given as a range based on the doses for the range of ISO Blue Wools in the same sensitivity category. The “almost total fade” is based on a conservative estimate of 30 per the “just noticeable fade,” al-though fading often slows down, so that an estimate of 100 per, the just noticeable fade, is probable for many colors.
ISO Blue Wool numbers are the main route into the literature on colorant sensi-tivity; in museum lighting, though the categorization of typical materials by the “useful lifetime” gained wider acceptance and replaced the practice of assessing the light-sensitivity of objects by simple comparison to them.
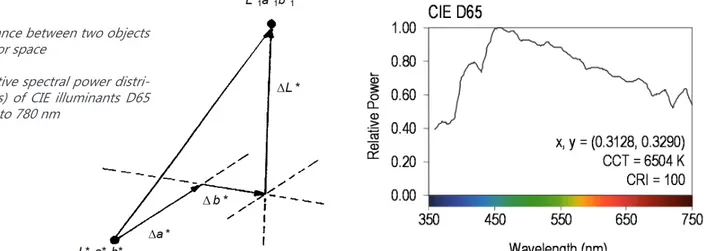
Figure 4 Distance between two objects in CIELAB color space
Figure 5 Relative spectral power distri-butions (SPDs) of CIE illuminants D65 from 380 nm to 780 nm
High-Sensitivity
Blue Wool #1,#2,#3 Medium- SensitivityBlue Wool #4,#5,#6 Low sensitivity Blue Wool #7,#8 Exposure Amount Fade Amount Time in years for
fad-ing
50 lux Just noticeable fade 1.5 – 20 years 20 – 700 years 300 – 7000 years Almost total fade 50 – 600 years 700 – 20,000 years 10,000 – 200,000 years 150 lux Just noticeable fade 1/2 – 7years 7 – 200 years 100 – 2,000 years
Almost total fade 15 – 200 years 200 – 7,000 years 3,000 – 70,000 years 500 lux office Just noticeable fade 1/7 – 2 years 2 – 70 years 30 – 700 years
Almost total fade 5 – 60 years 70 – 2,000 years 1,000 – 20,000 years 5,000 lux window
or study lamp Just noticeable fade 5 days – 2 months 2 months – 7 3 – 70 years Almost total fade 6 months – 6 years 7 – 200 years 100 – 2,000 years 30,000 lux av.
daylight Just noticeable fade 1 day – 2 weeks 2 weeks – 1 year 6 months – 10 years Almost total fade 1 month – 1 year 1 – 30 years 20 – 300 years Table 2 Blue Wool conversion by CCI [13]
Some materials still don’t fade but show yellowing or become darker or change the hue. As to record these changes, modern testing uses color measurement in-struments, such as colorimeters and spectrophotometers, that can detect differ-ences indiscernible to the human eye and then instantly display these differdiffer-ences in numerical terms. With the definition, color difference is described the numerical comparison of a sample’s color to the standard that indicates the differences in absolute color coordinates and is referred to as Delta (Δ). The color differences between sample and standard color are calculated using the resulting colorimetric values expressed by L*a*b* CIELAB values the most common color space color ap-plied in cultural heritage according to CIE 15:2004 Colorimetry Report. It has been modeled over a color-opponent theory which stated that two colors could not be simultaneously red and green or yellow and blue.
The system defines a three-dimensional color space within which col-or characteristics of a material are specified concerning lightness di-mension L*, and two chromatic didi-mensions a* is the red/green coor-dinate, and b* is the yellow/blue coordinate. To determine the total color difference between the three coordinates, the following formula is used:
ΔE* = ΔL*
( )
2 + Δa*( )
2 + Δb*( )
2Deltas for L* (ΔL*), a* (Δa*) and b* (Δb*) may be positive (+) or negative (-). The total difference, Delta E (ΔE*), is, however, always positive.
ΔL* = L*1 - L*0 , difference in lightness and darkness Δa* = a*1 - a*0 , difference in red and green Δb* = b*1 - b*0 , difference in yellow and blue
As to communicate the colorimetric data of material samples an illuminant has to be defined; to this scope in 1931 the International Commission on Illumination (CIE) standardized three illuminants1: Illuminants A, B, and C, where illuminant A, CIE standard illuminant A2, was defined as a Planckian radiator of correlated color tem-perature 2848 K, later 2856 K, resembling the emission color of a tungsten filament source. Illuminant B was thought to represent direct sunlight, then abandoned, and illuminant C average daylight. A series of daylight illuminants were accepted in 1967 by CIE that suggested the use of one with an approximate correlated color
Figure 6 The output parameters from the model include Lightness (J), Bright-ness (Q), RedBright-ness–GreenBright-ness (a), Yel-lowness–Blueness (b), Colorfulness (M), Chroma (C), Saturation (s), Hue compo-sition (H), and Hue angle (h).
temperature of 6504 K, CIE standard illuminant D65, as the most representative of the spectral power distribution (SPD) of daylight. The daylight illuminants were designed to resemble outdoor sunlight, and thus differed from illuminant C in the ultraviolet (UV) part of the spectrum considerably. Later investigations made by Gombos et al. [15] point the need of different standard illuminants for general colorimetric and graphic use though it represents the most common reference. The definition of the CIELAB system has been of fundamental importance towards the exploration of progressive color change due to light exposure. Different color spaces have been used since but until the present worldwide literature is focused on CIELAB values. Nevertheless, some authors exploited the later model, CIECAM02 [16] for spectral distribution studies that have been shown to be a plausible model of neural activity in the primary visual cortex, compared to the earlier CIELAB mod-el, and aims to model the human perception of color [17].
While the CIE system has been applied for over 70 years, its use is limited un-der only few viewing conditions, i.e., daylight illuminant, high luminance level, and some standardized viewing/illuminating geometries; industrial practice with small color differences have shown non-uniform effects with calculated values in differ-ent ranges and differdiffer-ent directions in those spaces. Moreover, a change of external observing conditions may change the perceived magnitude of the color difference in a sample pair [18]. The CIEDE2000 total color difference formula corrects the non-uniformity of the CIELAB color space for small color differences under refer-ence conditions; improvements have been made through corrections for the effects of lightness dependence, chroma dependence, hue dependence and hue-chroma interaction on perceived color difference.
Figure 7 Summary of studies reporting the light exposure required to fade the ISO standards and some colored ma-terial. The exposure shown (on the top scale) will give a just noticeable fade (GS 4); for a complete fade multiply ex-posure by ten [9]
In the decades between the 1970s–1980s a group of researchers investigated the previous work for National Bureau of Standards (NBS) and a broad range of light-sensitive materials have been used to reconfirm damage. The results evi-denced damage per radiant unit of light exposure increased with a decrease in wavelength for photochemically stable materials, as rag paper, oil on canvas, tex-tiles, and watercolors on rag paper, but to low-grade paper, the rate was much slower. Saunders and Kirby in the 1990s produce follow-up work to confirm again that shorter wavelengths are potentially more harmful than long wavelengths. They also observed that higher is the reflectance value less the damage since less radi-ant energy is absorbed in this region. The studies have been later elaborated and published by Cuttle in 1996 [19] and were finally embodied within the Commission Internationale de l ́Eclairage (CIE)157 Report, Control of Damage to Museum Ob-jects by Optical Radiation.
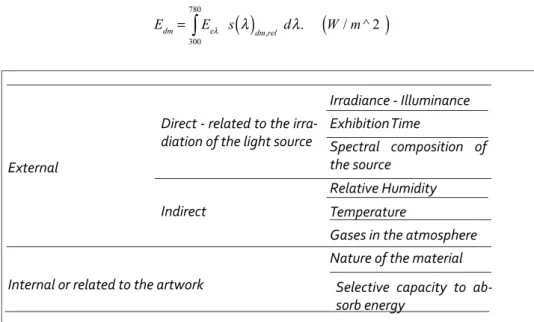
External
Direct - related to the irra-diation of the light source
Irradiance - Illuminance Exhibition Time Spectral composition of the source Indirect Relative Humidity Temperature
Gases in the atmosphere Internal or related to the artwork
Nature of the material Selective capacity to ab-sorb energy
Table 3 Deterioration factors in artwork objects
The CIE157defined a model to evaluate damage due to optical radiation by de-termining the damage suffered by an object exposed to light DM as a function of the effective radiant exposure H, dm which is the effective irradiance over time Edm
DM = f H,dm= f E
(
dm, t)
Effective irradiance Edm that causes damage to an object taking account of the
spectrum of incident radiation and the relative spectral response of the receiving material is defined according to the formula:
Edm= 300 780
∫
Eeλ s λ( )
dm,rel dλ. W / m ^ 2(
)
where Eeλ is spectral irradiance and represents the amount of energy per
wave-length emitted by a light source, sdm,rel
( )
λ the relative spectral sensitivity and dλ thewavelength.
These factors may be used to define the threshold exposure or critical radiation time , defining the time after which starts the risk of visible damage:
ts= Hs,dm
Edm h
( )
where threshold radiation Hs, dm describes the amount of radiation energy that must
act on an object until a visible color change occurs ΔE* = 1 .
The potential damage Pdm is the fixed proportion between effective irradiance Edm
and irradiance E valid for a material under a given lighting condition [7]:
P
dm=
E
dmE
Pdmremains constant at different illuminance levels which makes it a factor well
suit-ed to describe the potential risk possuit-ed by a lighting source; higher value indicates more potential to damage.
In Figure 8 is plotted the basis of the Berlin model where the cause of damage is the effective radiant exposure, shown on the horizontal scale, and the effect is the
Figure 8 The cause of damage Hdm and the effect according to Berlin model. Figure 9 The spectral distribution of the logarithm of threshold effective radiant exposure [19]
change of color, shown on the vertical scale. When the material is first exposed the curve is steep and the effect rapid, so that it requires only a relatively small level of
Hs,dm to cause one unit of ΔE*ab to occur, but as damage continues the density of
susceptible molecules reduces, so that greater exposure is required to produce the same visible effect. Eventually, the material stabilizes, and no more color change occurs [1].
The responsivity of any material is defined by its threshold effective radiant expo-sure Hs,dm and its spectral responsivity s λ
( )dm,rel
, which is decisive for the object’scolor and can be obtained via an exponential function. The normalized value of the function is 1 at a wavelength of 300 nm, as radiation below this wavelength limit very rarely occurs in museum lighting involving daylight or artificial light. The sequence of the function is described by material constant b, which determines a material’s specific spectral absorptance shown in table 4 gives a summary of the material-dependent parameters for a variety of materials.
The values were based on investigations carried out at the Berlin Institute of Tech-nology in 1983 by Aydinli. According to this model, s λ
( )
can be expressed as:s λ
( )
= exp −b λ − λ0⎡⎣(
)
⎤⎦This function is normalized at a wavelength of λ0 =300nm; sample materials have been classified in five categories and values of Hs, dm , and b are given in table 4
showing the exposure required to cause a just noticeable color change for an in-cident monochromatic radiation of 300 nm. The action spectrum is the response of the material to each wavelength of light, which indicates the wavelength de-pendence of degradation; exposure under other wavelengths and the respectively threshold required exposures are plotted in logarithmic scale in Figure 9.
Group Material Hs,dm [Wh/m2] Material constant b a Low-grade paper 5 0.038 b Rag paper 1200 0.0125
c Oil paint on canvas 850 0.0115
d Textiles 290 0.0100
e Water colors on rag paper 175 0.0115
Table 4 threshold effective radiant exposure Hs,dm and b values for the relative
control of damage
Moreover, the CIE report produced a classification of deteriorating factors in mu-seums, shown in Table 3, among them, a first group can be divided into direct and indirect factors. Direct factors are irradiance and spectral composition of the light source and the overall exposure time of it meanwhile as indirect factors are considered the relative humidity, temperature and the number of gases in the at-mosphere. Among the second group, it can be included: the nature of the material and its selective capacity to absorb energy, i.e. the spectral responsivity. The overall tendency of spectral responsivity to increase in shorter wavelengths is documented and an association of relative damage potential and the correlated color tempera-ture of the source has been investigated by Cuttle [12].
In the following table 5 a summary of values of the relative potential damage rang-ing from 3000°K to 6000°K representrang-ing various full spectrum light sources. As to simplify the comparison, values were normalized based on an assignment of a value of 1.0 for Standard illuminant A (2856°K) and all wavelengths below 400 nm were excluded.
Another issue mentioned relative to the source, and the damage potential of the museum light sources is their spectral power distribution. Continues spectra sourc-es and a high color index, efficiently rsourc-esponded by an incandsourc-escent lamp, has been traditionally employed by curators, but already in 2004, the CIE report states the implications of reduced damage by LED “tuned spectrum” where the Ra should not be relied upon to compare “good” sources. The experimental study of Cuttle tested the hypothesis that an art object illuminated by a light source comprising three narrow wavebands of light can match the level of viewing satisfaction given by a conventional tungsten halogen display lamp providing the same illuminance [20]. 26
According to the normative, materials of cultural property are grouped into four classes of responsivity to luminous exposure and the relationship with ISO rating based in Blue Wool Standard is previously seen in Table 6. The indications to relate pigments to ISO rating and referenced estimation of probable fading are based on the observations of Michalski [9]. Likewise, two different UV-dosage categories are classified: one is ‘UV rich’ referring to a spectrum similar to daylight through glass; this spectrum is generally used for the lightfastness data as to derive the light responsivity of a colorant. The other ‘no UV’ means a UV-blocked light source. Es-timates indicate a minor benefit of a UV-blocked light source for high responsivity colorants but substantial improvements for low responsivity colorants [21].
Color Temperature of a Planckian source Relative Damage Potential D series source Relative Damage Potential 2500 K 0.92 D55 1,63 3000 K 1.04 D65 1,87 3500 K 1,20 D75 2,07 4000 K 1.37 5000 K 1.71 6000 K 2.01
Table 5 Damage Potential relative to CIE Standard illuminant A (2856 K) where b=0,0115 for a Plankian source and three D series sources [1]
For each class, a limit in the cumulative annual luminous exposure ALE, measured in lux-hours per year, i.e. lx h a-1 has been established [22]. This threshold is calcu-lated as a product of the allowed instantaneous illuminance level (measured in lux, i.e., lx) and the total annual exposure time AET, measured in hours per year, i.e., h a-1. As the cumulative effect is the main factor, ALE should be respected, while it is possible to increase illuminance level if the AET is adequately reduced, leaving unchanged their product. Material responsivity classes are as follows:
1. Irresponsive, e.g., most metals, stone, most glass, ceramic, enamel, most minerals;
2. Low responsivity, e.g., most oil and tempera painting, fresco, undyed leather and wood, horn, bone, ivory, lacquer and some plastics;
3. Medium responsivity, e.g., most textiles, watercolors, pastels, prints and drawings, manuscripts, miniatures, paintings in distemper media, wallpaper
and most natural history objects, including botanical specimens, fur;
4. High responsivity, e.g., silk, highly fugitive colorants, most graphic art, and photographic documents.
The “Mlx h for noticeable fade” data given in Table 6 indicates the illuminance re-lated to the light-fastness category of the most susceptible pigment present. As an example consider a medium responsivity material with an ISO rating of 5 perma-nently on display (3000 hours per year), where the illuminance is 50 lux and UV is eliminated. The annual exposure would be therefore calculated as 3000 hours x 50 lux = 150 kilolux hours/yearIn, indicates that after 30 megalux hours of exposure a noticeable fading will occur approximately after 30000/150 = 200 years of display. Another example assuming a highly responsive material with an ISO 2 rating placed in the same display situation. Probable fading will occur after one megalux hour of exposure approximately after 1000/150 = 6,7 years. That has been the reason that a “highly responsive” category has been included, and it is recommended that materials in this category are not placed on permanent display [1].
The report refers to a series of acknowledgments for museum lighting installa-tions such us control of environmental condiinstalla-tions, classify zones for locating highly responsive objects, protect from both IR and UV radiation, recommendations on electronic flash usage, spectrum choice and correlated temperature of the sources and lastly as the most practical to measure exposure rate illuminance levels. Lighting level of 200 lx is generally sufficient to provide adequate visibility and satisfy exhibition needs. When illuminance below 200 lx is required, visibility of the exhibit can be enhanced by lighting the background to a lower level; therefore visual adaptation will reduce making the exhibition the brightest part of the field of view the ratio 3:1 has been suggested by Loe et al. [23] for object illuminance to background illuminance.
High responsivity Medium responsivity Low responsivity Irresponsive
ASTM V IV III II I
ISO Blue Wool Category #1 #2 #3 #4 #5 #6 #7 #8 >#8 -Mlx h for noticeable fade
UV rich 0.22 0.6 1.5 3.5 8 20 50 120 -
-Probable Mlx h for
notice-able fade if no UV 0.3 1 3 10 30 100 300 1000 - -Table 6 Relationship of sensitivity categories, ASTM, Blue Wool and recommended annual exposure [13, 1]
1 2 3 4
Irresponsive Low responsivity Medium responsivity High responsivity ALE - 600,000 lx h a-1 150,000 lx h a-1 15,000 lx h a-1
illuminance - 200lx 50lx 50lx
AET - 3000 h a-1 3000 h a-1 1300 h a-1
Table 7 Limiting illuminance (lux) and limiting annual exposure (lux hours per year) [1]
Satisfactory viewing could be achieved for medium responsivity material with less than 50 lx if the object is colored lightly and with no fine detail yet the limiting il-luminance should never be quoted as the justification for unsatisfactory display. It is not considered good policy to display an object, that inevitably will suffer some damage, and to fail to present it adequately. If an illuminance greater than 50 lx is found to be necessary to provide accurate appearance, even in the case light-sen-sitive objects, the duration of the display should be restricted to comply with the limiting exposure value according to Table 7 result of extended research on the recommendations expressed by various authorities.
Ongoing research
As previously described, see Table 3, the latest parameters to control damage are related to the plurality of materials a factor that historically made spectral respon-sivity a rarely used parameter to define risk of damage. Nonetheless to give insight to a proper museum lighting given the difficulty to determine it in the whole of an exposition; optimization of the spectrum as well. Control of damage and the conservation status of cultural heritage, especially in the case of paintings could though be evaluated by spectral reflectance. Indeed, spectral data are useful for pigment identification, especially when a database of frequently used pigments is available. The data are then used for physical characterization, forensic work, light-ing purposes, and others. Even in areas where colors appear similar to the naked eye, the spectral curves can show differences because metameric effects can occur [24].
Figure 10 CIE spectral damage potential (Sdf) versus CRI [28]
Currently, multispectral analysis of each specimen is becoming a standard tech-nique by image mapping proposing new insights to illumination degrade. Com-pared to colorimetric imaging, multispectral imaging has the advantage of retriev-ing the spectral reflectance factor of each pixel of a paintretriev-ing; with this information, the spectrum becomes decomposed into its original pigments and their relative contributions. The output of pigment mapping is a collection of spatial concentra-tion maps of the pigments classified in the painting [25]. Such an approach could evidence useful information to design customized lighting systems based on spe-cific damage analyses and optimization of the spectral distribution, a case that with LED technology becomes somewhat simplified when a multispectral mapping is applied.
New technology is, in this regard, challenging and different authors have been exploring the effectiveness of CIE report with discontinuous spectral sources as LED, which initially were not investigated; the previous work underlined the over-all impact of color temperature on damage, rather than the damage potential of each light sources. Likewise, general conservation aspects should be implement-ed; Weintraub [26] evaluates the need of new metrics using risk assessment tools for the use of LED in light-sensitive collections based on the phenomenon of “hole-burning” that isolated LED out peaks could, therefore, accelerate damage yet verifies CIE method.
Perrin et al. [27] have supported evaluations and demonstrations of high-perfor-mance solid-state lighting for the U.S. Department of Energy Gateway program evidencing that blue-pumped LEDs are the least likely to cause material degrada-tion at any given correlated color temperature. As seen in Figure 10 & 11, there is a linear correlation between damage potential and CCT; the plot is normalized for equal light intensities. However, standard blue-pump LEDs have the lowest damage potential at a given CCT compared to unfiltered incandescent and halogen sources their radiation has been approximated by blackbody radiation. Even violet-pump LEDs pose a lower risk than a typical incandescent or halogen lamp [28].
Piccablotto et al. [29] expressed doubts on the use of Blue Wool swatches as light dosimeter since faded slower under LED with a high correlated color temperature (CCT) and faster under halogen lamp: the use of CCT as an adequate predictor of material degradation is not consistent with LED. Moreover, the results indicate that
typically, white LEDs are less damaging than traditional lamps. Luo et al. [21] ex-plore the damage to photographic material and confirm that white LEDs are safer than conventional light sources and the fading model could be satisfactorily used and provide a revised light dosage classification for photographs under tunable multi-LED source.
A worth to mention lighting project has been developed by Muñoz et al. [30] in El Castillo Cave in Spain, with the aim of minimizing the power consumption and the necessary equipment inside the cave; the critical problem with light inside the cave is the biological effect of this radiation, which makes the growth of fungus or algae possible. A spectral radiant distribution of blackbody radiator at Tt = 1850 K was considered the best as is approximately the temperature of the torch which was the lighting source used by the artists. An optimization study has been performed to define the spectral distribution of a tunable LED RGB source with a low value of damage effective irradiance. Meanwhile, a biological test was conducted to evalu-ate whether this irradiance level stops the growth of biological agents such as fun-gus or algae that can cause deterioration and degradation during a period of one year for 24 h a day. An illuminance of 40 lx has been given onto the rock inside the cave in a place with environmental parameters (temperature and relative humidity) similar to those of the panels. Among the authors, observations have evidenced that standard sources do not provide enough design parameters to optimize both the perception and conservation of the rock-paintings.
A recent investigation proposed by Farke et al. [7] over the effect of light by differ-ent light sources concluded that among low voltage halogen lamps, metal halide lamps, or LED lamps all evidenced a mixed picture, with no clear-cut advantage
Figure11 CIE spectral damage potential (Sdf) versus CCT [28]
for any of the light sources. A result that is somewhat surprising: according to the CIE 157 LED source should have been the least harmful. The research has been held considering doses as hour exposition to light: an interesting insight of the author’s critics issue of ‘acceptability levels of light damage’ and that shouldn’t be addressed through instrumental studies alone, ignoring interaction between visi-tor, lighting, and exhibition.
The damage curves described in the CIE report provide the universal method for evaluating relative damage based on the spectral distribution of any light source. Because the probable rate of damage per wavelength is based on results from a broad range of materials, it avoids the inevitable problem of making assumptions about damage based on unique photochemical sensitivity of a particular substance. The values provide the most useful means for calculating wavelength specific dam-age since they consider the higher damdam-age potential of shorter wavelengths. Szabò et al. in their publication regarding Sistine Chapel new lighting installation in 2012 concluded that preservation request could be reached by LED technology for pic-tures, especially frescos, much better rather than the presently available artificial light sources, and far safer than natural daylight under the same illumination levels [31].
For risk assessment and potential damage, the predominant limitation provided by LED technology is actually a less “mature” source. The technique applicated to predict their potential change in pigment appearance according to its lux-hours of light by microfading, i.e. bombarding a material with high illuminance, over a known period could be highly inaccurate [27] in comparison to real performance museum light levels of controlled exposure to 50 lux. Hence, research will continue on different materials and results will have to be integrated with data of the effec-tive stress.
LED performance on Art
The international request for energy saving is implementing the development of technologies that guarantee sustainability, bringing to the forefront critical points such as energy consumption from lighting. The recent monitoring of the European Commission’s GreenLight program, which promotes the adoption of technologies for efficient light energy in non-residential areas, shows a progressive saving of 50%, with an emphasis on the improvement of the lighting environment from an economic point of view thus energy and the quality of light. Under the general heading of these percentages for lighting and public buildings, the problem of energy requalification of Cultural Heritage is hidden, where light and lighting engi-neering play a vital role.
In the report of Druzik et al. [27] the example of the relamping of J. Paul Getty Mu-seum is described, a large project with three galleries, where Sylvania 60W PAR38 30° flood lamps have been replaced with Cree 12W LED PAR38 2700K (LRP-38) sources. Gallery operating hours per year data allows calculating kWh savings and converting that to annual carbon footprint reduction based on published tables of summary records. In Table 1 are shown calculations based upon some institutions provided by the American Association of Museums, Canadian Heritage, Network of European Museums, and International Council of Museums for the average annual emissions in greenhouse gases and the life-cycle reduction on a 10-year base.
Energy-saving
Likewise, the benefits of the adoption of LED technology is of large significance in other economic aspects as their long life-time will reduce the maintenance costs, their increasing output and their easy integration to control systems that offer comfort, adaptability and therefore more energy reduce. Yet upgrading lighting systems can offer both opportunities and potential drawbacks; this recent change has risen the interest of research, as previously seen, on their non-visual effects i.e the potential damage on artworks, as well as, the visual aspects.
Type Base Case Alternative Reduction Life-Cycle reduc-tion 10 years J. Paul Getty Museum
CO2 1,422.5 241.8 1,180.7 11,805.2 SO2 0.35 0.06 0.29 2.91 NOx 0.58 0.10 0.49 4.85 North America CO2 28,837,095 4,904,130 23,932,965 239,228,325 SO2 7,092 1,216 5,877 58,971 NOx 11,753 2,027 9,930 98,285 Europe CO2 21,345,000 3,630,000 17,715,000 177,075,000 SO2 5,250 900 4,350 43,650 NOx 8,700 1,500 7,350 72,750
North America + Europe
CO2 50,182,095 8,534,130 41,647,965 416,303,325 SO2 12,342 2,116 10,227 102,621 NOx 20,454 3,527 17,280 171,035 World CO2 78,265,000 13,310,000 64,955,000 649,275,000 SO2 19,250 3,300 15,950 160,050 NOx 31,900 5,500 26,950 266,750
Table 1 Greenhouse Gas Emission Reduction Summary Units in kilograms of emissions [27]
The human vision is not uniform; responses to stimulation of the central part of the visual field are different from those of the periphery and the system will tend to adapt to brightness and color of the prevalent illumination, the most significant in the first 60 sec after the exposure, a phenomenon called adaptation. The required time to adapt to a change in retinal illumination depends on the change level, in-volving photoreceptors, the direction, the transition time and the visitor’s age [32]; if the change in luminance is in the range of 100:1adaptation occurs within 1 sec-ond. When changes in retinal illuminance are substantial (luminance range greater than 1000:1), photochemical adaptation is required, to this, the direction of change is since changes to a higher retinal illuminance occur faster than changes to a lower one. When only cone photoreceptors are involved, a few minutes is sufficient for adaptation to happen, while transitions from cone photoreceptor operation to rod photoreceptor operation may take tens of minutes; older people may take longer to adapt and achieve a less complete adaptation.
Thus, moving in the museum environment is an experience of a series of adap-tation changes through photopic, mesopic and dark-adapted scotopic function along with change on the sensitivity of the spectrum [33]. In Figure 12 the naturally occurring luminance rates are plotted in logarithmic scale, the human visual system makes as able to navigate the twelve orders of magnitude between moonless night sky noon sun. However, the observer can only comfortably view an adapted range of two to three orders of magnitude.
Similarly, color temperature difference will affect the adaptation of color vision and the various types of cones activated; this influences the impression and defines color-constancy, a feature of the human color perception system; the perceived
Visual aspects
color of objects remains relatively constant under varying illumination conditions. Correlated Color Temperature (CCT) is defined as the temperature of the Planckian radiator having the chromaticity nearest the one associated with the Spectral Pow-er Distribution (SPD) of the light source and describes the appearance of illumina-tion along a red-white to blueish-white dimension, different color spaces are used for this evaluation.
Traditionally this sector of research, based on empirical experiments, has been oc-cupied to define a pleasant room illumination or to improve performance in work-spaces: the Kruithof curves. Moreover, these studies have provided the canonical set of data for museum settings. First presented in 1941 the graph that plots pre-ferred combinations of illuminance and CCT for interior lighting conditions; the chart shows lower and upper illuminance thresholds for a range of CCTs that bound the region of pleasing illumination. He supposed that beneath the lower boundary, lighting is judged as dim at low CCT or cold at high CCT, whereas above the upper threshold, color reproduction is unpleasant and unnatural. However, the basis of his curve has not been validated; there are several insufficient pieces of evidence to support the proposed combinations even if is “probably the most reproduced diagram in the history of lighting” [34, 35, 35].
Figure 12 Luminance range encoun-tered in nature and the museum setting candelas/m2 (logarithmic scale) [55]
The most extensive study on Kruithof curve and the later experiments over his the-ory have been validated with CIE recommended best practice by Fotios [36] after review of experimental design and reporting, to provide credible evidence, tend to reject the proposed relationship. Some awareness though has been suggested concluding that: a. Variation in CCT has a minor effect on ratings of brightness and pleasantness; b. Low illuminances (less than 300 lux) may be perceived as unpleas-ant, an illuminance of 500 lux is sufficient to provide a pleasant environment and a further increase in illuminance above 500 lux is of little benefit; c. Higher illumi-nances are perceived to be brighter, and this effect appears to be stronger than for other relationships.
There are instead few relevant researches that consider the lim-itations imposed by the human visual system when viewing art-works; an overview of the litera-ture though made by Zhai et al. [37]showed some empirical stud-ies and investigated the principal visual perceptions and the LED parameters for viewing museum paintings. Different LED illumi-nants were evaluated to light oil and gouache paintings where ‘visibility’ and ‘warmth’ raised as the main perceptions for viewing paintings. Results evidenced that a CCT around 3500 K, a color on the purple side of the blackbody locus and high color rendering index can achieve ‘visibility’ factor.
The first direct tests and quantitative verifications of viewers preferences simulating a museum environment have been conducted by Scuello et al. [33], and the results confirm that Kruithof curves have not been verified. A CCT of 3600 K is the prefer-able still temperatures of approximate daylight (5500-6500) K are also acceptprefer-able. Sedwick and Shaw in the 2000 London Conference on Daylight design and Re-search [38] consider that during daytime lights used to compensate and balance daylight need to match the colder CCT of it meanwhile excluding it form night time
Figure 13 The Kruithof graph 1941
that such temperatures could reveal harsh for visual experience. Commonly, warm temperatures as the ones of tungsten halogen ~3000 K in predominantly daylit galleries, 4000-6500 K at overcast sky, and up to 30000 K under clear sky, create noticeable warm pools of light.
Zhai et al. [39]conducted an experiment with twenty-four observers, and the meth-od of categorical judgment was used with fourteen word-pairs of visual perception to evaluate each painting under different lighting conditions. An increase of illumi-nance from 50 lux to 200 lux has an immediate raise of the rating yet tend to show a smaller increase at 800 lux; exceptions for the Soft/Hard and Artistic/Business perception. CCT had a negative correlation to all the scales except contrast, bright-ness and clearbright-ness perceptions. Factor analysis revealed that there are three domi-nating visual factors: Comfort, Vividness, and Definition. These three determine the quality of LED lighting for observing fine art paintings. Based on the results they consider that a CCT in the range 2850– 4000K and a moderate illuminance level of 200–800 lux is deemed to be comfortable or pleasing for LED lighting of paintings in museums.
Traditional empirical studies have explored the appreciation of paintings under dif-ferent CCT; Nascimento et al. [40] found that the average CCT preferred for real and monitor viewing conditions were very similar, 5500 and 5700 K, respectively is high-er than typically used in museums, and the viewing conditions, real or simulated, have only a minor effect. Feltrin et al. [41] explored that the predominant hue of the paintings has no impact on the preferred CCT meanwhile warm and cold light-ing arrangements were the least appreciated. A CCT of 4000 K was the favorite and rating results for a pleasant background lightness - black, grey and white – don’t evidence essential differences.
Szabò and Schanda [16] express the opinion that in picture galleries the perceived hues of the pictures seen under artificial illumination should be similar to the per-ceived hues under natural daylight, since artists painted and presented their artwork during day under sunlight for centuries; has been the introduction of incandescent light in galleries to change dramatically color appearance. Shanda’s approach for a full spectrum light could give an overall answer as the most complete wherever colors need to be differentiated and so their reproduction, as close as to daylight hues. Many different SPDs share the same CCT, so specification of CCT alone does not represent precise SPD; different authors have explored the tailoring of SPD with LED technology.
Findings of Chakrabarti et al. [42] developing a suitable SPD system for golden items in display cases notice that color properties as chroma and hue converge in
increasing color temperature.
Fotios and others [36] consider that as a sole metric CCT fails to predict the per-ceived brightness of a scene and provides an insufficient definition of the spec-trum, however, such statement is correct when attempting to define any visual perception with a single metric. His proposal consists of an improvement, defining two metrics as spatial brightness and color rendition of illuminated objects. Other authors report a range of spectrum-based metrics CCT, Ra, R9, Qa, Qg, Qf, Duv, and x–y chromaticity, yet color rendering for museum installations is relevant to color fidelity, and different metrics have been proposed and used to this end.
![Figure 8 The cause of damage Hdm and the effect according to Berlin model. Figure 9 The spectral distribution of the logarithm of threshold effective radiant exposure [19]](https://thumb-eu.123doks.com/thumbv2/123dokorg/2891705.11290/28.892.156.825.522.805/figure-according-spectral-distribution-logarithm-threshold-effective-exposure.webp)
![Table 1 Greenhouse Gas Emission Reduction Summary Units in kilograms of emissions [27]](https://thumb-eu.123doks.com/thumbv2/123dokorg/2891705.11290/39.892.53.763.289.804/table-greenhouse-emission-reduction-summary-units-kilograms-emissions.webp)
![Figure 12 Luminance range encoun- encoun-tered in nature and the museum setting candelas/m2 (logarithmic scale) [55]](https://thumb-eu.123doks.com/thumbv2/123dokorg/2891705.11290/41.892.83.792.529.840/figure-luminance-encoun-encoun-nature-setting-candelas-logarithmic.webp)
![Figure 14 The sample fidelity scores (Rf, CESi) plotted together in hue order create a “signature” for the source that indicates the consistency of color ren-dition [44]](https://thumb-eu.123doks.com/thumbv2/123dokorg/2891705.11290/46.892.95.784.591.823/figure-fidelity-plotted-signature-source-indicates-consistency-dition.webp)
![Figure 15 Risk Management Concept [50]](https://thumb-eu.123doks.com/thumbv2/123dokorg/2891705.11290/49.892.142.486.526.825/figure-risk-management-concept.webp)
![Figure 21 The components of daylight and their relation to the DF and cli-mate-based modelling approaches [61]](https://thumb-eu.123doks.com/thumbv2/123dokorg/2891705.11290/61.892.78.575.387.809/figure-components-daylight-relation-mate-based-modelling-approaches.webp)
