GAMMA IRRADIATION CALLIOPE FACILITY
AT ENEA – CASACCIA RESEARCH CENTRE
(ROME, ITALY)
S. BACCARO, A. CEMMI I. DI SARCINA, G. FERRARA Fusion and Technology for Nuclear Safety
and Security Department Casaccia Research Centre, Rome, Italy
RT/2019/4/ENEA
ITALIAN NATIONAL AGENCY FOR NEW TECHNOLOGIES, ENERGY AND SUSTAINABLE ECONOMIC DEVELOPMENT
S. BACCARO, A. CEMMI I. DI SARCINA, G. FERRARA
Fusion and Technology for Nuclear Safety and Security Department Casaccia Research Centre, Rome, Italy
GAMMA IRRADIATION CALLIOPE FACILITY
AT ENEA – CASACCIA RESEARCH CENTRE
(ROME, ITALY)
RT/2019/4/ENEA
ITALIAN NATIONAL AGENCY FOR NEW TECHNOLOGIES, ENERGY AND SUSTAINABLE ECONOMIC DEVELOPMENT
I rapporti tecnici sono scaricabili in formato pdf dal sito web ENEA alla pagina www.enea.it I contenuti tecnico-scientifici dei rapporti tecnici dell’ENEA rispecchiano
l’opinione degli autori e non necessariamente quella dell’Agenzia
The technical and scientific contents of these reports express the opinion of the authors but not necessarily the opinion of ENEA.
GAMMA IRRADIATION CALLIOPE FACILITY AT ENEA - CASACCIA RESEARCH CENTRE (ROME, ITALY)
S. Baccaro, A. Cemmi, I. Di Sarcina, G. Ferrara Abstract
In the present Technical Report the Calliope 60Co gamma irradiation facility at the ENEA Casaccia Re-search Centre (Rome) is described. A brief description of the physical processes involved in the gamma radiation interaction with matter and the dosimetric methods (Fricke, Red-Perspex, radiochromic, ala-nine-ESR, TLD and RADFET dosimeters) used to determine the absorbed dose at the Calliope facility is given. Qualification and research activities performed at Calliope in the framework of national and international projects and collaborations with industries and research institutions are briefly descri-bed.
Key words:60Co, gamma radiation, dosimetry, irradiation facility. Riassunto
Nel presente Rapporto Tecnico viene descritta la facility di irraggiamento gamma Calliope situata nel Centro Ricerche ENEA Casaccia (Roma). Viene presentata una breve descrizione dei processi fisici che caratterizzano l’interazione radiazione gamma – materia e le tecniche dosimetriche (dosimetri Fricke, Red-Perspex, radiocromici, alanina-ESR, TLD e RADFET) utilizzate presso il Calliope per determinare la dose assorbita nei materiali irraggiati. E’ inoltre presentata una breve descrizione delle attività di qualifica e di ricerca, condotte nell’ambito di progetti e collaborazioni nazionali ed internazionali con industrie ed istituti di ricerca, in cui la facility Calliope è coinvolta.
Introduction
1 Calliope gamma irradiation facility 1.1 Irradiation plant
1.2 Control and management systems
1.2.1 Monitoring and diagnostic automatic system 1.2.2 Single camera monitoring system
1.2.3 Source rack position monitor 2 Interaction of gamma radiation with matter
2.1 Photoelectric effect 2.2 Compton scattering 2.3 Pair production 3 Radiation dosimetry
3.1 Calliope dosimetric systems 3.1.1 Fricke dosimeter 3.1.2 Red Perspex dosimeter 3.1.3 Alanine dosimeter
3.1.3.a Alanine dosimeter calibration for low dose range 3.1.3.b Alanine dosimeter calibration for high dose range 3.1.4 Thermoluminescent dosimeter
3.2 Absorbed dose determination
3.3 Sample management and irradiation test certification 4 Qualification tests and research activities at Calliope facility
4.1 Qualification tests on electronic devices 4.2 Research activities at Calliope facility ACKNOWLEDGEMENTS REFERENCES 7 8 8 12 12 12 14 16 16 17 18 19 21 21 23 24 25 27 28 29 32 34 34 35 39 40
INDEX
7
Introduction
The present report describes the Calliope gamma irradiation facility (ENEA-Casaccia Research Centre, Rome, Italy), the physical concepts, methods and set-ups used to measure the absorbed dose in different materials and devices and the qualification and research activities overview in which the facility is involved.
The term ionising radiation refers to radiation able to induce ionisation and/or excitation of atoms through primary and secondary interaction processing. Charged particles induce ionisation and excitation by Coulomb interaction with atomic electrons. X- and gamma-rays with energies above tens of kilo-electronvolt (keV), interact with matter through three main processes: photoelectric effect, Compton scattering and pair production. The result of these interactions is the emission of secondary charged and neutral particles, which in turn may induce further ionisation and excitation processes. Also neutrons can cause the production of secondary charged particles through different kinds of interaction, such as (n, p), (n, d), (n, α) or (n, t) processes and for this reason, they can be considered as ionising radiation [1, 2].
According to ASTM E 170-76 [3], dosimetry allows to describe ionisation process, radiation field, field parameters or the absorption of the field-associated energy in different materials. Dosimetric techniques can be divided in absolute and relative methods. In the first case, the direct absorbed dose value is obtained by the measurement of a specific physical quantity: an example is represented by the absolute calorimetric dosimetry, based on the temperature increase of the irradiated medium. Relative dosimeters require an inter-calibration with an absolute method.
At Calliope facility, several dosimetric methods are used, depending on the absorbed dose range of interest: Fricke solution (20 - 200 Gy), Red Perspex (5 – 50 kGy), radiochromic (1 kGy – 3 MGy), alanine-ESR (1 Gy – 500 kGy), Thermo Luminescent Dosimetry TLD (0.1 mGy – 100 Gy) and electronic RADFET (0.01 – 1000 Gy) dosimeters [4, 5]. The relative solid-state and electronic dosimetry methods (Red Perspex, radiochromic, alanine-ESR, TLD and RADFET dosimeters) are periodically calibrated to the Fricke dosimetry absolute method.
The Calliope gamma irradiation facility is deeply involved in qualification and research activities, in the framework of international projects and collaborations with industries and research institutions. Qualification tests are mainly performed on components, devices and systems for application in hostile environment, such as nuclear plant and Space, and on concrete matrices for nuclear waste storage.
Research activities are focused on the investigation of gamma irradiation effects on chemical and physical properties of different materials, such as radiation detectors, scintillating crystals and glasses, polymers, for applications in nuclear plants, Space and High Energy Physics experiments. Material characterization and biological researches are carried out on conservation and preservation of Cultural Heritage archives and artifacts, agriculture, AgroSpace and environmental fields.
8
1
Calliope gamma irradiation facility
The Calliope facility was built in 1967-1968 to perform research on agricultural product treatments. Since the eighties, Calliope is involved in qualification tests for radiation processing and research activities on materials (crystals and glassy matrices, optical fibres, synthetic and natural polymers), biological systems and devices to be used in hostile radiation environment such as nuclear plants, Space and High Energy Physics experiments.
1.1
Irradiation plant
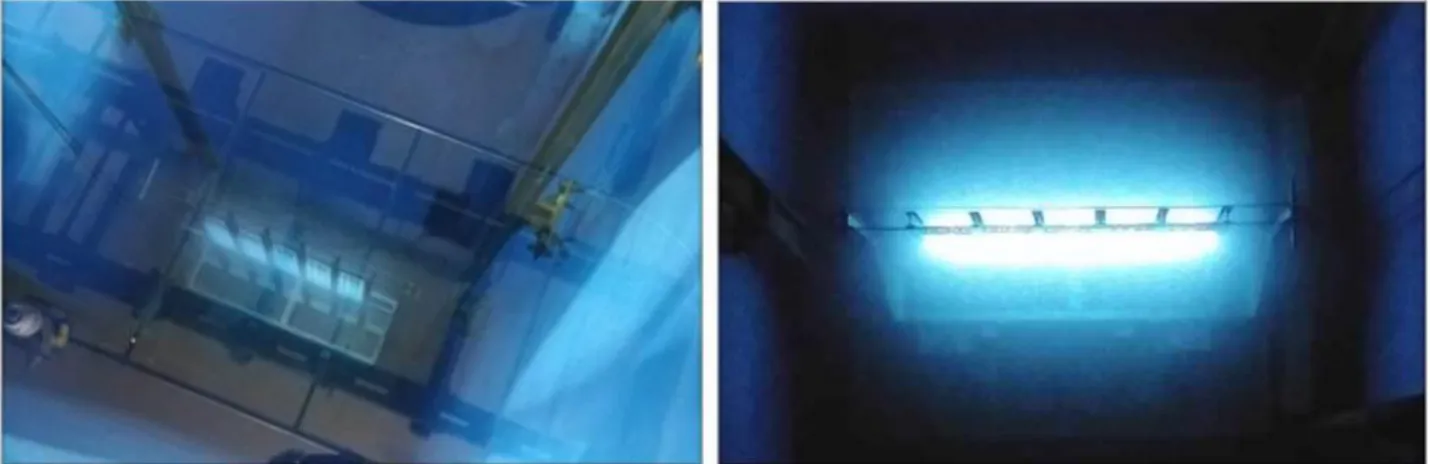
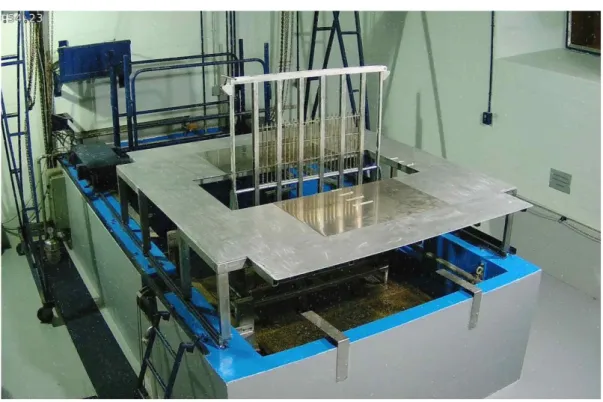
The Calliope plant is a pool-type irradiation facility equipped with a 60Co (mean energy 1.25 MeV) radio-isotopic source array in a high volume (7.0 m 6.0 m 3.9 m) shielded cell. Source rack has a plane geometry with 25 60Co source rods (active area: 41 cm 90 cm) (Figure 1).
Figure 1 - a) Calliope rack with 60Co sources (pool view); b) Cherenkov effect1.
The 60Co radioactive sources radiation consists of two photons of 1.17 and 1.33 MeV energy emitted in coincidence [6, 7]. The maximum licensed activity for the Calliope plant is 3.70 x 10¹⁵ Bq (100 kCi) and the present activity (January 2019) is 2.48 x 10¹⁵ Bq (67 kCi). Different dose rate values are available by placing the samples in specific positions within the irradiation cell; currently (January 2019), 10.80 kGy/h is the maximum available dose rate. The storage pool dimensions are 2.0 m 4.5 m 8.0 m and two separate source emergency storage wells are positioned at the bottom of the same pool. A trap door located on the roof of the irradiation cell allows the introduction or the withdrawal of radioactive materials. The irradiation cell biological protection consists of baritic concrete walls having thickness of 180 cm.
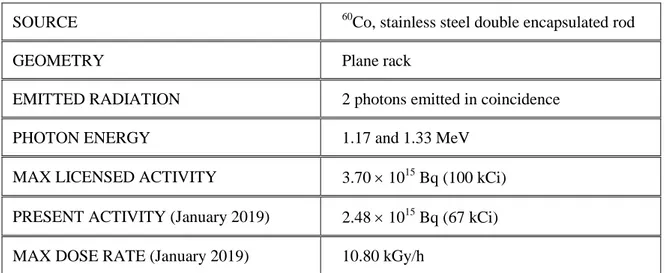
The main Calliope features are reported in Table 1. Figures 2 and 3 show the vertical and the horizontal sections of the irradiation facility. The steel platform, with a central aperture allowing the passage of the source rack (Figure 4), is installed on the pull to perform the irradiation of samples at high dose rate values.
1
Cherenkov radiation is the emission of electromagnetic radiation when a charged particle passes through an insulator at a speed greater than the one of the light in the medium. The characteristic “blue glow” of nuclear reactors is due to
Cherenkov radiation. It is named P.A. Cherenkov, the 1958 Nobel Prize winner who was the first to rigorously
9
Table 1. Calliope plant main features.SOURCE 60Co, stainless steel double encapsulated rod GEOMETRY Plane rack
EMITTED RADIATION 2 photons emitted in coincidence PHOTON ENERGY 1.17 and 1.33 MeV
MAX LICENSED ACTIVITY 3.70 1015 Bq (100 kCi)
PRESENT ACTIVITY (January 2019) 2.48 1015 Bq (67 kCi) MAX DOSE RATE (January 2019) 10.80 kGy/h
Figure 2 - Vertical section of the Calliope facility. irradiation cell trap door to introduce or withdraw sources Storage pool load and u n load ing ar ea
INOX steal well opening for pump Closing plug 10 t capacity
10
Figure 3 - Horizontal section of the Calliope facility.
Figure 4 - Irradiation cell with 60Co sources rack and the platform for sample positioning (picture acquired by local remote camera acquisition).
11
Movable supports, provided with samples and dosimeters holders, enable to carry out experimental measurements in isodose positions. As shown in Figure 5 each support is composed of two parallel steel supports that can be vertically moved, in order to investigate horizontal and vertical dose rate uniformity.
Figure 5 - Irradiation cell view and movable supports for dosimetric measurements.
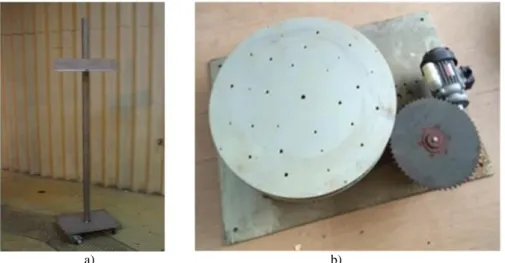
Steel mountings, allowing a reproducible sample positioning, are available (Figure 6a) and they can be moved in different positions in the irradiation cell.
Rotating platforms characterized by different rotational rates (one of these is reported in Figure 6b), are available to ensure an uniform irradiation on large volume samples.
a) b)
Figure 6 - a) Steel movable mountings; b) rotating platform for uniform irradiation.
In order to perform irradiation tests at very low dose rates (around 0.1 Gy/h) two chambers with lead walls are located in different positions of the irradiation cell (Figure 7). The internal dimensions of these shielded wells are 30 cm 40 cm 40 cmfor the cubic largest one and 24 cm diameter, 18 cm high for the
12
cylindrical one. The cylindrical well can accommodate electronic devices and components, which can be biased and controlled using, a feedthrough port, during the irradiation test.
a) b)
Figure 7 - a) Cubic and b) cylindrical lead wells positioned inside the irradiation cell for tests at very low dose rates.
At Calliope plant, irradiation tests can be also performed in special environments such as vacuum, gas mixtures other than air and at different temperatures. During irradiation tests on electronic devices, it is possible to perform the test under bias and to monitor their parameters by a remote dedicated measurement set-up positioned in a radiation-safe area close to the irradiation cell (see Internal labyrinth in Figure 3).
1.2
Control and management systems
Recently, several improvements related to the control of irradiation test parameters were developed to upgrade the Calliope facility with a complete monitoring and diagnostic integrated system for the irradiation tests standardization.
1.2.1 Monitoring and diagnostic automatic system
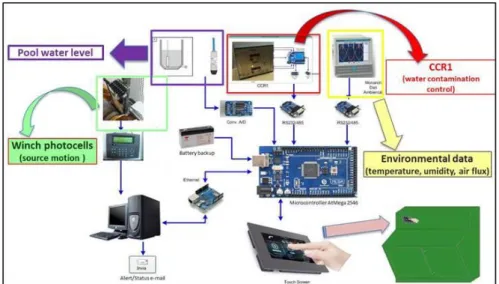
The Calliope irradiation facility is equipped with remote acquisition and touch screen display control integrated systems designed and developed to monitor the irradiation test environmental parameters (temperature, humidity, air flux), water contamination, pool water level. The integrated systems record any Calliope facility anomalies (Figure 8) and send warning message by email.
In Figure 9 the scheme of monitoring and diagnostic automatic system is shown.
1.2.2 Single camera monitoring system
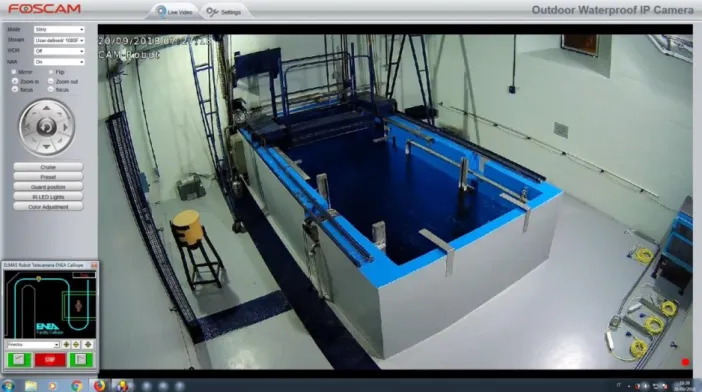
A high resolution single camera monitoring system was installed to allow a complete cell vision control also during irradiation tests and to record on line pictures and videos. The monitoring system is composed of a
13
pictures and video registration (PC connection or 32 Gb memory card storage) with a wide horizontal (355°) and vertical (-88°/+88°) range are acquired. Monitoring apparatus operates along a single track 22 meter long, fixed to the ceiling for a complete cell vision control also during irradiation tests. Camera is equipped with infrared led for vision in the dark and with remote control by Calliope operators (Figure 11).
a) b)
Figure 8 - a) Touch screen display and b) monitoring and diagnostic automatic system installed on the Calliope facility control
consolle in the control room.
Figure 9 - Scheme of monitoring and diagnostic automatic system.
a) b)
14
Figure 11 - Picture of Calliope irradiation cell from the single camera monitoring system.
1.2.3 Source rack position monitor
In order to monitor the position of the source rack at any time, an optical sensor array has been set-up and interfaced to a recording system and a dedicated computer. The system consists of an array of optical sensors that look at the position of the rope moving the source platform, on the winch reel.
The sensors are calibrated on the rope allowed positions on the reel, when the winch is operated to pull up or down the source platform. These positions are directly related to the position of the source platform during its course: by monitoring the reel it is possible to know the exact location of the source at any time. This information has a twofold use: logging the irradiation time duration and signalling any anomalous movements of the source platform triggered by an alarm or a power cut. The alert function is designed to be completely independent from the control system of the plant, in order to be compliant with present prescriptions.
Data acquisition of the optical sensors is based on a local interface that periodically reads the status and temporarily stores the information. A computer located in the control room periodically copies data from the local interface and deletes its buffer. On the computer, a Visual Basic program displays the current status of the source platform, issues e-mail alerts when the source is moved up or down, and stores the history of the source platform position in a RAID disk array. Both the computer and the local interface are protected from black-out by UPS systems, which allow the computer to securely shut down if the power cut lasts long, while the local interface will store non-transmitted data in a non-volatile memory.
15
Figure 12 - Screen shot of the source rack monitoring system.16
2
Interaction of gamma radiation with matter
The physical processes involved in the energy transfer mechanism from gamma radiation to matter depend on the energy of the impinging photons and on the material. In the energy range between 0.01 MeV and 100 MeV the dominant processes are:
1. photoelectric effect; 2. Compton effect; 3. pair production.
The relative probability of these processes is reported in Figure as a function of the atomic number Z and the photon energy (hν) [8].
Figure 13 - Relative probability of photoelectric, Compton and pair production effects [8].
2.1
Photoelectric effect
The photoelectric effect is the emission of an atomic electron after the absorption of an incident energy quantum hν; the emitted electron is called photoelectron and it generally belongs to an inner atomic shell. The kinetic energy of the emitted electron (𝐸𝑝𝑒) is given by:
𝐸𝑝𝑒 = ℎ− 𝐸0 (1)
where ℎ is the energy of the impinging photon and 𝐸0 is the electron binding energy. The energy 𝐸0is then
converted in characteristic X-rays or Auger electrons, produced when the vacancy created by the emitted electron is filled by an outer electron. X-rays are dominant in high Z elements while Auger electrons are characteristic of light elements: X-rays are generally re-absorbed in a second photoelectric process, so the total photon energy is absorbed by the matter. This process is more probable for electrons belonging to the K shell, which represent the greatest part of the emitted photoelectrons. The cross-section of this process is monotonically decreasing with photon energy and it is characterised by typical absorption peaks at the photoelectric energy edge of the different shells (M, K, L).
17
The Moseley law defines the energy edge value:
𝐸 = 𝑅ℎ𝑐(𝑍 − 𝜎
2)
𝑛2 (2)
where Rhc = 13.6 eV, Z is the atomic number, is the screen constant and n the principal quantum number [1]. As far as the photoelectric cross section is concerned, there is no analytic expression valid for every range of photon energy. The adopted methods and the approximations depend on the energy region.
2.2
Compton scattering
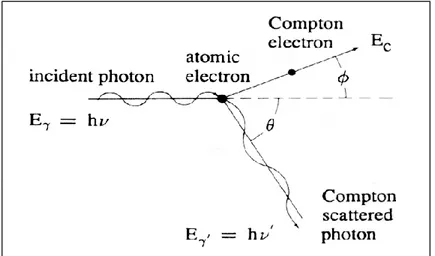
The Compton interaction between a photon and a bound electron can scatter the latter out of the atom, when the photon energy is enough high to exceed the electron binding energy. The result is the scattering of the photon along a direction different from the incident one, while the electron is emitted with a kinetic energy that can be calculated according to the energy and momentum conservation laws (Figure 14).
Figure 14 - Compton scattering kinematics.
The photon energy after the collision (𝐸𝛾′ = ℎ′) is related to its initial energy (𝐸𝛾= ℎ) and to the
scattering angle (𝜃) through the relation:
𝐸𝛾′ = 𝐸𝛾 1 + 𝛼(1 − cos 𝜃) (3) where 𝛼 = ℎ 𝑚𝑐2= 𝐸𝛾
0.511, and energy 𝐸𝛾 e 𝐸𝛾′ are expressed in MeV.
The kinetic energy of the Compton electron 𝐸𝑐 is given by:
𝐸𝑐= 𝐸𝛾− 𝐸𝛾′ =
𝛼(1 − cos 𝜃)
1 + 𝛼(1 − cos 𝜃)𝐸𝛾 (4)
From the aforementioned relations, it follows that the energy spectrum of the Compton electron ranges from 0 (corresponding to = 0°) to a maximum value (corresponding to = 180°) is given by:
18
𝐸𝑐(𝑚𝑎𝑥) = 𝐸𝛾 1 +0.5112𝐸 𝛾 𝑀𝑒𝑉 (5)The Compton effect is dominant at energies of around few MeV, as described in Figure 13 [2].
2.3
Pair production
In this process a photon is converted into an electron-positron pair. This is possible only in the atomic or electronic Coulomb field, due to the energy and momentum conservation laws. The pair production process is a threshold mechanism and it may happen only if ℎ≥ 2𝑚0𝑐2 (1.02 MeV), where 𝑚0 is the rest mass of
the electron and c is the light velocity [1, 2, 8]. The kinetic energy transferred to the electron-positron pair is:
𝐸𝑒+− 𝐸𝑒− = ℎ − 2𝑚𝑐2 (6)
Between the two particles, the positron tends to acquire more energy than the electron because of the coulomb repulsion of the nucleus. Pair production process may also happen in the Coulomb field of the atomic electron, even though less probable than the one taking place in the nucleus field, and it is characterised by edge energy of 4𝑚0𝑐2. The cross-section related to this process is given by:
𝜏 = 𝑎𝑍2𝛼𝑟𝑒2𝑓(𝐸, 𝑍) (7)
where f(E,Z) is a slowly varying function depending on the electron screening effect, is the hyperfine constant and re is the classical electron radius [9]. The photon mean free path before its conversion into the
(e+ - e-) pair is given by:
𝜆𝑝𝑎𝑖𝑟 =
1
𝑁𝜏 (8)
where N is the number of atoms in the unit volume and is the pair production cross-section. It is related to the radiation length through this expression:
𝜆𝑝𝑎𝑖𝑟=
9
7𝐿𝑟𝑎𝑑 (9)
where the radiation length Lrad indicates the mean free path after which an electron reduces its initial energy
19
3
Radiation dosimetry
Dosimetry is the method used to obtain information regarding ionisation processes, radiation field components and the energy absorbed by the matter. In radiation dosimetry, the most used physical quantity which gives a quantitative correlation between radiation and its effect, is the absorbed dose.
According to ICRU Report 85 [10], the absorbed dose D is defined as the ratio between the energy (d) released from radiation in a certain volume V of the matter and the mass contained in that volume (dm):
𝐷 = 𝑑𝜀
𝑑𝑚 (10)
In (10) is the energy released in the volume by the ionising radiation field, defined as:
𝜀 = 𝑅𝑖𝑛− 𝑅𝑜𝑢𝑡+ ∑ 𝑄 (11)
where:
- Rin is the radiant energy entering the volume V, or sum of the energies (with the exception of the rest
energy) of all directly and indirectly ionising particles entering the volume V;
- Rout is the radiant energy leaving the volume V, or the sum of the energies (with the exception of the
rest energy) of all directly and indirectly ionising particles going out from the volume V;
- ΣQ is the sum of all energies released, subtracted by the sum of the energy expended in each nuclear transformation and in the elementary processes induced by the radiation, in the volume V.
In the SI the absorbed dose is measured in Gray (Gy), while the unit rad (1 Gy = 100 rad) was used in the past:
1 𝐺𝑦 = 1 𝐽
𝑘𝑔 (12)
The dose rate is defined as the absorbed dose per time unit:
𝐷 =𝑑𝐷
𝑑𝑡 (13)
Considering a volume V2 of air in which a uniform photon radiation field is present (Figure 15) and, inside V2, a smaller volume V1. The distance between V1 and the surface of V2 must be larger than the mean
free path in air for electrons produced by the interaction of the photon field in V2, but not too large to
significantly alter the mean energy and distribution of the photon field. In the volume V1, photons will
generate secondary electrons with the same probability, energy and space distributions as in V2. The
consequence is that the number of electrons entering and leaving the volume V1 with a certain energy and
direction will be the same. That condition is known as the charge particle equilibrium condition and it guarantees no storage of secondary electrons in each volume V1, because the energy lost outside each volume
20
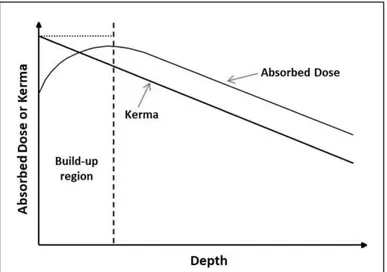
To realize the charged particle equilibrium conditions during the irradiation, an absorber of suitable thickness, defined as the charged particle equilibrium thickness, should surround the irradiated sample. The thickness value depends on the sample electron density and on the energy of the impinging radiation. Figure 16 shows the absorbed dose (or kerma) dependence on the sample depth and the charged particle equilibrium thickness value, corresponding to the thickness of the curve maximum. The curve is characterised by an initial rise due to the increasing electron flux coming from the absorber layer. With increasing thickness, photon attenuation causes an electronic flux decrease and consequently a decrease of absorbed dose.
Figure 15 - Air volumes V1 and V2 in an uniform photon radiation field.
Figure 16 - Schematic plot of absorbed dose dependence on sample depth.
The equivalent attenuation thickness of a material Seq can be obtained by the following relation:
𝑆𝑒𝑞=
𝑛𝐻2𝑂
𝑛𝑥
∙ 𝑆𝐻2𝑂 (14)
where 𝑛𝐻2𝑂 is the water electronic density, 𝑆𝐻2𝑂 is the electronic equilibrium thickness for water [12] and nx
21
𝑛𝑥 = 𝜌 𝑁𝐴 𝑀∑ 𝑍𝑖 𝑖 (15) where:- ρ is the material density [kg m-3]; - NA is the Avogadro number [6.023∙10
23
mol-1]; - M is the molecular mass [kg mol-1];
- Zi is the atomic number of the i-th material; - ΣZi is the total number of electron per molecule.
Figure 17 reports the dependence of water electronic equilibrium thickness on the photon energy.
Figure 17 - Dependence of water electronic equilibrium thickness on the photon energy [12].
3.1
Calliope dosimetric systems
Many physical and chemical properties of matter are modified by the exposure to radiation: these variations can be used to realize a system able to measure the absorbed dose, namely dosimeter.
At Calliope facility, several dosimetric systems are used, depending on the absorbed dose range of interest: Fricke solution (20 – 200 Gy), Red Perspex (5 – 50 kGy) and radiochromic (1 kGy – 3 MGy), alanine-ESR (1 Gy – 500 kGy), Thermo Luminescent Dosimetry TLD (0.1 mGy – 100 Gy) and electronic RADFET (0.01 – 1000 Gy) dosimeters [4, 5]. Among them, the relative solid-state and electronic dosimeters (Red Perspex, radiochromic, alanine-ESR, TLD and RADFET dosimeters) are periodically calibrated with the Fricke absolute dosimeter. The relative dosimetric systems are used to determine the dose rate value when the Fricke solution is not applicable.
3.1.1 Fricke dosimeter
In chemical dosimetric methods, the absorbed dose is evaluated by measuring the chemical change induced by irradiation in a solution.
22
One of the most widely used chemical dosimeters is the Fricke solution, composed of a acid solution of FeSO4 {or Fe(NH4)(SO4)2}10
-3
M, H2SO4 0.4 M and NaCl 10 -3
M, added to reduce the effect of organic impurities, as described in the reference standard [13]. The working principle is based on the radiation-induced oxidation of ferrous to ferric ions (Fe2+ => Fe3+), in condition of low pH value and in presence of oxygen.
The Fricke dosimeter is an absolute method because it directly provides the absorbed dose directly by measuring the optical density variation of the solution due to the irradiation. This dosimeter is characterised by a linear response in the range 20 - 200 Gy and it is used as primary reference method to calibrate the secondary dosimeters (e.g. Perspex, alanine-ESR) for gamma-ray, X-ray and accelerated electrons radiation fields. Fricke dosimeter response is independent on the radiation energy in the range 0.1 - 16 MeV and on the dose rate range 0.2 – 1·107
Gy/s. During the irradiation, temperature variation between 1 and 60 °C induces a negligible effect on the dosimeter response.
The limited absorbed dose range (20 - 200 Gy) is due to the not accurate measurement below 20 Gy and to the oxygen consumption occurring at the highest absorbed dose values. The addition of H2SO4 extends the
highest absorbed dose limit up to 105 Gy, because in this way ferrous ions undergo oxidation without oxygen consumption.
The main reactions occurring in the dosimeter during the irradiation are indicated in the following:
𝐻3𝑂++ 𝑒𝑎𝑞→ 𝐻∙+ 𝐻2𝑂 (16) 𝐻∙→ 𝑂2→ 𝐻𝑂2∙ (17) 𝐹𝑒2++ 𝐻𝑂 2∙ → 𝐹𝑒3++ 𝐻𝑂2− (18) 𝐻𝑂2−+ 𝐻+→ 𝐻 2𝑂2 (19) 2𝐹𝑒2++ 𝐻 2𝑂2→ 2𝐹𝑒3++ 𝐻𝑂−+ 𝑂𝐻∙ (20) 𝐹𝑒2++ 𝑂𝐻∙ → 𝐹𝑒3++ 𝑂𝐻− (21)
Each hydrogen ion causes the formation of a hydroperoxide radical (𝐻𝑂2∙), which in turn oxidizes one
ferrous ion according to reactions (18). Moreover, each hydroperoxide molecule (H2O2) and each hydroxyl
radical (𝑂𝐻∙) oxidize two and one Fe2+
ion, respectively, as in reactions (20) and (21).
The Fe3+ ion radiolytic yield 𝐺(𝐹𝑒3+), defined as the number of species created (or destroyed) per absorbed energy unit and measured in SI with (mol/J), can be so expressed as in the following:
23
Using a 60Co source, G(Fe3+) is equal to 1.61 μmol/J.
The quantitative analysis of the Fe3+ concentration induced by irradiation in Fricke dosimeter is performed by measuring the solution absorbance at 304 nm. In particular, for Fricke dosimeter the relation between absorbed dose (D, expressed in Gy) and the optical density OD (or absorbance) is:
𝐷𝐺𝑟𝑎𝑦 =
∆(𝑂𝐷)
𝜀 ∙ 𝐺(𝐹𝑒3+) ∙ 𝜌 ∙ 𝑙 (23)
where:
- Δ(OD)is the optical density of solution due to irradiation: Δ(OD) = (Al – Ac) where Al and is Ac are the
absorbance values of the irradiated and not irradiated dosimeters; - ε is the molar extinction coefficient of ferric ions at 304 nm;
- G(Fe3+) is the number of ferric ions produced per unit of absorbed energy (expressed in 100 eV unit);
- ρ is the density of the irradiated solution; - l is the optical path.
The equation (23), considering ε (Fe3+ @ 25°C) = 220 ± 2 m2/mol(at 304 nm) and G(Fe3+) = (1.61 ± 0.03)10
-6
mol/J(for 60Co source), ρ = 1024 kg·m-3 and l = 0.01 m [13], becomes:
𝐷𝐺𝑟𝑎𝑦 = 𝑘 ∙ ∆(𝑂𝐷) = (276 ± 6) ∙ ∆(𝑂𝐷) (24)
Equation (24) turned out to be in perfect agreement with the result of Fricke dosimeter calibration performed at the National Institute of Ionizing Radiation Metrology (INMRI) at ENEA - Casaccia Research Centre (Rome, Italy).
3.1.2 Red Perspex dosimeter
The working principle of solid state dosimeters, such as photographic films, solid scintillators and plastic materials, is based on their darkening due to the exposure to radiation (gamma rays, electrons). Plastic dosimeters are widely applied and offer several advantages: reduced dimensions, tissue-equivalent properties, response independent from dose rate and high reproducibility.
Red Perspex 4034 dosimeters2 used at Calliope facility are made from radiation-sensitive poly-methylmetacrylate (PMMA) in the form of optically transparent pieces individually sealed in laminate sachets and are applicable in the absorbed dose range 5 - 50 kGy [14]. For the Red Perspex calibration curve acquisition, according to ISO/ASTM51276-12 procedure [14], a set of Red Perspex 4034 was irradiated at different absorbed dose (5, 10, 20, 30, 43 and 50 kGy), at the position corresponding to a specific dose rate value measured by Fricke dosimeter.
Gamma radiation induces an absorbance increase at 640 nm (Ai), accurately measured by UV-VIS-NIR
spectrophotometer, that is a function of the absorbed dose. The absorbance value is normalized by the mean thickness of each dosimeter (Xi), obtaining the specific absorbance (𝐴′𝑖):
2
24
𝐴𝑖′ =
𝐴𝑖
𝑋𝑖
(25)
The mean specific absorbance (𝐴′0) is also calculated on a set of ten not irradiated dosimeters, obtaining the
relative specific absorbance (Arel):
𝐴𝑟𝑒𝑙 = 𝐴𝑖′− 𝐴0′ (26)
Assuming the relative specific absorbance (Arel) as independent variable x and the absorbed dose (D) as
dependent variable y, the calibration curve is obtained (Figure 18). The experimental values are fitted with a polynomial function, as reported in the same figure. The equation allows to determine the absorbed dose value by the experimental relative specific absorbance. The absorbed dose rate is obtained by dividing the absorbed dose value by the irradiation time.
Figure 18 - Red Perspex calibration plot: experimental data fitted by polynomial curve.
3.1.3 Alanine dosimeter
The alanine - ESR dosimetry method is considered one of the most powerful dosimetric techniques and it is based on the detection, by the Electron Spin Resonance (ESR) Spectroscopy, of stable free radicals induced by ionising radiation in the crystalline L-α-alanine amino acid [15].
The irradiation of alanine amino acid (CH3-CHNH2-COOH) induces the formation of CH3-ĊH-COOH free
radical, stable at room temperature. The ESR spectrometer provides the ESR spectrum, consisting in the first derivative of the signal. The ESR spectrum of the alanine radical is shown in Figure 19: five characteristic peaks are evident, due to the interaction between external magnetic field and the odd electron of the molecule.
25
Figure 19 - ESR spectrum of the irradiated L-α-alanine [9].The area of the ESR signal (double integral of the spectrum) is proportional to the number of radiation induced radicals and the amplitude of the highest line of ESR spectrum (used as dosimetric signal) is proportional to the absorbed dose.
Alanine-ESR dosimetry, suited for gamma, electrons and X-rays, offers several advantages such as high signal stability, wide absorbed dose range (1 Gy
–
500 kGy), tissue-equivalence, independence on the dose rate and energy and relatively insensitive to environmental parameters (light, humidity and temperature).Alanine dosimeters used at the Calliope plant are made of alanine powder substrate pressed into pellet shape with wax for binding material (Table 2 and 3).
The alanine - ESR dosimetry is calibrated with the absolute Fricke dosimeter, as described in the ISO/ASTM51607-13 standard [15]. Depending on the absorbed dose range (lower or higher than 500 Gy), two different set of ESR parameters (Table 4) must be used and two calibration curves must be acquired, as described in the following.
3.1.3.a Alanine dosimeter calibration for low dose range
The calibration curve for alanine - ESR dosimetry at absorbed doses lower than 500 Gy, is obtained by irradiation of alanine dosimeters at 3, 10, 20, 46, 54, 80, 117 and 389 Gy absorbed dose, at the position corresponding to a specific dose rate value measured by Fricke dosimeter.
The alanine ESR signals are acquired by Bruker e-scan spectrometer and normalised to the dosimeters mass. The alanine dosimeters used for low dose range (< 500 Gy) are manufactured in Germany by Dr. A. Wieser (Table 2).
The absorbed dose (D) dependence on the amplitude of the highest line of ESR spectrum normalised to the mass (hp-p/m) represents the calibration curve (Figure 20).
The experimental data interpolation gives:
𝐷(𝐺𝑦) = −3.7 + 111.6 ∙ℎ𝑝−𝑝
26
Table 2. Composition of dosimeters for low dose range.
Table 3. Composition of dosimeters for high dose range.
Dosimeter: Gold Bruker (1% error mass)
Shape: cylindrical, 4.8 mm diameter and 5 mm height Mass: 88 ± 1% (mg)
Dynamic dose interval: 500 Gy – 50 kGy
Table 4. ISO/ASTM51607-13 instrument parameters for low and high dose ranges [15].
Power (mW) 7.92 3.97 Sweep width(G): 200 200 Modulation (G): 10.1 1.01 Sweep time (s): 21.0 10.5 Filter T.C. (ms): 328 81.9 Receiver Gain (dB): 5 5 Receiver Offset: 0 0 Receiver Phase: 0 0 Field Offset (G): 8.93 8.93 Sweep numbers: 5 2 Sample Height 3(mm): 15 18
3 It indicates the sample position within the cavity, equal to 20 −ℎ
2 , where h is the sample height.
Dosimeter: AWM230
Materials: 85% wt L-α-alanine; 15% wt paraffin wax Shape: cylindrical, 4.8 mm diameter and 10 mm length. Mass: 230 ± 1% (mg)
Density: 1.27 g/cm3 Dynamic dose range: 1 Gy – 500 kGy Detection threshold: 0.1 Gy
27
Figure 20 - Alanine – ESR dosimetry calibration for low dose range (< 500 Gy).3.1.3.b Alanine dosimeter calibration for high dose range
For the calibration curve at high dose range (> 500 Gy) (Figure 21), Gold Bruker alanine dosimeters were used (Table 3). In that case, the irradiation absorbed doses are 0.4, 0.8, 1.5, 6 and 23 kGy and the operative method is the same that for the low dose range calibration. The obtained equation is:
𝐷(𝐺𝑦) = −0.31 + 1.99 ∙ℎ𝑝−𝑝
𝑚 (28)
28
3.1.4 Thermoluminescent dosimeter
When thermoluminescent dosimeters (TLDs) are irradiated, the absorption of energy from the radiation induces instability in their structure. These materials can come back to their original structure if the energy absorbed is released and the measurement of the released energy provides an indication of the absorbed dose.
In thermoluminescent (TL) materials, electrons are removed from the valence band (ground state) upon irradiation, leaving mobile, positively charged holes. These free charge carriers become localized by the impurities present in the crystal lattice (as defects), i.e., the filling of electron and hole traps between the valence band and the conduction band takes place during irradiation [16].
The energy absorbed from ionizing radiation and stored in the crystal lattice can be released as light if the TL material is heated after having been irradiated. The process of measuring the amount of emitted light is the basis of thermoluminescent dosimetry.
Electrons (holes) can stay in their traps for extended periods of time at room temperature. In the case of thermoluminescence during the carefully controlled heating of the irradiated crystalline material, the trapped electrons (holes) can be released from their traps and migrate to luminescence centres where they can recombine. The recombination is accompanied by the emission of light photons, the amount of which is the measure of absorbed dose [17, 18] measured by a TLD reader. The TLD reading is carried out keeping the dosimeter in a dark chamber equipped with a photomultiplier tube. When the TLD is heated, the photomultiplier converts the light into an electronic signal which is then amplified. The resulting output of the TLD reader, i.e. the intensity of the emitted light as a function of temperature, is called glow curve [19, 20]. The position of the peaks is characteristic of the crystalline material and the area under this curve is directly proportional to the amount of radiation that was absorbed by the dosimeter (Figure 22).
Figure 22 - Time-temperature profile and glow curve for LiF: Mg, Ti (TLD-100) exposed to 1 Gy [19].
For some TL materials there is a linear relationship between the absorbed dose and the amount of emitted light in a given dose range. At higher doses, first supralinearity appears (i.e., the slope of the line gradually decreases) followed by saturation.
29
The most commonly used TL phosphors are lithium fluoride, calcium fluoride, lithium borate, calcium borate, potassium bromide and calcium sulphate which are used either alone or with trace amounts of additives (e.g., rare earths or transition metals), since these additives can significantly influence the formation of imperfections in the crystal lattice, i.e., the formation of the structure of traps and luminescence centers.
The TL dosimeters are used in various forms (such as powder, rod, chip, single crystal, and pellet) depending on the field of application. The TL dosimeters are mainly used for the measurement of low doses, thus these systems are mostly used in radiation therapy, personal dosimetry [21] and environmental monitoring [22].
The TLDs offer precise response to a variety of radiation types including beta, gamma, neutron, heavy ion beams and X-ray radiation [23 - 27]. In particular, TLDs show a linear response in a wide range of gamma absorbed dose (0.1 mGy – 100 Gy). Moreover TLDs are often used in extremity monitors because of their small size, energy response characteristics and linearity through a wide range of exposures and exposure rates.
Since only a small part of the energy deposited as absorbed dose in a TL phosphor is emitted as light when the phosphor is heated (e.g. 0.4% in lithium fluoride), TLDs must be used under reproducible conditions to obtain consistent results.
Thermoluminescent dosimetry requires high precision calibration of the TLD system (TL dosimeters and TLD reader) including determination of several correction factors which account for dose response dependence, radiation type and energy dependence, loss of latent TL signal in time and the TLD reader’s drift. Accuracy of the TLD method of 10% can be achieved. To achieve a complete recovery of TLDs after irradiation, a specific high thermal treatment has to be performed and repeated several times to obtain a complete traps release.
Considering that the TDL system is a relative dosimetric method, a previous calibration procedure with the Fricke absolute dosimeter is required. In Figure 23 a calibration curve for Thermo Scientific™ TLD-100 rod dosimeters consists of LiF:Mg, Ti performed at Calliope plant laboratory with Thermo Scientific™ Harshaw Mod 3500 TLD Manual Reader is shown.
Finally, in thermoluminescent dosimeters the electrons can also drop back to ground state after a long period of time (from several weeks up to two years). This effect is called fading and is dependent on the incident radiation energy and intrinsic properties of the TLD material. As a result, each material has a limited shelf life after which dosimetric information can no longer be obtained.
3.2
Absorbed dose determination
To determine the energy deposition and the penetration of photons (x-ray, gamma ray, bremsstrahlung) in different materials, it is necessary to introduce the mass attenuation coefficient (𝜇𝜌) and the mass
energy-absorption coefficient (𝜇𝑒𝑛
30
Figure 23 - Calibration curve of gamma radiation field obtained by LiF:Mg, Ti (TLD-100 rod) dosimeters.
The mass attenuation coefficient is defined as:
𝜇 𝜌= 1 𝑥∙ 𝑙𝑛 ( 𝐼0 𝐼) (29)
where I0 and I are the incident and emerging intensity of mono-energetic photon flux, and and x are the
density and the thickness of the material crossed by the radiation.
The mass energy-absorption coefficient takes into account of the radiation produced by the secondary processes in the material and it is defined as:
𝜇𝑒𝑛
𝜌 = (1 − 𝑔) ∙ 𝜇𝑡𝑟
𝜌 (30)
where the g factor represents the average fraction of the kinetic energy of secondary charged particles subsequently lost in radiative processes and 𝜇𝑡𝑟
𝜌 is the mass energy-transfer coefficient, that is the product of
the mass attenuation coefficient and the fraction of energy transferred to the charged particles as kinetic energy, by the interacting incident photons [10].
Considering two different material m and m’, it is possible to obtain the dose absorbed by one of them (e.g. m) Dm, by their mass energy-absorption coefficients and the dose absorbed by the other one (e.g. m’)
Dm’: 𝐷𝑚 = (𝜇𝜌 )𝑒𝑛 𝑚 (𝜇𝜌 )𝑒𝑛 𝑚′ ∙ 𝐷𝑚′ (31)
31
For instance, if the absorbed dose in air is required and the absorbed dose in water was measured by Fricke dosimeter, the previous formula (for 60Co rays) will become:
Dair = (μρ )en air (μρ )en H2O ∙ DH2O= 2.666 ∙ 10−2(cm 2 g ) 2.965 ∙ 10−2(cm2 g ) = 0.899 ∙ DH2O (32)
Moreover, while the mass energy-absorption coefficient for biological systems and for a great number of polymers is usually likened to that of water, could be necessary to know which is the absorbed dose by solid materials used for different applications, such as concrete, metals, electronic components and crystals. If, for example, silicon-based electronic devices are irradiated, the conversion factor to the absorbed dose in silicon from the absorbed dose in water is expressed by the following formula:
𝐷𝑆𝑖= (𝜇𝜌 )𝑒𝑛 𝑆𝑖 (𝜇𝜌 )𝑒𝑛 𝐻2𝑂 ∙ 𝐷𝐻2𝑂 = 2.652 ∙ 10−2(𝑐𝑚2 𝑔 ) 2.965 ∙ 10−2(𝑐𝑚2 𝑔 ) = 0.894 ∙ 𝐷𝐻2𝑂 (33)
The mass-energy absorption coefficients used in (32) and in (33) are reported in [29]. Figure 24 shows the
mass attenuation coefficient and the mass energy absorption for silicon.
Figure 24 - Attenuation and absorption coefficients in silicon (Z = 14) [29].
For non-homogeneous materials, the mass-energy absorption coefficient can be calculated by the following equation:
32
(𝜇𝑒𝑛 𝜌 )𝑚 = ∑ 𝑤𝑖∙ ( 𝜇𝑒𝑛 𝜌 )𝑖 𝑁 𝑖=1 (34) where (𝜇𝑒𝑛𝜌 )𝑖 and wi are the mass-energy absorption coefficient and the atomic weight fraction of each
i-atomic element inside the sample.
In case of large objects, it could be useful to know the dose distribution inside the material. The absorbed dose corresponding to a material thickness x (Dx), is calculated by:
𝐷𝑥 = 𝐷0∙ 𝐵 ∙ 𝑒−𝜇𝑥 (35)
where D0 is the absorbed dose at the material surface, B is the build-up factor (defined as the ratio of the total
number of particles at a given point to the number of uncollided particles, at that same point) and µ is the linear attenuation coefficient at a certain energy, obtained by multiplying the mass attenuation coefficient for the material density ρ.
3.3
Samples management and irradiation test certification
The evaluation of the integrated dose and the planning of irradiation tests become critical when a large number of samples is involved, and each sample needs to be placed according to different dose rates and total integrated dose. In order to help maintaining a high quality standard in the irradiation procedures, a dedicated scheduling and reporting software system has been set-up. This system consists of a database where the operator inserts details about each sample, including sample description, expected total integrated dose, dose rate and position. The operator records in the database the actual insertion and extraction time of a sample in the irradiation cell. This software interfaces with the source position logging system, in order to measure the exact exposure duration for each sample, based on its presence in the assigned irradiation position during the irradiation time. By using database information about the source activity, updating this data with the activity decay law for the 60Co source, the software can determine the actual delivered dose to each sample, schedule the end of the irradiation according to the required integrated dose, and also produce a daily plan for the source operation.
The software also allows the issuing of the irradiation certification, which accompany the irradiated samples when these are given back to the customer. Templates of irradiation and dosimetry certificates are shown in Figure 25.
This document states the delivered total absorbed dose, the irradiation duration and the dose rate, and are accompanied by the dosimetric certification in which the dose rate measurement performed in the specific position of the irradiated sample is reported. The irradiation Plant Technician and Director validate the certifications before delivering them to the customer.
33
a)
b)
34
4
Qualification tests and research activities at Calliope facility
Since the eighties, the Calliope gamma irradiation facility is deeply involved in qualification and research activities in the framework of national and international projects and collaborations with industries and research institutions.
Qualification tests for nuclear application are performed on mechanical devices (valves, engines) and concrete matrices qualification for nuclear waste storage (low and intermediate level waste, LILW) [30, 31]. Several qualification activities are carried out on electronic components and devices for application in hostile environment such as nuclear plant and Space, in compliance with ESA ESCC Basic Specification No. 22900 (Issue 5) and MIL-STD-883E standards [32, 33]. Since 2018, the Calliope facility is indicated by the Italian Space Agency ASI as “ASI Supported Irradiation Facility” (ASIF Programme) recommended by the European Space Agency ESA, for carrying out the activities and qualification tests for Space.
4.1
Qualification tests on electronic devices
In current High Energy Physics and Astrophysics experiments, where electronic systems are exposed to high fluxes of energetic particles, the interest on electronic device radiation damage has continuously increased [32 - 38].
The physical processes involved in the radiation damage of electronic devices are particularly complex and they depend on several parameters, such as the kind of radiation, energy and fluency. In general they can be grouped in two classes: ionization damage and bulk damage.
The ionization damage, also called surface damage, is caused by electron-hole pairs generated in silicon dioxide (SiO2) and other insulators by ionizing radiation. In SiO2, electrons are much more mobile than holes
and they are quickly collected at the positive electrode, even if a fraction of them recombines with holes. The charge yield, i.e. the fraction of the electron-hole pairs surviving the initial recombination, depends on the type and energy of the impinging particles. The holes, escaping the initial recombination, are relatively immobile and they slowly undergo a hopping transport between localized sites in the oxide in presence of an electric field. Some of them can be trapped giving rise to accumulation of positive charge in the oxide or can generate interface states at the SiO2/Si interface, affecting the device operation.
The bulk damage or displacement damage is caused by collisions of energetic protons, neutrons, ions and electrons, which transfer sufficient energy to knock out a Si atom from its lattice position. A vacancy-interstitial pair called Frenkel defect is so generated, which migrates until a stable defect is formed by association with other defects, impurities or dopants.
At Calliope plant it is possible to perform ionizing damage test on electronic components according to procedures defined in MIL-STD-883 and in ESA/SCC Specifications No.22900 (Issue 5). The difference between the two protocols is that MIL-STD-883 defines the procedures to test electronic devices to be used in Military and Aerospace electronic systems, while ESA/SCC Specifications No.22900 (Issue 5) are strictly devoted to the qualification of integrated circuits and discrete semiconductors suitable for Space applications.
35
As far as the adopted dose rate is concerned, according to MIL specifications (standard conditions) the dose rate has to be included between 50 rads(Si)/s and 300 rads(Si)/s (i.e., between 0.5 Gy(Si)/s and 3 Gy(Si)/s) and it has not to vary more than ±10% during each irradiation.
In ESA specifications, two dose rate windows can be adopted:
1) the standard dose rate between 3.6 krad(Si)/h and 36 krad(Si)/h (i.e., between 36 Gy(Si)/h to 360 Gy(Si)/h);
2) the low dose rate between 36 rad(Si)/h and 360 rad(Si)/h (i.e., between 0.36 Gy(Si)/h and 3.6 Gy(Si)/h).
Depending on the expected maximum dose rate, the total irradiation time must be less than 96 hours. The time interval between the end of the irradiation and the beginning of the device electrical characterization has to be less than 1 hour. Moreover, the time interval between one irradiation step and the beginning of the next exposure must be at most 2 hours. After irradiation, the eventual accelerated aging have to be performed keeping the component under bias and at 100 °C for 1 week [32, 33].
During the irradiation procedure test specimens have to be surrounded by equilibrium material, which will minimize dose enhancement from low energy scattered radiation by producing charge particle equilibrium. To this purpose, both MIL and ESA specifications recommend the use of a container of at least 1.5 mm Pb with an internal lining of at least 0.7 mm Al. For instance, considering the fraction of attenuated photons as a function of energy and thickness for Pb and Al (Figure 26), it is easily possible to deduce that the 1.5 mm Pb (0.7 mm Al) layer absorbs 95% (99%) of the photons having energy lower than 150 keV (15 keV). The Pb/Al container also produces approximate charged particle equilibrium for silicon devices.
a) b)
Figure 26 – a) Pb and b) Al thickness as a function of the photon energy to attenuate the photons at different percentage values.
4.2
Research activities at Calliope facility
Research activities in which Calliope facility is involved concern the investigation of gamma irradiation effects on chemical and physical properties of different materials for several applications, such as radiation
36
processing on industrial materials (polymers and optical fibres) and devices to be used in hostile radiation environment (nuclear plants, aerospace experiments and High Energy Physics experiments), scintillating materials (crystals and glasses) used as detectors in High and Medium Energy Physics experiments, Cultural Heritage, agriculture, Space and environmental applications.
The characterization analyses are carried out at the Calliope facility laboratory equipped with several instruments for the evaluation of optical (Perkin-Elmer Lambda 950 UV-VIS-NIR and FTIR SPECTRUM 100 spectrophotometers, Edinburgh Instrument FS5 fluorescence spectrometer), and spectroscopic (Bruker e-scan ESR spectrometer) behaviour of irradiated materials. A climatic chamber of 337 l capacity (ACS Discovery DM340C by Test Technologies Srl), operating at different temperature (-75°C/+180°C), relative humidity (10 % - 98 %) and atmosphere condition, was purchased for the characterization of materials and components to be used in hostile environment. The system is equipped with UV lamp (220 - 630 nm) accessory for combined ageing tests in the range 0 - 40°C. A dedicated oven to perform the annealing of electronic devices after the irradiation tests as well as furnaces for the thermal treatments of crystals and glasses are also available. Furthermore the HARSHAW TLD Model 3500 Manual Reader instrument, typically used for TLD dosimetry (as described in Section 3.1.4), allows to perform TLD measurements on solid and powdered samples.
In recent years, several research activities have focused on radiation damage studies of optical components, detectors and devices for the ITER International Thermonuclear Experimental Reactor Project (Figure 27) in collaboration with Fusion for Energy (F4E). In particular, tests at very high absorbed doses (up to 4 MGy) were performed on optical encoder, small scale optical filters and customized piezoelectric motor for the In-Vessel Viewing System (IVVS), a fundamental remote handling equipment, which will be used to make a survey of the status of the blanket first wall and divertor plasma facing components [39].
Neutron detector candidates for the ITER Radial Neutron Camera (RNC), designed to provide spatially resolved plasma temperature information, such as single-crystal diamonds and scintillator components (crystal and plastic scintillators, optical windows and PMTs), were irradiated and investigated to establish their radiation hardness and stability [40, 41].
Figure 27 – a) ITER scheme; b) irradiation set-up of optical filters and customized piezoelectric motor for the In-Vessel Viewing
37
In the last decades, great attention has been paid on radiation detectors, optical components and scintillators (optical fibres, crystals and glasses) applied in High Energy Physics experiments, investigating their radiation hardness in different irradiation conditions to achieve an improvement of their performances [34 - 146].
Several investigations on lead tungstate PbWO4 (PWO) scintillating crystals were performed in the
framework of CMS-ECAL Experiment at LHC (CERN, Geneva) and a considerable improvement of the crystal radiation resistance was achieved by the optimization of the lead tungstate crystal doping with large and stable trivalent ions, such as La3+, Lu3+, Gd3+ and Y3+ [102, 103, 106, 109, 111, 112, 117 - 124]. Besides the research activities above described, the Calliope facility was deeply involved in the qualification and testing of the PWO crystals with dedicated instruments and procedures to be used at CMS-ECAL experiment, that contributed to the Higgs boson identification [52, 53]. PWO crystals and the experimental set-up used for their optical characterization before and after irradiation are shown in Figure 28.
Figure 28 - Lead tungstate scintillating crystals for CMS ECAL experiment at LHC CERN.
R&D studies were performed on doped and undoped cesium iodide crystals (CsI) radiation hardness for the Belle II experiment at SuperKEKB (Japan), in order to upgrade the calorimeter to cope with the higher luminosity, pile-up and occupancy [128 - 130, 134, 139, 140]. Cesium iodide scintillating crystals for Belle II experiment at SuperKEKB with Lumen optical bench for UV-VIS measurements carried out in the dark and in dry air atmosphere are shown in Figure 29.
Synthetic and natural polymeric materials used in many fields (e.g. nuclear and space application, medical devices, food packaging, cultural heritage4, coupling materials for optoelectonic devices) are studied in term of gamma irradiation induced processes (cross-linking and degradation). Their behaviour is evaluated in
4
IAEA Coordinated Research Project ‘F23032’ “Developing Radiation Treatment Methodologies and New Resin Formulation for Consolidation And Preservation of Archived Materials and Cultural Heritage Artefacts - Research Agreement No. 18922/R0 “Radiation Processing for Bio-Deteriorated Archived Materials and Consolidation of Porous Artefacts” (May 2015-May 2020).
38
different atmospheric conditions (air, vacuum or inert gases), paying particular attention to the irreversible modification occurring during or after the end of gamma irradiation [147 - 164].
Figure 29 - Cesium iodide scintillating crystals for Belle II experiment at experiment at SuperKEKB.
At the Calliope facility, biological researches for the conservation and preservation of cultural heritage archived materials (books, images) are related to the bio-deteriogen eradication assisted by gamma radiation and to the assessment of the recovery procedures (Figure 30) [165 - 170].
Optical coupling materials (optical grease, silicon and epoxy resins), usually applied to ensure good optical matching in optoelectronic systems, and wavelength shifter devices were investigated to establish their radiation hardness and stability under gamma and neutron irradiation (Figure 31) [128, 134].
Recently, due to the increased interest to biopolymers in food industry and human nutrition, spectroscopic and luminescence analyses were performed to investigate the ionizing radiation effects on polysaccharides and proteins [171].
a) b)
Figure 30 - a) Ancient books damaged by floading [165]; b) ink stability study on irradiated photographic paper samples affected by
39
Figure 31 – a) Example of optical coupling material application; b) epoxy and c) silicon resins; d) LumInnoTech NOL9 wavelengthshifter [128].
Other biological activities are related to the agriculture, the environmental and AgroSpace, such as agricultural product treatments, biological control of pests assisted by gamma irradiation (SIT, Sterile Insect Technique) and development of plant-based platforms for use in spacecraft and extreme astrophysical conditions (Figure 32) [172 - 178].
a) b)
Figure 32: a) Biological control (SIT) of Ryncophorus ferrugineus, pest for palm trees, assisted by gamma irradiation [172]; b)
tomato plants by hydroponic horticultures [176, 177].
ACNOWLEDGEMENTS
Authors are grateful to the National Institute of Ionizing Radiation Metrology (INMRI at ENEA-Casaccia) for the Fricke dosimeter solution periodical calibration.
Some of the technical improvements carried out at the Calliope facility were partially supported by the Italian Space Agency (ASI) in the framework of the ASIF Programme.
40
REFERENCES
1. Segre’ E., Nuclei and particles, W.A. Benjamin, Inc., New York, 1965. 2. Amaldi U., Fisica delle radiazioni, Bollati Boringhieri Ed., 1971.
3. ASTM E170-17, Standard Terminology Relating to Radiation Measurements and Dosimetry, ASTM Int., West Conshohocken, PA, 2017, www.astm.org.
4. Roesch W.C., Attix F.H., “Basic concepts of dosimetry”, in Radiation dosimetry, Roesch, W.C., Attix, F.H. Ed., Academic Press, New York, 1968.
5. Pelliccioni M., Elementi di dosimetria delle radiazioni, ENEA, 1983.
6. Tabata Y., Ito Y., Tagawa S., Handbook of Radiation Chemistry, CRC Press, 1991.
7. Rutledge A.R., Smith L.V., Merrit J.S., “Experimental study of half-life determinations using 60Co” (1983) NIMA, 206, p. 211.
8. Price W.J., Rivelazioni delle radiazioni nucleari, Bulzoni Ed., Rome, 1972.
9. Leo W.R., Techniques for nuclear and particle physics experiments, Springer-Verlag, 1991.
10. ICRU Report 85, Fundamental quantities and units for ionizing radiation, Oxford University Press, 2011.
11. Pelliccioni M., Fondamenti fisici della radioprotezione, Pitagora Ed., Bologna,1993.
12. IEC 60544-1, Electrical insulating materials - Determination of the effects of ionizing radiation - Part 1: Radiation interaction and dosimetry, 2013.
13. ISO/ASTM51026-15, Standard Practice for Using the Fricke Dosimetry System, ASTM International, West Conshohocken, PA, 2015, www.astm.org.
14. ISO/ASTM51276-12, Standard Practice for Use of a Polymethylmethacrylate Dosimetry System, ASTM International, West Conshohocken, PA, 2010, www.astm.org.
15. ISO/ASTM51607-13, Standard Practice for Use of the Alanine-EPR Dosimetry System, ASTM International, West Conshohocken, PA, 2012, www.astm.org.
16. Cameron J.R., “Radiophotoluminescent and thermoluminescent dosimetry”, in Manual on Radiation
Dosimetry, Marcel Dekker, New York 1970.
17. Fowler J.H., Attix F.H. In: Attrix F.H., Roesch W.C. Ed. Radiation dosimetry, vol II. International Atomic Energy Agency, New York, p. 367, 1966.
18. Horowitz Y.S., Thermoluminescence and thermoluminescence dosimetry, CRC Press, Boca Raton, 1984.
19. McLaughlin W.L. et al., " in Handbook of nuclear chemistry. Vol. 5., Springer, Boston, 2003.
20. Mahmoud A.G., Arafat D-E., Sharabati H, “Characterization of TL-glow curves resulting from sensitized TLD-100”, J. Phys. D: Appl. Phys. (1999) 31(2), pp. 224-230. DOI: 10.1088/0022-3727/31/2/008.
21. Christensen P., Botter-Jensen L., Majborn B., “Thermoluminescence dosimetry applied to radiation protection” Int. J. Appl. Radiat. Isot. (1982) 33, p. 1035.
41
22. De Planque G., Gesell T.F., “Thermoluminescence dosimetry - Environmental applications”, Int. J. Appl. Radiat. Isot. (1982) 31, p. 1015.
23. Baccaro S. et al., “In-phantom dose mapping in neutron capture therapy by means of solid state detectors”, NIMB (2004) 213, pp. 666-669.
24. Cecilia A. et al., “Alanine and TLD coupled detectors for fast neutron dose measurements in neutron capture therapy (NCT)”, Rad. Prot. Dosim. (2004) 110, Nos 1-4, pp. 637-640.
25. Angelone M. et al., “Mixed n–γ fields dosimetry at low doses by means of different solid state dosimeters” Radiat. Meas. (2011) 46, Issue 12, pp. 1737-1740.
26. Mukherjee B. et al., “An ultra sensitive fast neutron area monitor using gadolinium covered aluminium oxide dosimeter (TLD-500) chips”, Radiat. Meas. (2011) 46, Issue 12, pp. 1698-1700. 27. Ávila O., Ramírez-Barbosa E., Gamboa-deBuen I., “Energy dependence of TLD-900 dosimeters
exposed to low energy X-rays”, Radiat. Meas. (2014) 71, pp. 127-132.
28. Hubbell J.H., “Photon mass attenuation and energy-absorption coefficients”, Int. J. Appl. Radiat. Isot. (1982) 33 (11), pp. 1269-1290.
29. Hubbell J.H., Seltzer S.M., “Tables of X-rays Mass Attenuation Coefficients and Mass Energy-Absorption Coefficients, from 1 keV to 20 MeV for elements Z=1 to 92 and 48 Additional Substances of Dosimetric Interest”, 2004.
30. Baccaro S., D’Atanasio P., “Qualification of Nuclear Systems and Components – ENEA expertise and facilities”, ENEA, 2010.
31. IAEA Safety Standards Series No. GSG-1, "Classification of radioactive waste", 2009
32. Total dose steady-state irradiation test method, ESA/SCC Basic Specification No. 22900 (Issue 5),
European Space Agency.
33. Ionizing radiation (total dose) test procedure, MIL-STD-883E, method 1019.4.
34. Schwank J.R. et al., “Radiation effects in MOS oxides” IEEE Trans. Nucl. Sci. (2008) 55 (4) 4636929, pp. 1833-1853.
35. CMS Technical Proposal, CERN/LHCC 94-38 (1994). 36. ATLAS Technical Proposal, CERN/LHCC 94-43 (1994).
37. Krivda M. et al., “The ALICE silicon pixel detector readout electronics” NIMA (2010) 617 (1-3), pp. 549-551.
38. Albergo S. et al., “Test results of heavily irradiated Si detectors” NIMA (1999) 422 (1-3), pp. 238-241.
39. Rossi P. et al., “IVVS actuating system compatibility test to ITER gamma radiation conditions”, Fusion Eng. Des. (2013) 88 (9-10), pp. 2084-2087.
40. Pompili F. et al., “Radiation and thermal stress test on diamond detectors for the Radial Neutron Camera of ITER”, NIMA (2019), in press.
41. Baccaro S. et al., “Radiation damage tests on diamond and scintillation detector components for the ITER Radial Neutron Camera”, IEEE Trans. Nucl. Sci. (2018) 65 (8), pp. 2046- 2053.

![Figure 13 - Relative probability of photoelectric, Compton and pair production effects [8]](https://thumb-eu.123doks.com/thumbv2/123dokorg/5600790.67705/17.892.241.666.383.659/figure-relative-probability-photoelectric-compton-pair-production-effects.webp)